Abstract
Metazoans identify and eliminate bacterial pathogens in microbe-rich environments such as the intestinal lumen, however the mechanisms are unclear. Potentially, host cells employ intracellular surveillance or stress response programs to detect pathogens that target monitored cellular activities to initiate innate immune responses1–3. Mitochondrial function is evaluated by monitoring mitochondrial protein import efficiency of the transcription factor ATFS-1, which mediates the mitochondrial unfolded protein response (UPRmt). During mitochondrial stress, import is impaired4 allowing ATFS-1 to traffic to the nucleus where it mediates a transcriptional response to re-establish mitochondrial homeostasis5. Here, we examined the role of ATFS-1 during pathogen exposure because in addition to mitochondrial protective genes, ATFS-1 induced innate immune genes during mitochondrial stress that included a secreted lysozyme and anti-microbial peptides. Exposure to the pathogen Pseudomonas aeruginosa caused mitochondrial dysfunction and activation of the UPRmt. Animals lacking atfs-1 were susceptible to P. aeruginosa, while hyper-activation of ATFS-1 and the UPRmt improved clearance of P. aeruginosa from the intestine and prolonged C. elegans survival largely independent of known innate immune pathways6,7. We propose that ATFS-1 import efficiency and the UPRmt is a means to detect pathogens that target mitochondria and initiate a protective innate immune response.
Animals harbor bacteria that are essential for normal physiology8, however they must distinguish between commensal and pathogenic microbes to maintain homeostasis. Pathogenic bacteria can be recognized directly or by damage inflicted by the pathogen9 leading to activation of innate immunity responses that limit pathogen growth. Recently, it has been demonstrated that perturbations to protein synthesis, proteolysis, or mitochondrial activity are sufficient to activate innate immune responses suggesting the elegant hypothesis that host cells utilize intracellular stress responses to initiate innate immunity programs when pathogens perturb monitored cellular processes1–3.
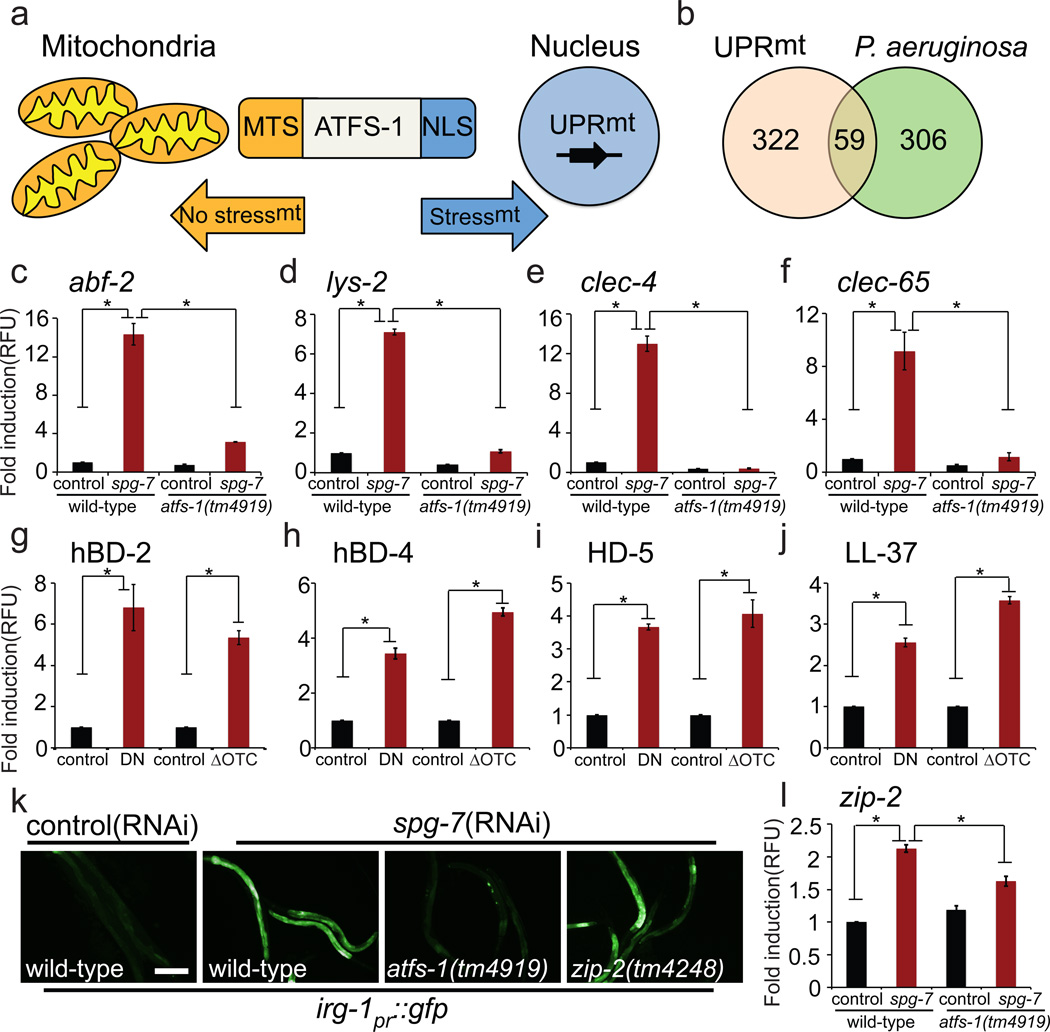
Cells respond to mitochondrial dysfunction by activating the UPRmt, which is regulated by the transcription factor ATFS-1. In healthy cells, ATFS-1 is efficiently imported into mitochondria and degraded. However, during mitochondrial stress, import efficiency is reduced4,5, allowing a small percentage of ATFS-1 to accumulate in the cytosol5. Because ATFS-1 has a nuclear localization sequence (NLS), it then traffics to the nucleus where it activates a protective transcriptional response (Fig. 1a). Our expression profiling studies indicated that ATFS-1 induces genes that promote mitochondrial protein folding, ROS detoxification and mitochondrial protein import, suggesting the UPRmt stabilizes the mitochondrial protein folding environment to promote organelle homeostasis5.
Figure 1. ATFS-1 induces innate immunity genes during mitochondrial dysfunction.
a, UPRmt regulation.
b, ATFS-1-dependent UPRmt genes5 in common with genes induced by P. aeruginosa10.
c–f, abf-2, lys-2, clec-4 and clec-65 transcripts in wild-type or atfs-1(tm4919) worms on control versus spg-7(RNAi) (N=3, ± SD), * p<0.05 (Student’s t test).
g–j, Antimicrobial peptide transcripts in mammalian cells during mitochondrial stress caused by expression of dominant-negative AFG3L2 (DN), or misfolded ornithine transcarbamylase (ΔOTC) (N=3, ± SD), * p<0.05 (Student’s t test).
k, irg-1pr::gfp in wild-type, atfs-1(tm4919) or zip-2(tm4248) worms on control versus spg-7(RNAi). Scale bar, 0.15 mm.
l, zip-2 transcripts in wild-type or atfs-1(tm4919) worms on control or spg-7(RNAi) (N=3, ± SD), * p<0.05 (Student’s t test).
Intriguingly, a number of transcripts induced during mitochondrial stress caused by inhibition of the mitochondrial protease SPG-7 encode innate immunity proteins5 (Extended Data Table 1), some of which were also found to be induced following exposure to the pathogen P. aeruginosa10 (Fig. 1b and Extended Data Table 2). The antimicrobial peptide abf-2 and the secreted lysozyme lys-2, both of which are required for resistance to pathogen infection11,12, were induced during mitochondrial stress (Fig. 1c–d), as were two C-type lectins, which are involved in pathogen recognition13 (Fig. 1e–f). Of note, mitochondrial-specific stress also caused induction of antimicrobial peptides14 in mammalian cells (Fig. 1g–j), suggesting the response is conserved. In C. elegans, induction of innate immune genes by spg-7(RNAi) required ATFS-1 (Fig. 1c–f). Thus, in addition to inducing mitochondrial-protective genes, ATFS-1 also transcriptionally up-regulated innate immune genes during mitochondrial stress. Therefore, we hypothesized that ATFS-1 and the UPRmt are involved in regulating innate immunity during exposure to pathogens that perturb mitochondrial function.
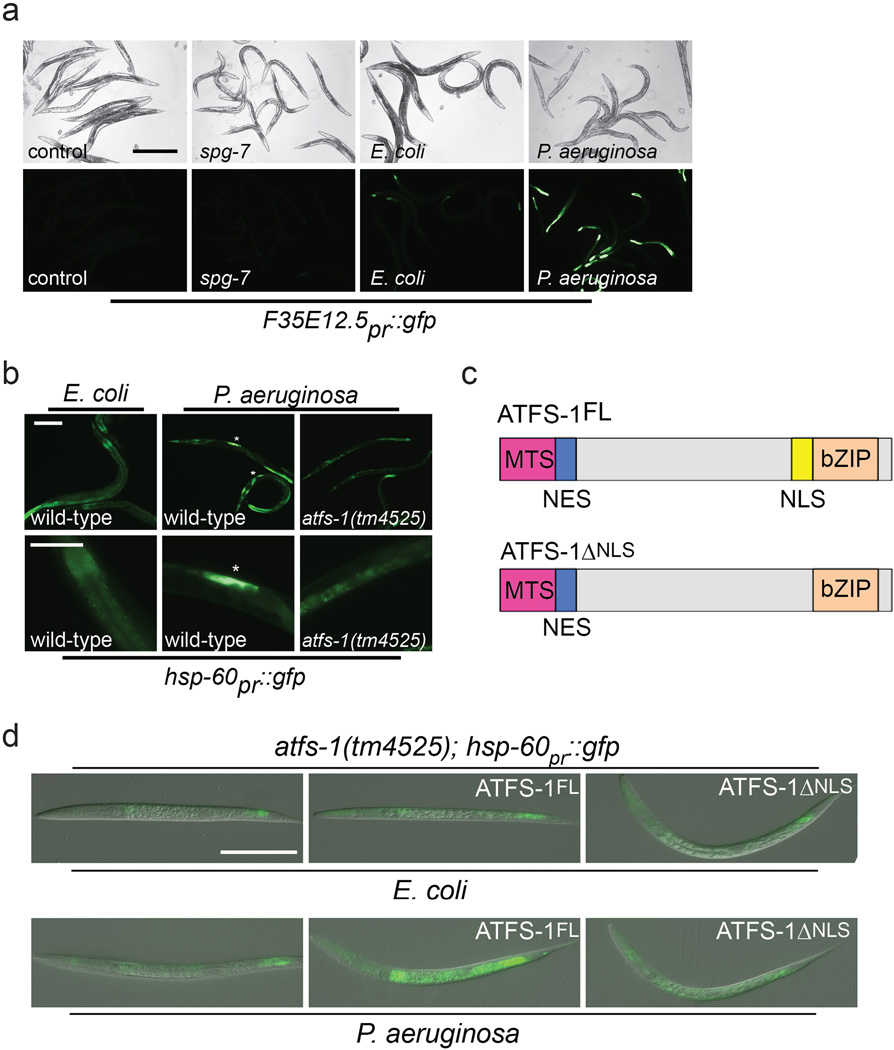
P. aeruginosa produces virulence factors that target many cellular functions including the mitochondrial toxins cyanide and pyocyanin15,16. P. aeruginosa also produces exotoxin A, which impairs protein synthesis and leads to the induction of the innate immune gene irg-1 via the transcription factor ZIP-22,3,17. Mitochondrial stress also caused irg-1pr::gfp induction, which was blocked in atfs-1(tm4919) and partially so in zip-2(tm4248) worms (Fig. 1k), suggesting that multiple transcription factors and stressors influence innate immune gene expression. Additionally, zip-2 mRNA was induced during mitochondrial stress, which also required atfs-1 (Fig. 1l). Of note, F35E12.5, which is induced by the MAP kinase PMK-1 and the transcription factor ATF-7 during P. aeruginosa exposure10,18, was not induced during mitochondrial stress (Extended Data Fig. 1a). Thus, ATFS-1 regulates a subset of innate immune genes during mitochondrial stress in addition to its cytoprotective role in promoting mitochondrial homeostasis.
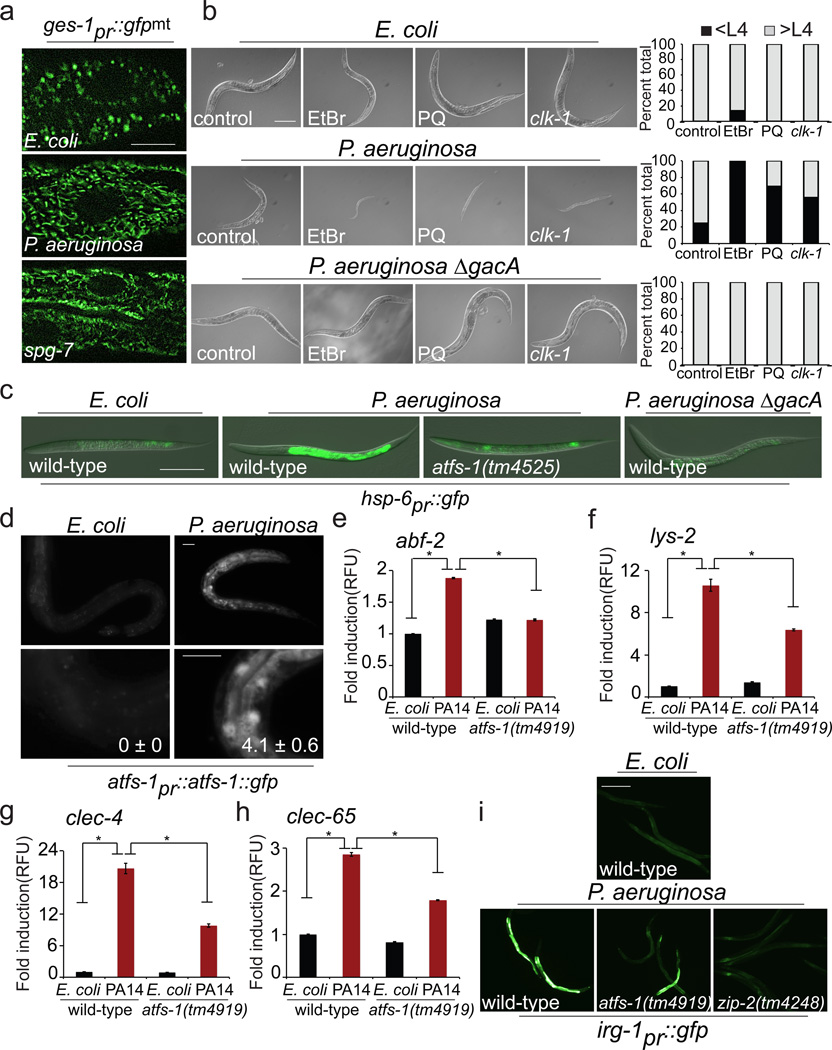
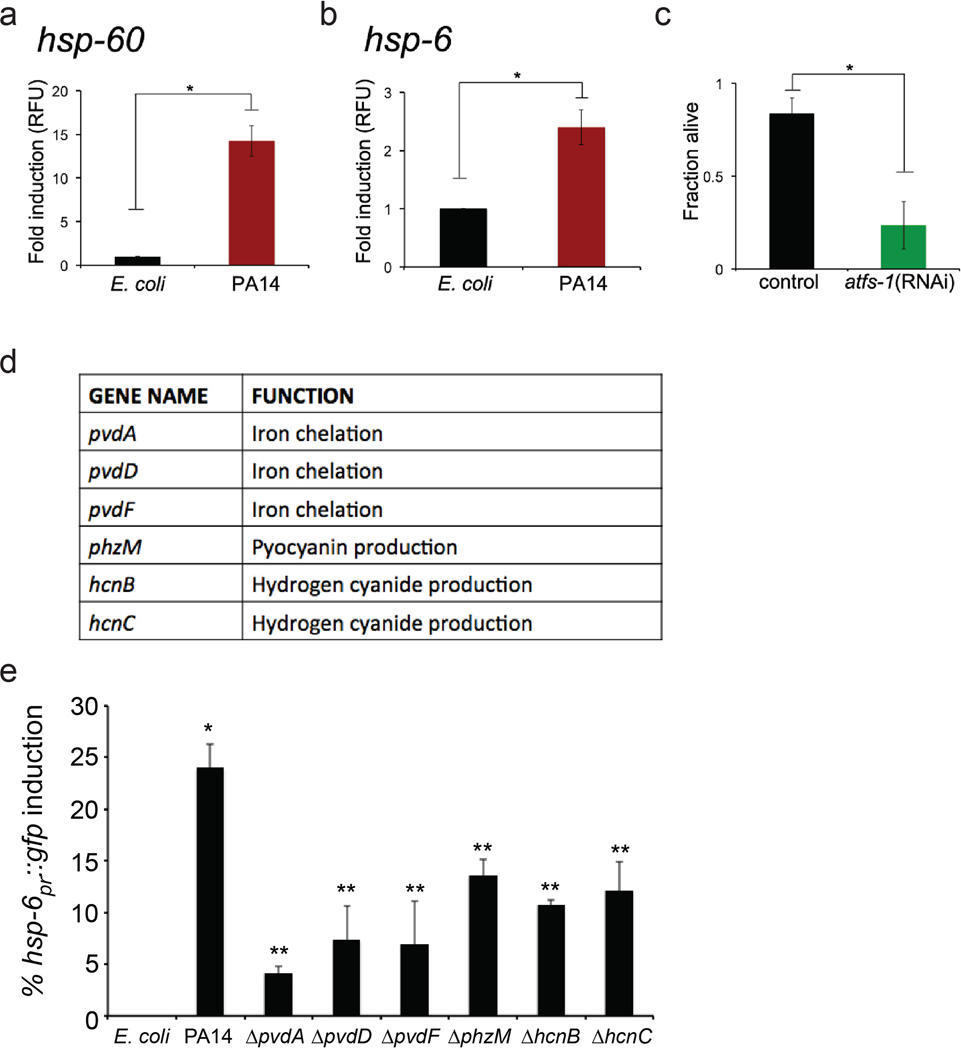
We next examined if P. aeruginosa exposure caused mitochondrial stress capable of activating the UPRmt. Slow-killing conditions were used in which the pathogen accumulates in the intestine leading to infection19. Interestingly, P. aeruginosa exposure caused intestinal cell mitochondria to elongate similar to spg-7(RNAi) (Fig. 2a), consistent with the pathogen causing mitochondria stress, and mitochondrial fusion providing protection20. Additionally, exposure to P. aeruginosa caused dramatic developmental delays in combination with mild mitochondrial stresses such as ethidium bromide5, paraquat5, or the clk-1(qm30) allele21 (Fig. 2b), consistent with the pathogen causing modest mitochondrial stress. Importantly, P. aeruginosa exposure caused increased mitochondrial chaperone reporter (hsp-6 and hsp-60pr::gfp) activation in the intestine that required atfs-1 (Fig. 2c and Extended Data Fig. 1b), which correlated with increased nuclear accumulation of ATFS-1::GFP and required the NLS in ATFS-1 (Fig. 2d and Extended Data Fig. 1c, d). Exposure to P. aeruginosa liquid-killing conditions, which requires pathogen expressed iron chelating siderophores22, also induced mitochondrial chaperone genes, suggesting multiple P. aeruginosa virulence factors can activate the UPRmt (Extended Data Fig. 2a, b). Interestingly, both synthetic growth arrest and UPRmt activation by P. aeruginosa required the global virulence activator gene gacA23 (Fig. 2b, c). Furthermore, exposure to P. aeruginosa strains lacking individual siderophore, pyocyanin or cyanide toxin genes resulted in less UPRmt activation than wild-type P. aeruginosa (Extended Data Fig. 2d, e), suggesting that multiple pathogen toxins target mitochondrial function resulting in UPRmt activation. However, UPRmt activation may also be due to indirect damage associated with activation of a separate immune response24.
Figure 2. Mitochondrial stress and UPRmt activation by P. aeruginosa.
a, ges-1pr::gfpmt intestinal cell mitochondria on E. coli, P. aeruginosa or spg-7(RNAi). Scale bar, 0.05 mm.
b, Worms treated with ethidium bromide (EtBr), paraquat (PQ), and clk-1(qm30) worms raised on E. coli, P. aeruginosa or P. aeruginosa ΔgacA. Quantitation of the developmental stage for each treatment shown next to the corresponding panel (N=35 each treatment). Scale bar, 0.1 mm.
c, Wild-type or atfs-1(tm4525);hsp-6pr::gfp worms on E. coli, P. aeruginosa or P. aeruginosa ΔgacA. Scale bar, 0.1 mm.
d, atfs-1pr::atfs-1::gfp on E. coli or P. aeruginosa. Lower panels are magnified. (N=3). Mean percentages of ATFS-1::GFP nuclear accumulation are indicated (± SEM). Scale bars, 0.1 mm.
e–h, abf-2, lys-2, clec-4 and clec-65 transcripts in wild-type or atfs-1(tm4919) worms on E. coli or P. aeruginosa (N=3, ± SD), * p<0.05 (Student’s t test).
i, Wild-type, atfs-1(tm4919) and zip-2(tm4248) irg-1pr::gfp worms on E. coli or P. aeruginosa. Scale bar, 0.05 mm.
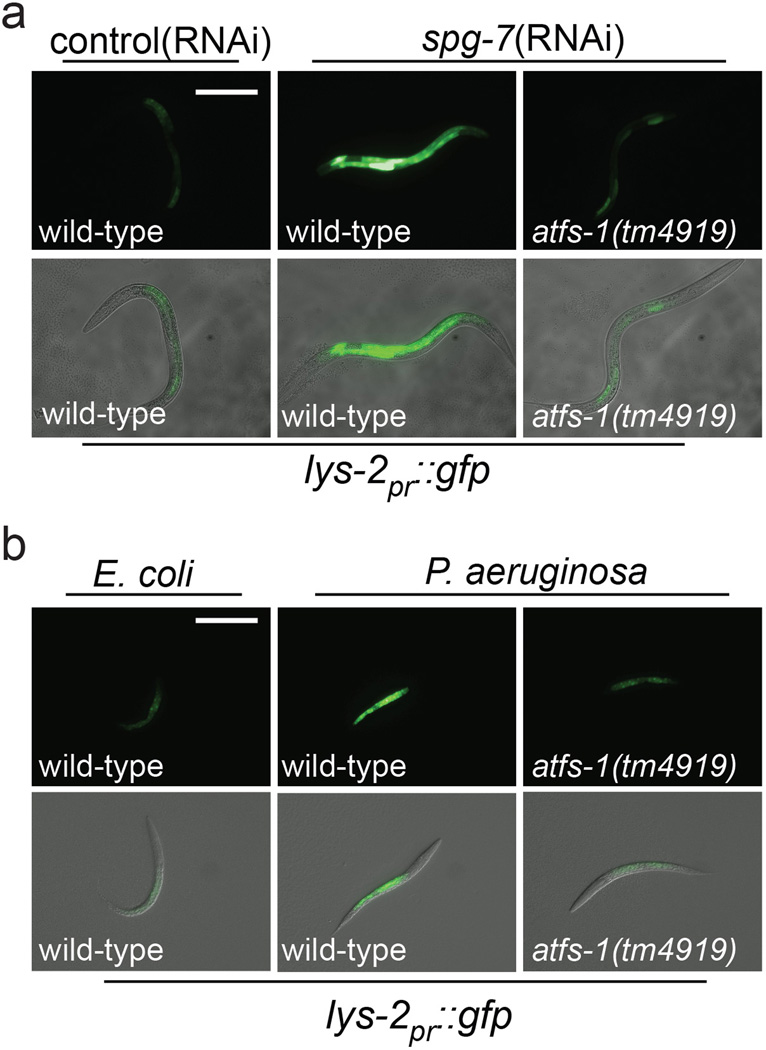
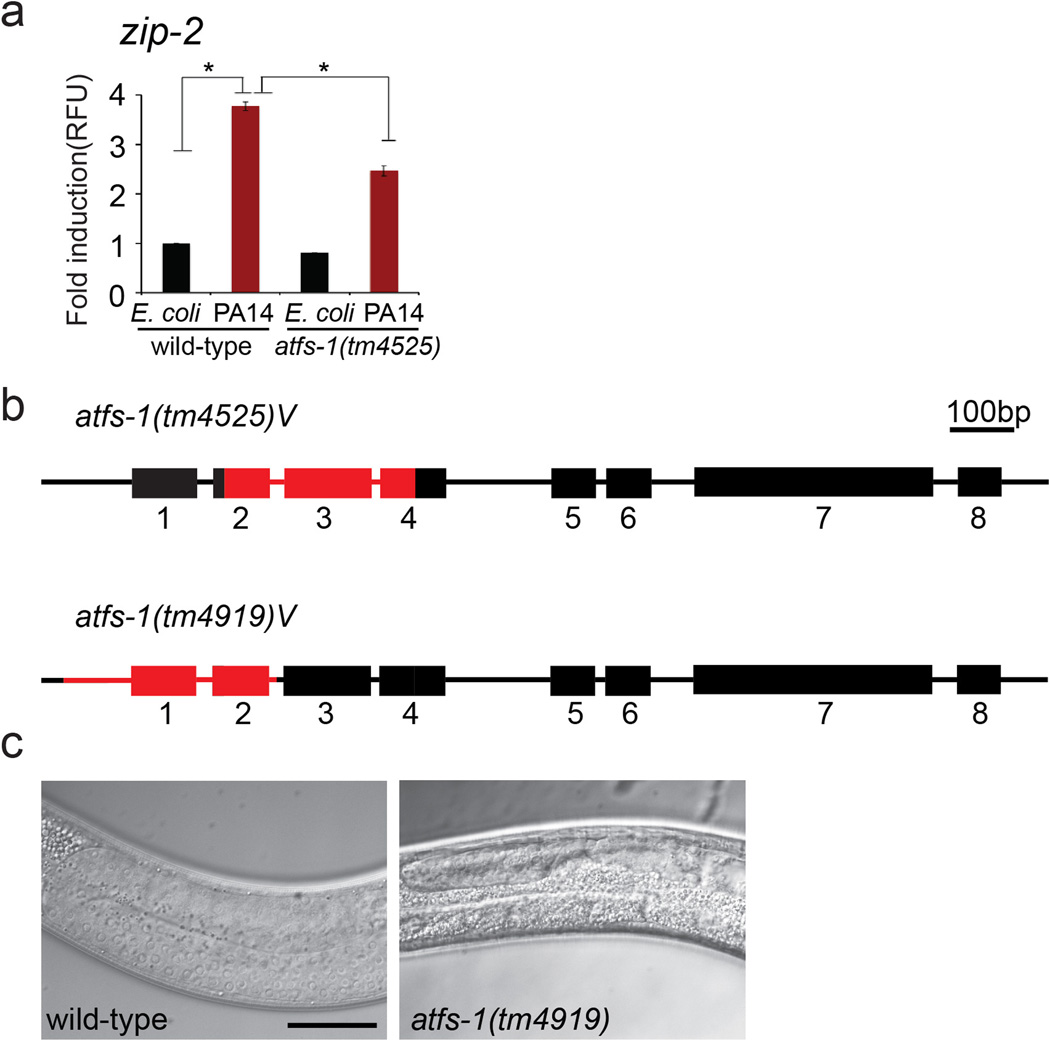
We examined the role of ATFS-1 in the induction of innate immune genes during P. aeruginosa exposure rather than specifically during mitochondrial stress. Similarly, abf-2, lys-2, clec-4 and clec-65 were induced upon P. aeruginosa exposure, which also required atfs-1 (Fig. 2e–h). And similar to the mitochondrial chaperones, both lys-2pr::gfp and irg-1pr::gfp were induced in the intestine upon P. aeruginosa exposure (Fig. 2i and Extended Data Fig 3). Interestingly, increased irg-1pr::gfp expression was impaired in both atfs-1(tm4919) and zip-2(tm4248) mutants (Fig. 2i). Furthermore, zip-2 transcript induction on P. aeruginosa17 was also partially impaired in atfs-1 mutant worms, suggesting atfs-1 can function upstream of zip-2 (Extended Data Fig. 4a).
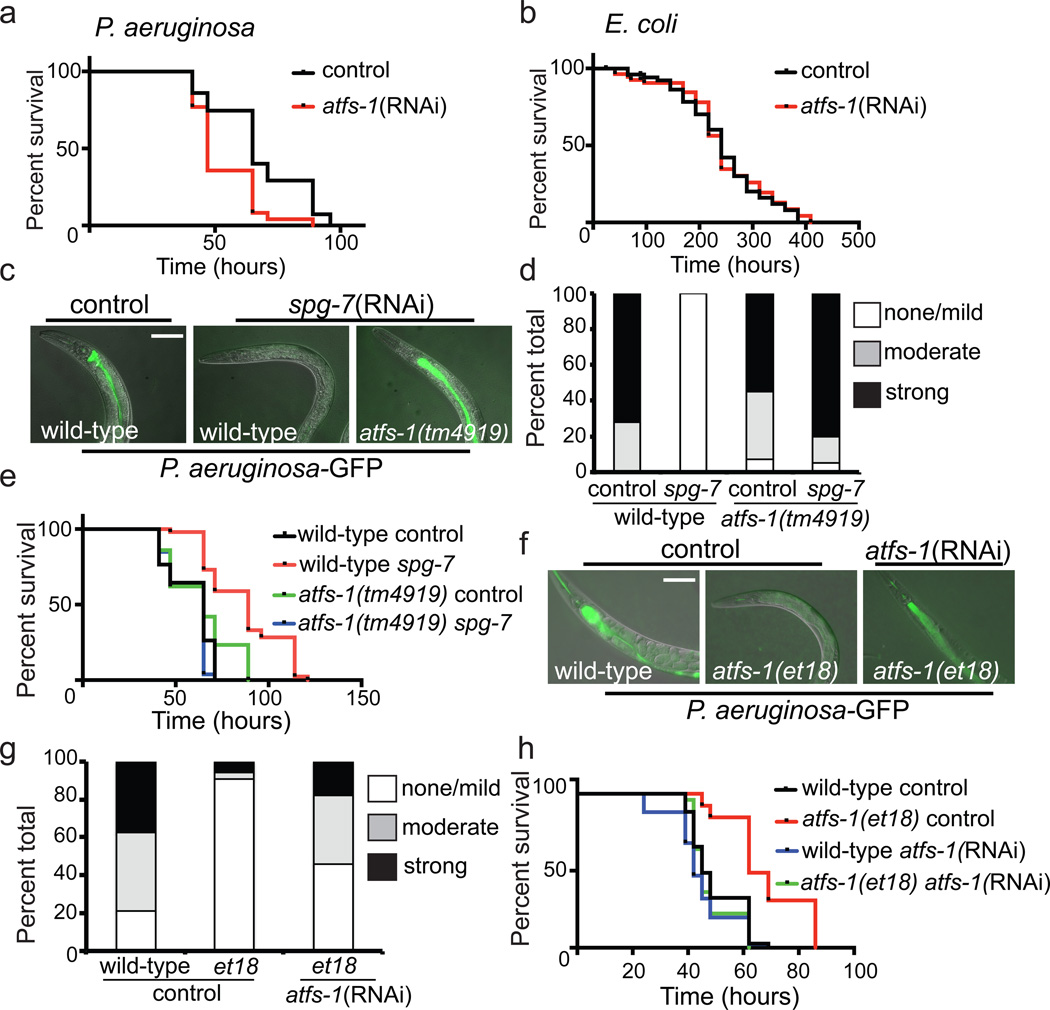
Consistent with a role for ATFS-1 in inducing innate immune and mitochondrial protective genes5, the survival of worms raised on atfs-1(RNAi) was significantly reduced when exposed to P. aeruginosa, but not E. coli (Fig. 3a–b). atfs-1(RNAi) treated worms were also susceptible to P. aeruginosa liquid-killing (Extended Data Fig. 2c), supporting a role for ATFS-1 in activating a protective transcriptional response to pathogen exposure. Of note, RNAi was used to reduce atfs-1 activity for the survival studies rather than atfs-1(tm4919) because of germline defects that complicate the analysis (Extended Data Fig. 4b, c).
Figure 3. UPRmt activation provides resistance to P. aeruginosa.
a–b, Survival of worms on control or atfs-1(RNAi) exposed to P. aeruginosa or E. coli. Statistics are in Extended Data Table 3.
c–d, Images and quantitation of P. aeruginosa-GFP in wild-type or atfs-1(tm4919) worms on control or spg-7(RNAi). Scale bar, 0.1 mm. (N=35 each treatment).
e, Survival of wild-type and atfs-1(tm4919) worms on control or spg-7(RNAi) exposed to P. aeruginosa. Statistics are in Extended Data Table 3.
f–g, Images and quantitation of P. aeruginosa-GFP in wild-type and atfs-1(et18) worms on control or atfs-1(RNAi) (N=35 each treatment). Scale bar, 0.1 mm.
h, Survival of wild-type and atfs-1(et18) worms on control or atfs-1(RNAi) exposed to P. aeruginosa. Statistics are in Extended Data Table 3.
We next examined if UPRmt activation is sufficient to protect against P. aeruginosa. The UPRmt was induced by allowing worms to develop on spg-7(RNAi) for two days5 prior to pathogen exposure. UPRmt pre-activation dramatically reduced the intestinal accumulation of P. aeruginosa expressing GFP (P. aeruginosa-GFP19 (Fig. 3c, d)). Importantly, P. aeruginosa-GFP accumulated in the intestine of atfs-1(tm4919) worms following spg-7(RNAi) treatment indicating that UPRmt activation promotes pathogen clearance. In addition to adapting transcription, worms are also able to avoid P. aeruginosa, which was unaffected by atfs-1(tm4919) or pretreatment with spg-7(RNAi) (Extended Data Fig. 5a–e). Consistent with increased pathogen clearance via anti-microbial gene induction, UPRmt pre-activation prolonged the survival of animals challenged with P. aeruginosa, which required atfs-1 (Fig. 3e) and was independent of germline defects or feeding behavior (Extended Data Fig. 5f–g).
Because mitochondrial stress can activate multiple stress response pathways in addition to the UPRmt 25,26, we examined an atfs-1 gain-of-function mutant, which constitutively activates the UPRmt independent of mitochondrial dysfunction. atfs-1(et18) worms express ATFS-1 with an amino acid substitution in the mitochondria targeting sequence that reduces mitochondrial import efficiency causing constitutive UPRmt activation27 and innate immune gene induction (Extended Data Fig. 6a–e). Impressively, atfs-1(et18) worms accumulated less P. aeruginosa-GFP in the intestine (Fig. 3f, g) and survived longer than wild-type worms (Fig. 3h) indicating that UPRmt activation is sufficient to provide resistance to P. aeruginosa. Importantly, atfs-1(RNAi) and lys-2(RNAi) reduced atfs-1(et18) worm survival (Fig. 3h and Extended Data Fig. 6f), suggesting that ATFS-1-mediated innate immune gene induction provides resistance to P. aeruginosa.
Inhibition of additional cellular activities including translation (eft-2), mRNA splicing (T08A11.2), calcium transport (sca-1) and the pentose phosphate pathway (T25B9.9) also induce innate immune gene expression1–3 but do not induce the UPRmt (Extended Data Fig. 7a, b). Thus, we examined if other stress-activated innate immune responses are also protective against P. aeruginosa. Knockdown of eft-2, T25B9.9, sca-1 or T08A11.2 did not increase survival on P. aeruginosa (Extended Data Fig. 7c) however, sca-1(RNAi) and T08A11.2(RNAi) decreased lifespan on E. coli, indicating a reduction in general fitness (Extended Data Fig. 7d). In contrast, knockdown of the mitochondrial ATP synthase subunit atp-2, which activates mitochondrial protective and innate immune gene expression (Extended Data Fig. 7a, b), prolonged survival during P. aeruginosa exposure (Extended Data Fig. 7c). Our data suggest the UPRmt provides protection from P. aeruginosa by coupling mitochondrial-protective and antimicrobial gene expression.
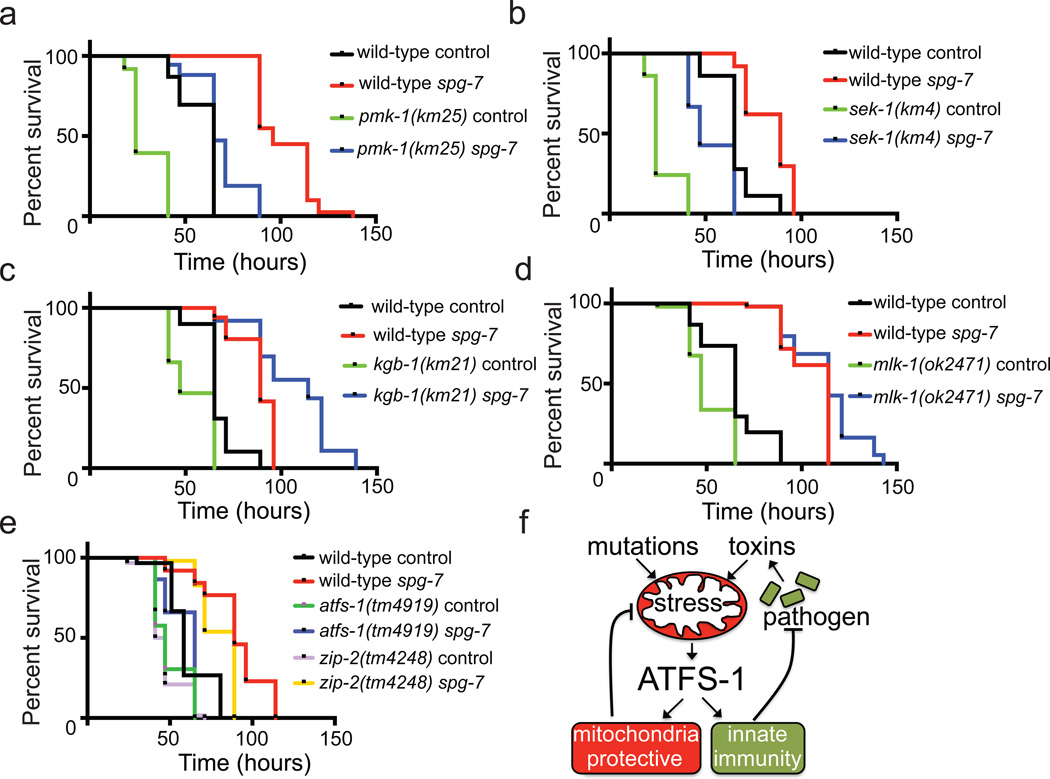
Lastly, we determined if ATFS-1 and the UPRmt interacted with established C. elegans innate immune pathways, which include a MAP kinase pathway mediated by NSY-1/SEK-1/PMK-16,7,10, the MLK-1/MEK-1/KGB-1 c-Jun kinase pathway7,28, as well as that mediated by ZIP-217. Interestingly, pre-activation of the UPRmt enhanced the survival of the pmk-1 and sek-1 mutants (Fig. 4a, b), as well as the kgb-1 and mlk-1 mutants (Fig. 4c, d). Of note, increased survival by spg-7(RNAi) was further enhanced in kgb-1(km21) worms, consistent with kgb-1 being a negative regulator of the UPRmt 29 (Extended Data Fig. 7e). Alternatively, zip-2(tm4248) modestly reduced the enhanced resistance conferred by spg-7(RNAi) (Fig. 4e), consistent with atfs-1 functioning in the same pathway as zip-2 during mitochondrial stress. In sum, our data suggest that the UPRmt can function independent of the MAP and c-Jun kinase-regulated innate immune pathways.
Figure 4. UPRmt activation prolongs survival independent of known innate immune pathways.
a–d, Survival of wild-type, pmk-1(km25), sek-1(km4), kgb-1(km21) and mlk-1(ok2471) worms on control or spg-7(RNAi) exposed to P. aeruginosa. Statistics are in Extended Data Table 3.
e, Survival of wild-type, zip-2(tm4248) and atfs-1(tm4919) worms raised on control or spg-7(RNAi) and exposed to P. aeruginosa. Statistics are in Extended Data Table 3.
f, ATFS-1 signaling schematic.
Our studies indicate that the UPRmt is activated by and protects against P. aeruginosa, and thus support a mechanistic means5 by which host cells can detect pathogens that target mitochondrial function (Fig. 4f), which is consistent with only a subset of bacterial species inducing the UPRmt 30. Because ATFS-1 responds directly to mitochondrial dysfunction and induces a transcriptional response that is both mitochondrial protective5 and antimicrobial, the UPRmt is a uniquely comprised pathway to mitigate mitochondrial damage stemming from genetic defects or pathogen exposure (Fig. 4f).
METHODS
Worm and bacterial strains
The atfs-1(tm4919) mutant strain was a gift from the National BioResource Project and backcrossed to wild-type N2 twice. Worm strains were provided by the Caenorhabditis Genetics Center unless otherwise noted. Hermaphrodite worms were raised on the OP50 strain of E. coli unless they were treated with RNAi, in which the HT115 E. coli strain expressing the described RNAi plasmid was used31,32. Where indicated, worms were exposed to the pathogenic strain of P. aeruginosa, PA14.
Cell culture
Expression of dominant-negative AFG3L2 was induced in stable HEK293 cells by the addition of 1µg/ml tetracycline33 and the cells were harvested 48 hours later. The ΔOTC expression plasmid34 was transfected into Hela cells via Lipofectamine and the cells were harvested after 72 hours.
C. elegans slow-killing assay
Slow-killing experiments were performed as previously described35,36 with minor modifications. E. coli or P. aeruginosa overnight cultures were used to seed slow-killing nematode growth medium (NGM) agar plates (with 0.35% peptone). Plates were allowed to dry overnight at room temperature, incubated at 37°C for 24 hours and allowed to equilibrate at room temperature. Synchronized L1 worms were allowed to develop on E. coli until the L4 stage and then transferred to P. aeruginosa slow-killing plates and incubated at 25°C. RNAi was performed as described previously37. For atfs-1(RNAi) (Fig. 3a–b), eri-1(mg366) (enhanced RNAi) worms38 were raised on control or atfs-1(RNAi) bacteria at 16°C until the L4 stage. All animals were transferred to fresh P. aeruginosa slow-killing plates in a randomized fashion. Animals were counted at the described times and were scored as dead if they failed to respond when touched. Fifty worms were used per experiment and those that had crawled off the plate or exploded at the vulva were censored. All data related to the survival analysis is presented in Extended Data Table 3. Each experiment was performed in triplicate and the log rank (Mantel-Cox) statistical test was used to evaluate p values.
Intestinal mitochondrial morphology was visualized using ges-1pr::gfpmt worms39. The worms were synchronized by bleaching and allowed to hatch on plates containing P. aeruginosa and raised for 48 hours at 25°C. Visualization of hsp-6pr::gfp, hsp-60pr::gfp and atfs-1pr::atfs-1::gfp was performed essentially as described36,37. P. aeruginosa was grown at 16°C for 24 hours and seeded onto slow-killing plates. Plates were incubated overnight at room temperature. Synchronized L1s were transferred to P. aeruginosa plates and incubated at 20°C for 24 hours before imaging.
To examine growth rates, eggs were allowed to hatch on plates containing P. aeruginosa and raised for 3 days at 25°C. 30 µg/ml ethidium bromide or 0.2 mM paraquat was added to E. coli or P. aeruginosa slow-killing plates. For clk-1(qm30) growth rates, worms were raised for 4 days at 25°C.
Statistics
All experiments were performed three times yielding similar results and comprised of biological replicates. The sample size and statistical tests were chosen based on previous studies with similar methodologies and the data met the assumptions for each statistical test performed. No statistical methods were used in deciding sample sizes, nor were any blinded experiment performed. For all figures, the mean ± standard deviation (SD) is represented unless otherwise noted.
C. elegans liquid-killing assay
glp-4(bn2) worms were raised at 25°C to sterilize them while being fed atfs-1(RNAi). At the L4-early adult stage, the described worms were exposed to P. aeruginosa under conditions used for the liquid-killing assay40.
RNA isolation and quantitative real time PCR (qRT-PCR)
Total RNA was obtained using the RNA STAT reagent (Tel-Test Inc.) and used for cDNA synthesis via the iScript™ cDNA Synthesis Kit (Bio-Rad Laboratories). qRT-PCR was performed using Thermo-Scientific™; SyBr Green Maxima Mix. For Figures 1c–f and 1l, worms were hatched onto RNAi-expressing plates and harvested after 48 hours. For Figures 2e–h, synchronized L4 worms were fed on E. coli or P. aeruginosa for 8 hours using the slow-killing method prior to harvesting. For Extended Data Figures 2a–b, synchronized glp-4(bn2) L4 worms were raised in liquid culture using E. coli or P. aeruginosa for 16 hours. All values were normalized to wild-type worms grown on control bacteria for RNAi experiments (Fig. 1c–f, l) or wild-type worms grown on E. coli for P. aeruginosa experiments (Fig. 2e–h). act-3 and snb-1 mRNA were used as controls for slow-killing and liquid-killing experiments, respectively. HPRT mRNA was used as a control for dominant-negative AFG3L2 and ΔOTC experiments.
Primer sequences used for qRT-PCR: act-3: forward ATCCGTAAGGACTTGTACGCCAAC and reverse CGATGATCTTGATCTTCATGGTTC, abf-2: forward CGTGGCTGCCGACATCGACTT and reverse ATGCACAACCCCTGAGCCGC, lys-2: forward ATCGACTCGAACCAAGCTGCG and reverse TCGACAGCATTTCCCATTGAAGCGT, clec-4: forward GAGCGACACTGGTGACTGTG and reverse CCATCCAGAATAGGTTGGCG, clec-65: forward CCCGGTGGTGACTGTGAATA and reverse AGCTCATATTGTCGCTGGCA, zip-2: forward TCGACGAGCAAACGACCTAC and reverse CTTGTGGCGTGCTCATGTT, hsp-60: forward AGGGATTCGAGAGCATTCGTCAAG and reverse TGTGGCGACTTGAGCGATCTCTTC, hsp-6: forward GAAGATACGAAGACCCAGAGGTTC and reverse CAACCTGAGATGGGGAATACACT, snb-1: forward CCGGATAAGACCATCTTGACG and reverse GACGACTTCATCAACCTGAGC, hBD-2: forward GCCTCTTCCAGGTGTTTTTG and reverse GAGACCACAGGTGCCAATTT, hBD-4: forward ATGTGGTTATGGGACTGCCC and reverse AGCATGCATAGGTGTTGGGA, HD-5: forward TCCTTGCTGCCATTCTCCTG and reverse ACTGCTTCTGGGTTGTAGCC, LL-37: forward GCTGGGTGATTTCTTCCGGA and reverse CCTGGGTACAAGATTCCGCA, HPRT: forward CTTTGCTGACCTGCTGGATT and reverse TCCCCTGTTGACTGGTCATT.
P. aeruginosa intestinal accumulation assay
To examine bacterial accumulation in the worm intestine, wild-type or atfs-1(tm4919) worms were synchronized and raised on control or spg-7(RNAi) plates for 48 hours. Overnight cultures of P. aeruginosa expressing GFP (P. aeruginosa-GFP) were seeded onto slow-killing NGM plates, allowed to dry overnight at room temperature and then incubated at 37°C for 24 hours. To exclude pathogen avoidance as a means of decreased intestinal colonization, where indicated P. aeruginosa-GFP was also spread across the entire surface of the slow-killing plate (Extended Data Fig. 5d, e). Worms at the L4 stage were transferred to P. aeruginosa-GFP plates and allowed to feed for 24–48 hours prior to examination. The extent of bacterial accumulation was scored as either “none/mild”, “moderate” or “strong” as indicated (Extended Data Fig. 5c).
Plasmid construction
The hsp-16pr::atfs-1FL and hsp-16pr::atfs-1ΔNLS plasmids were described previously37. To construct the lys-2pr::gfp plasmid, a 803 base pair fragment of the lys-2 promoter sequence upstream of the start codon was amplified using PCR and cloned into the HindIII and PstI sites of pPD95.75. lys-2pr::gfp was microinjected into wild-type worms at a concentration of 20 ng/µl along with myo-3pr::mCherry at a concentration of 60 ng/µl.
P. aeruginosa avoidance assay
Synchronized L1 wild-type and atfs-1(tm4919) worms were allowed to develop on control or spg-7(RNAi) plates to the L4 stage and then transferred to E. coli or P. aeruginosa slow-killing plates for 17 hours when the worms were scored. The extent of avoidance was expressed as the percent of animals off of the bacterial lawn over the total the number of animals on the plate (Extended Data Fig. 5a, b).
Microscopy
C. elegans were imaged using a Zeiss AxioCam MRm mounted on a Zeiss Imager.Z2 microscope. Exposure times were the same in each experiment.
EXTENDED DATA
Extended Data Figure 1. Nuclear accumulation of ATFS-1 is required for UPRmt activation during P. aeruginosa exposure.
a, Representative photomicrographs of F35E12.5pr::gfp transgenic worms raised on control or spg-7(RNAi). No detectable increase in expression was observed following spg-7(RNAi) treatment. In contrast, strong expression of F35E12.5pr::gfp was observed following exposure to P. aeruginosa compared to E. coli controls. Scale bar, 0.5 mm.
b, Wild-type or atfs-1(tm4525);hsp-60pr::gfp worms on E. coli or P. aeruginosa. Lower panels are magnified views of the intestine showing enhanced expression of hsp-60pr::gfp (asterisks). Scale bars, 0.05 mm.
c, Diagrams of wild-type ATFS-1 (ATFS-1FL) and ATFS-1 with a mutated nuclear localization signal (ATFS-1ΔNLS).
d, Photomicrographs of atfs-1(tm4525);hsp-60pr::gfp worms expressing ATFS-1FL or ATFS-1ΔNLS via the hsp-16 promoter exposed to E. coli or P. aeruginosa. Scale bar, 0.1 mm.
Extended Data Figure 2. Multiple P. aeruginosa virulence genes contribute to UPRmt activation.
a–b, Expression of hsp-60 and hsp-6 mRNA for glp-4(bn2) worms exposed to E. coli or P. aeruginosa liquid-killing using qRT-PCR (N=3, ± SD). Fold inductions are normalized to wild-type E. coli test group, * p<0.05 (Student t-test).
c, Quantitation of survival for glp-4(bn2) worms raised on control or atfs-1(RNAi) and exposed to P. aeruginosa liquid-killing, *p<0.0001 (Student t-test).
d, List of P. aeruginosa toxin mutants.
e, Quantitation of the proportion of worms showing increased hsp-6pr::gfp expression in the intestine under slow-killing conditions. Exposure to P. aeruginosa caused hsp-6pr::gfp induction (N=3, ± SE), *p<0.05 (Student t-test). However, exposure to P. aeruginosa with mutations in the pvdA, pvdD, pvdF, phzM, hcnB, or hcnC toxin genes resulted in relatively less UPRmt activation (N=3, ± SE), **p<0.05 (Student t-test).
Extended Data Figure 3. Intestinal accumulation of lys-2 during mitochondrial stress and P. aeruginosa exposure requires ATFS-1.
a, Representative photomicrographs of wild-type and atfs-1(tm4919) worms carrying the lys-2pr::gfp transgene raised on control or spg-7(RNAi). Scale bar, 0.1 mm.
b, Representative photomicrographs of wild-type and atfs-1(tm4919) worms carrying the lys-2pr::gfp transgene exposed to E. coli or P. aeruginosa. Scale bar, 0.1 mm.
Extended Data Figure 4. ATFS-1 partially regulates zip-2 expression during P. aeruginosa exposure.
a, Expression levels of zip-2 mRNA in wild-type or atfs-1(tm4525) worms raised on E. coli or P. aeruginosa using qRT-PCR (N=3, ± SD), * p<0.05 (Student’s t test).
b, Schematic diagram of the atfs-1 genomic open reading frame showing positions of exons 1–8 (boxes) and locations of the tm45255 and tm4919 deletions in red. The tm4919 allele is a 334 base pair deletion beginning 107 base pairs upstream of the atfs-1 start codon and ends within the second intron of the atfs-1 genomic open reading frame.
c, Representative photomicrographs of a germline in wild-type and atfs-1(tm4919) worms. Scale bar, 0.02 mm.
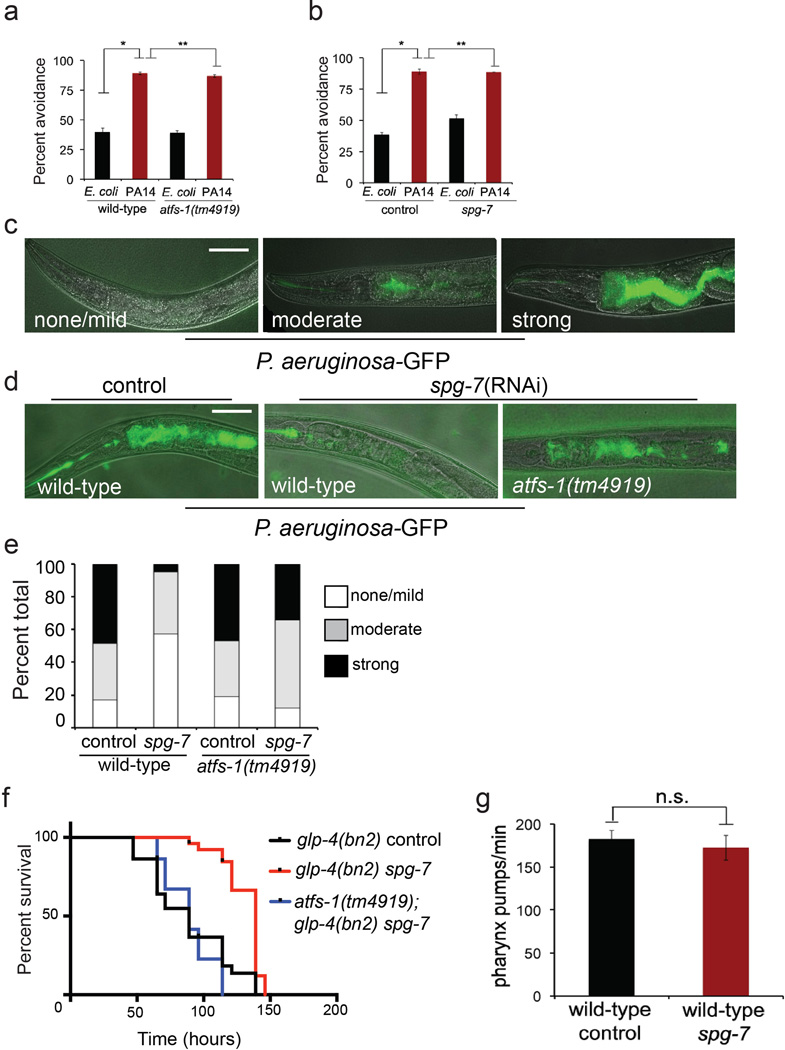
Extended Data Figure 5. ATFS-1 is not required for pathogen avoidance during P. aeruginosa exposure.
a, Quantitation of avoidance behavior for wild-type and atfs-1(tm4919) worms raised on E. coli or P. aeruginosa expressed as a percentage of the number of animals off the bacterial lawn relative to the total number worms (N=4, ± SD). *p<0.0001, **p=0.1914 (Student t-test).
b, Quantitation of avoidance behavior for wild-type worms raised on control or spg-7(RNAi) and exposed to E. coli or P. aeruginosa expressed as a percentage of the number of animals off the bacterial lawn relative to the total number worms (N=3, ± SD). *p<0.0001, **p=0.8706 (Student t-test).
c, Representative photomicrographs illustrating the scored level of infection for P. aeruginosa colonization assay using P. aeruginosa-GFP. Three categories of P. aeruginosa-GFP infection were used: none/mild, moderate and strong. Scale bar, 0.1 mm.
d, Representative photomicrographs of wild-type and atfs-1(tm4919) worms raised on spg-7(RNAi) and exposed to a lawn of P. aeruginosa-GFP that completely covered the surface of the slow-killing plate for 24 hours. Images are overlays of DIC and GFP. Scale bar, 0.1 mm.
e, Quantitation of P. aeruginosa intestinal colonization as shown in Extended Data Fig. 5d. White, grey and black bars denote no/mild infection, moderate infection and strong infection, respectively. Forty worms were analyzed per treatment.
f, Survival analysis of glp-4(bn2) and atfs-1(tm4919); glp-4(bn2) worms raised on control or spg-7(RNAi) and exposed to P. aeruginosa. Statistics for each survival analysis are presented in Extended Data Table 3.
g, Quantitation of pharyngeal pumping rate per minute for wild-type worms raised on control or spg-7(RNAi) (N=10, + SD). n.s., no significant difference (p=0.10; Student t-test).
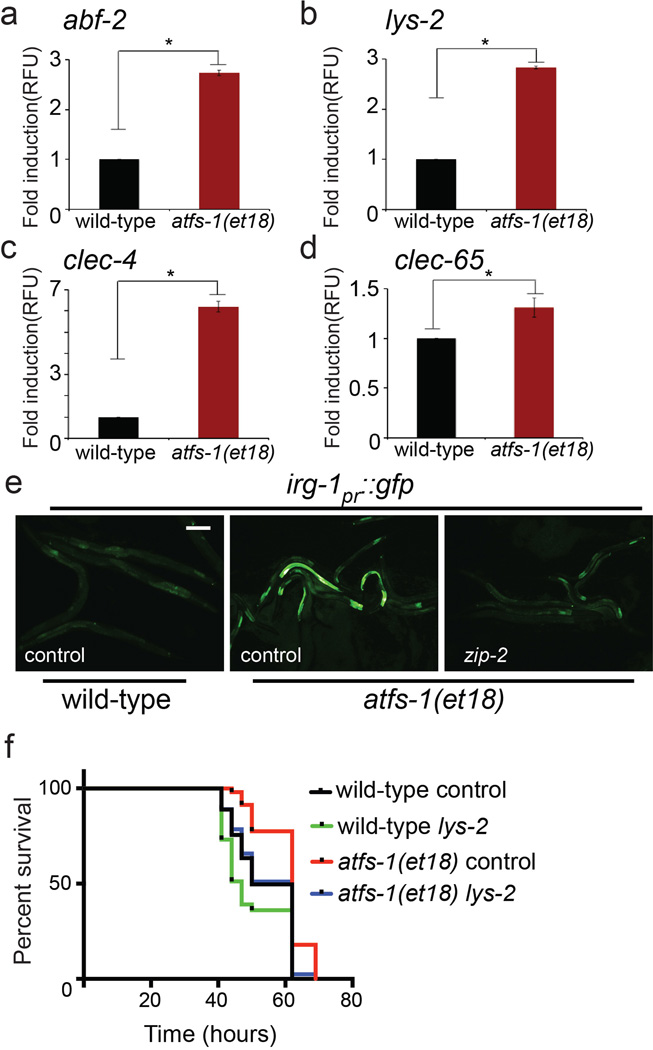
Extended Data Figure 6. atfs-1(et18) gain of function mutant worms induce innate immune gene expression in the absence of mitochondrial stress.
a–d, Expression levels of abf-2, lys-2, clec-4 and clec-65 mRNA in wild-type or atfs-1(et18) worms using qRT-PCR (N=3, ± SD), * p<0.05 (Student’s t test).
e, Representative photomicrographs of wild-type and atfs-1(et18) worms carrying the irg-1pr::gfp transgene raised on control or zip-2(RNAi). Scale bar, 0.10 mm.
f, Survival analysis of wild-type and atfs-1(et18) worms raised on control or lys-2(RNAi) and exposed to P. aeruginosa. Statistics for each survival analysis are presented in Extended Data Table 3.
Extended Data Figure 7. Mitochondrial protective and innate immune gene induction contributes to ATFS-1-mediated resistance to P. aeruginosa infection.
a, Representative photomicrographs of wild-type hsp-60pr::gfp worms raised on control, atp-2(RNAi), spg-7(RNAi), eft-2(RNAi), sca-1(RNAi), T25B9.9(RNAi) or T08A11.2(RNAi). Scale bar is 0.1 mm.
b, Representative photomicrographs of wild-type irg-1pr::gfp worms raised on control, atp-2(RNAi), eft-2(RNAi), sca-1(RNAi), T25B9.9(RNAi) or T08A11.2(RNAi). Scale bar is 0.1 mm.
c, Survival analysis of wild-type worms raised on control, atp-2(RNAi), eft-2(RNAi), sca-1(RNAi), T25B9.9(RNAi) or T08A11.2(RNAi) and exposed to P. aeruginosa. Statistics for each survival analysis are presented in Extended Data Table 3.
d, Survival analysis of wild-type worms raised on control, atp-2(RNAi), eft-2(RNAi), sca-1(RNAi), T25B9.9(RNAi) or T08A11.2(RNAi) and exposed to E. coli. Statistics for each survival analysis are presented in Extended Data Table 3.
e, Representative photomicrographs of wild-type or kgb-1(km21);hsp-60pr::gfp worms raised on E. coli plates with or without 30 µg/ml ethidium bromide suggesting the KGB-1 Jun kinase pathway negatively regulates the UPRmt during mitochondrial stress29. Scale bar is 0.5 mm.
Extended Data Table 1.
ATFS-1 dependent innate immune genes up-regulated when raised on spg-7(RNAi).
| Sequence Name | Gene symbol | KOG title, protein domain or function | Fold Induction Wild-type spg-7(RNAi)/control |
Fold Induction atfs-1(tm4525) spg-7(RNAi)/control |
|---|---|---|---|---|
| Antimicrobial peptides | ||||
| g6714550 | abf-2 | antimicrobial peptide | 10.456 | 2.33072 |
| R09B5.9 | cnc-4 | Caenorhabditis bacteriocin | 4.58689 | 1.59881 |
| Lysozyme | ||||
| Y22F5A.5 | lys-2 | N-acetylmuraminidase/lysozyme | 4.81394 | 2.87725 |
| C-type lectins | ||||
| F35C5.9 | clec-66 | Lectin C-type domain/CUB domain | 3.60596 | 2.09418 |
| F35C5.5 | clec-62 | Lectin C-type domain/CUB domain | 3.81898 | 2.47423 |
| F35C5.8 | clec-65 | Lectin C-type domain | 4.366 | 2.25587 |
| E03H4.10 | clec-17 | C-type lectin | 21.9148 | 7.58123 |
| C03H5.1 | clec-10 | C-type lectin | 3.47056 | 1.82945 |
| F31D4.4 | clec-264 | C-type lectin | 1.87899 | 1.24332 |
| T09F5.9 | clec-47 | C-type lectin | 5.57165 | −1.12101 |
| Y38E10A.5 | clec-4 | C-type lectin | 8.25168 | 3.66069 |
| M02F4.7 | clec-265 | C-type lectin | 8.40775 | 4.75704 |
| F08H9.7 | clec-56 | C-type lectin | 2.30962 | 1.32766 |
| Galectin | ||||
| F38A5.3 | lec-11 | Galectin, galactose-binding lectin | 2.29608 | 1.41767 |
| Signalling | ||||
| F08B1.1 | vhp-1 | Dual specificity phosphatase | 2.39868 | 1.59839 |
Extended Data Table 2.
ATFS-1 dependent UPRmt genes in common with genes induced following P. aeruginosa exposure.
| Sequence name | Gene symbol | KOG title, protein domain or function | Fold Induction Wild-type spg-7(RNAi)/control (Nargund et al., 2012 |
Fold Induction Wild-type PA14/OP50 (Troemel et al. 2006 or this study*) |
|---|---|---|---|---|
| R08F11.3 | cyp-33C8 | Cytochrome P450 CYP2 subfamily | 52.7502 | 4.1 |
| T10B9.2 | cyp-13A5 | CYtochrome P450 family | 35.6897 | 2.8 |
| E03H4.10 | clec-17 | C-type lectin | 21.9148 | 7.9 |
| C54D10.1 | cdr-2 | glutathione S-transferase-like protein | 15.2001 | 2.6 |
| K01D12.11 | cdr-4 | cadmium responsive | 11.9017 | 4 |
| g6714550 | abf-2 | antimicrobial peptide | 10.456 | 1.89* |
| F15B9.6 | 9.37816 | 2.7 | ||
| K10D11.2 | 8.84434 | 3.1 | ||
| M02F4.7 | clec-265 | C-type Lectin | 8.40775 | 3.9 |
| Y38E10A.5 | clec-4 | C-type Lectin | 8.25168 | 11.1 |
| C49G7.5 | 7.7102 | 21 | ||
| C18A11.1 | 7.43593 | 3.1 | ||
| F22H10.2 | 7.33184 | 4.4 | ||
| C49G7.10 | 7.14237 | 9.7 | ||
| C10C5.2 | 6.85214 | 5.9 | ||
| Y58A7A.5 | 5.84559 | 12 | ||
| R11G11.12 | nhr-210 | Nuclear Hormone Receptor family | 5.76655 | 2.3 |
| T12G3.1 | contains ZZ-type Zn-finger | 5.74038 | 3 | |
| ZK970.7 | 5.46349 | 3.9 | ||
| R09B5.9 | cnc-4 | Caenorhabditis bacteriocin | 4.58689 | 4.2 |
| C49G7.7 | 4.41335 | 5.6 | ||
| F35C5.8 | clec-65 | Lectin C-type domain | 4.366 | 2.9 |
| Y58A7A.3 | 4.34718 | 5.7 | ||
| C34H4.2 | 4.34064 | 2.3 | ||
| T16G1.5 | Predicted small molecule kinase | 4.25188 | 8.9 | |
| F01G10.3 | ech-9 | Hydroxyacyl-CoA dehydrogenase/enoylCoA hydratase | 4.17949 | 5 |
| T12G3.1 | Uncharacterized conserved protein | 4.09838 | 2.4 | |
| C50F4.1 | 4.07802 | 2.1 | ||
| B0218.2 | faah-2 | amidase | 3.8877 | 2.2 |
| F19B2.5 | Helicase-like transcription factor | 3.81204 | 2.3 | |
| C50F4.1 | 3.78737 | 2.1 | ||
| F35C5.9 | clec-66 | Lectin C-type domain/CUB domain | 3.60596 | 6.2 |
| M01G12.9 | 3.57904 | 3.2 | ||
| K10G4.3 | 3.56853 | 2.2 | ||
| C03H5.1 | clec-10 | C-type lectin | 3.47056 | 2.3 |
| C34C6.7 | 3.17263 | 2.6 | ||
| Y22D7AR.9 | fbxa-74 | F-box A protein | 3.10471 | 8.7 |
| Y119D3B.20 | fbxa-92 | F-box A protein | 3.06775 | 4.1 |
| F55C12.7 | tag-234 | 3.02488 | 3.5 | |
| Y17G7B.8 | 3.02481 | 2.2 | ||
| C29F9.3 | 3.02333 | 2.6 | ||
| C34D1.5 | zip-5 | bZip transcription factor | 2.98077 | 2 |
| Y58A7A.4 | 2.95958 | 2.2 | ||
| T01D3.6 | von Willebrand factor | 2.91981 | 2.6 | |
| ZK418.7 | 2.55033 | 2.4 | ||
| F49F1.6 | Secreted surface protein | 2.48376 | 17.6 | |
| K08D8.6 | 2.41167 | 3.6 | ||
| C09F12.1 | cic-1 | claudin homolog | 2.36493 | 2.3 |
| T27F2.4 | bZip transcription factor | 2.35058 | 2.8 | |
| F38A5.3 | lec-11 | Galectin, galactose-binding lectin | 2.29608 | 2.4 |
| Y47H10A.5 | 2.24131 | 3.9 | ||
| Y43C5A.3 | 2.06783 | 2.5 | ||
| F23H12.3 | 1.77139 | 2 | ||
| E02C12.8 | Predicted small molecule kinase | 1.7588 | 3.7 | |
| Y95B8A.6 | 1.67149 | 2.5 | ||
| F11D11.3 | 1.55814 | 3.4 | ||
| C50F4.9 | 1.54636 | 3.4 | ||
| Y22F5A.5 | lys-2 | lysozyme | 4.81394 | 10.6* |
this study
Extended Data Table 3.
Statistics for survival analysis.
| Strain comparison | p values | Number of worms | Figure |
|---|---|---|---|
| eri(mg366) control vs eri-1(mg366) atfs-1(RNAi) | 0.0003 | eri(mg366) control: 34/50, eri-1(mg366) atfs-1(RNAi): 39/50 | 3a |
| eri(mg366) control vs eri-1(mg366) atfs-1(RNAi) | 0.6986 | eri(mg366) control: 50/50, eri-1(mg366) atfs-1(RNAi): 47/50 | 3b |
| wild-type control vs wild-type spg-7(RNAi) | <0.0001 | wild-type control: 37/50, wild-type spg-7(RNAi): 45/50 | 3e |
| wild-type spg-7(RNAi) vs atfs-1(tm4919) spg-7(RNAi) | <0.0001 | wild-type spg-7(RNAi): 37/50, atfs-1(tm4919) spg-7(RNAi): 50/50 | 3e |
| wild-type control vs atfs-1(tm4919) spg-7(RNAi) | 0.1322 | wild-type control: 37/50, atfs-1(tm4919) spg-7(RNAi): 50/50 | 3e |
| wild-type control vs atfs-1(et18) control | <0.0001 | wild-type control: 41/50, atfs-1(et18) control: 30/50 | 3h |
| wild-type control vs wild-type atfs-1(RNAi) | 0.039 | wild-type control: 41/50, wild-type atfs-1(RNAi): 45/50 | 3h |
| atfs-1(et18) control vs atfs-1(et18) atfs-1(RNAi) | <0.0001 | atfs-1(et18) control: 30/50, atfs-1(et18): atfs-1(RNAi): 37/50 | 3h |
| wild-type control vs pmk-1(km25) control | <0.0001 | wild-type control: 33/50, pmk-1(km25) control: 42/50 | 4a |
| wild-type control vs wild-type spg-7(RNAi) | <0.0001 | wild-type control: 33/50, wild-type spg-7(RNAi): 45/50 | 4a |
| pmk-1(km25) control vs pmk-1(km25) spg-7(RNAi) | <0.0001 | pmk-1(km25) control: 42/50, pmk-1(km25) spg-7(RNAi): 23/50 | 4a |
| wild-type control vs sek-1(km4) control | <0.0001 | wild-type control: 35/50, sek-1(km4) control: 35/50 | 4b |
| wild-type control vs wild-type spg-7(RNAi) | <0.0001 | wild-type control: 35/50, wild-type spg-7(RNAi): 37/50 | 4b |
| sek-1(km4) control vs sek-1(km4) spg-7(RNAi) | <0.0001 | sek-1(km4) control: 35/50, sek-1(km4) spg-7(RNAi): 39/50 | 4b |
| wild-type control vs kgb-1(km21) control | <0.0001 | wild-type control: 29/50, kgb-1(km21) control: 38/50 | 4c |
| wild-type control vs wild-type spg-7(RNAi) | <0.0001 | wild-type control: 29/50, wild-type spg-7(RNAi): 27/50 | 4c |
| kgb-1(km21) control vs kgb-1(km21) spg-7(RNAi) | <0.0001 | kgb-1(km21) control: 38/50, kgb-1(km21) spg-7(RNAi): 29/50 | 4c |
| wild-type control vs mlk-1(ok2471) control | 0.0001 | wild-type control: 38/50, mlk-1(ok2471) control: 28/50 | 4d |
| wild-type control vs wild-type spg-7(RNAi) | <0.0001 | wild-type control: 38/50, vs wild-type spg-7(RNAi): 33/50 | 4d |
| mlk-1(ok2471) control vs mlk-1(ok2471) spg-7(RNAi) | <0.0001 | mlk-1(ok2471) control: 28/50 vs mlk-1(ok2471) spg-7(RNAi): 49/50 | 4d |
| wild-type control vs wild-type spg-7(RNAi) | <0.0001 | wild-type control: 50/50, wild-type spg-7(RNAi): 28/50 | 4e |
| wild-type spg-7(RNAi) vs atfs-1(tm4919) spg-7(RNAi) | <0.0001 | wild-type spg-7(RNAi): 28/50 atfs-1(tm4919) spg-7(RNAi): 28/50 | 4e |
| wild-type spg-7(RNAi) vs zip-2(4248) spg-7(RNAi) | 0.0004 | wild-type spg-7(RNAi): 28/50, zip-2(4248) spg-7(RNAi): 39/50 | 4e |
| glp-4(bn2) control vs glp-4(bn2) spg-7(RNAi) | <0.0001 | glp-4(bn2) control: 32/50, glp-4(bn2) spg-7(RNAi): 19/50 | ED 5f |
| glb-4(bn2) spg-7(RNAi) vs atfs-1(tm4919) spg-7(RNAi) | <0.0001 | glb-4(bn2) spg-7(RNAi): 19/50, atfs-1(tm4919) spg-7(RNAi): 32/50 | ED 5f |
| wild-type control vs atfs-1(et18) control | 0.0001 | wild-type control: 40/50, atfs-1(et18) control: 35/50 | ED 6f |
| wild-type control vs wild-type lys-2(RNAi) | 0.0419 | wild-type control: 40/50, lys-2(RNAi): 38/50 | ED 6f |
| atfs-1(et18) control vs atfs-1(et18) lys-2(RNAi) | 0.0004 | atfs-1(et18) control: 35/50, atfs-1(et18) lys-2(RNAi): 44/50 | ED 6f |
| wild-type control vs atfs-1(et18) lys-2(RNAi) | 0.7317 | wild-type control: 40/50, atfs-1(et18) lys-2(RNAi): 44/50 | ED 6f |
| wild-type control vs wild-type atp-2 | <0.0001 | wild-type control: 36/50, wild-type atp-2: 31/50 | ED 7c |
| wild-type control vs wild-type eft-2 | <0.0001 | wild-type control: 36/50, wild-type eft-2: 50/50 | ED 7c |
| wild-type control vs wild-type sca-1 | <0.0001 | wild-type control: 36/50, wild-type sca-1: 34/50 | ED 7c |
| wild-type control vs wild-type T25B9.9 | <0.0001 | wild-type control vs wild-type T25B9.9: 50/50 | ED 7c |
| wild-type control vs wild-type T08A11.2 | 0.1536 | wild-type control vs wild-type T08A11.2: 37/50 | ED 7c |
| wild-type control vs wild-type atp-2 | <0.0001 | wild-type control: 37/50, wild-type atp-2: 31/50 | ED 7d |
| wild-type control vs wild-type spg-7(RNAi) | <0.0001 | wild-type control: 37/50, wild-type spg-7(RNAi): 38/50 | ED 7d |
| wild-type control vs wild-type eft-2 | 0.6435 | wild-type control: 37/50, wild-type eft-2: 28/50 | ED 7d |
| wild-type control vs wild-type sca-1 | <0.0001 | wild-type control: 37/50, wild-type sca-1: 48/50 | ED 7d |
| wild-type control vs wild-type T25B9.9 | 0.2626 | wild-type control: 37/50, wild-type T25B9.9: 38/50 | ED 7d |
| wild-type control vs wild-type T08A11.2 | <0.0001 | wild-type control: 37/50, wild-type T08A11.2: 43/50 | ED 7d |
ED= Extended Data
Supplementary Material
ACKNOWLEDGMENTS
We thank Emily Troemel, Marc Pilon, Shohei Mitani of the National Bioresource Project, and the Caenorhabditis Genetics Center for providing C. elegans strains. We thank Dennis Kim and Joao Xavier for providing P. aeruginosa strains, and Thomas Langer and Simon Troeder for mammalian reagents. This work was supported by the Ellison Medical Foundation, the Lucille Castori Center for Microbes, Inflammation and Cancer at MSKCC and the National Institutes of Health (R01AG040061) to CMH, (F32AI100501) to NVK and (R01AI085581) to F. Ausubel.
Footnotes
AUTHOR CONTRIBUTIONS
MWP, AMN, NVK, RG and CJF performed experiments. MWP and CMH conceived of and planned the experiments and wrote the paper.
REFERENCES
- 1.Melo JA, Ruvkun G. Inactivation of conserved C. elegans genes engages pathogen- and xenobiotic-associated defenses. Cell. 2012;149:452–466. doi: 10.1016/j.cell.2012.02.050. [DOI] [PMC free article] [PubMed] [Google Scholar]
- 2.McEwan DL, Kirienko NV, Ausubel FM. Host translational inhibition by Pseudomonas aeruginosa Exotoxin A Triggers an immune response in Caenorhabditis elegans. Cell Host Microbe. 2012;11:364–374. doi: 10.1016/j.chom.2012.02.007. [DOI] [PMC free article] [PubMed] [Google Scholar]
- 3.Dunbar TL, Yan Z, Balla KM, Smelkinson MG, Troemel ER. C. elegans detects pathogen-induced translational inhibition to activate immune signaling. Cell Host Microbe. 2012;11:375–386. doi: 10.1016/j.chom.2012.02.008. [DOI] [PMC free article] [PubMed] [Google Scholar]
- 4.Wright G, Terada K, Yano M, Sergeev I, Mori M. Oxidative stress inhibits the mitochondrial import of preproteins and leads to their degradation. Exp Cell Res. 2001;263:107–117. doi: 10.1006/excr.2000.5096. [DOI] [PubMed] [Google Scholar]
- 5.Nargund AM, Pellegrino MW, Fiorese CJ, Baker BM, Haynes CM. Mitochondrial import efficiency of ATFS-1 regulates mitochondrial UPR activation. Science. 2012;337:587–590. doi: 10.1126/science.1223560. [DOI] [PMC free article] [PubMed] [Google Scholar]
- 6.Kim DH, et al. A conserved p38 MAP kinase pathway in Caenorhabditis elegans innate immunity. Science. 2002;297:623–626. doi: 10.1126/science.1073759. [DOI] [PubMed] [Google Scholar]
- 7.Twumasi-Boateng K, et al. An age-dependent reversal in the protective capacities of JNK signaling shortens Caenorhabditis elegans lifespan. Aging Cell. 2012;11:659–667. doi: 10.1111/j.1474-9726.2012.00829.x. [DOI] [PMC free article] [PubMed] [Google Scholar]
- 8.Guarner F, Malagelada JR. Gut flora in health and disease. Lancet. 2003;361:512–519. doi: 10.1016/S0140-6736(03)12489-0. [DOI] [PubMed] [Google Scholar]
- 9.Newton K, Dixit VM. Signaling in innate immunity and inflammation. Cold Spring Harb Perspect Biol. 2012;4 doi: 10.1101/cshperspect.a006049. [DOI] [PMC free article] [PubMed] [Google Scholar]
- 10.Troemel ER, et al. p38 MAPK regulates expression of immune response genes and contributes to longevity in C. elegans. PLoS Genet. 2006;2:e183. doi: 10.1371/journal.pgen.0020183. [DOI] [PMC free article] [PubMed] [Google Scholar]
- 11.Kato Y, et al. abf-1 and abf-2, ASABF-type antimicrobial peptide genes in Caenorhabditis elegans. Biochem J. 2002;361:221–230. doi: 10.1042/0264-6021:3610221. [DOI] [PMC free article] [PubMed] [Google Scholar]
- 12.Nandakumar M, Tan MW. Gamma-linolenic and stearidonic acids are required for basal immunity in Caenorhabditis elegans through their effects on p38 MAP kinase activity. PLoS Genet. 2008;4:e1000273. doi: 10.1371/journal.pgen.1000273. [DOI] [PMC free article] [PubMed] [Google Scholar]
- 13.Nicholas HR, Hodgkin J. Responses to infection and possible recognition strategies in the innate immune system of Caenorhabditis elegans. Mol Immunol. 2004;41:479–493. doi: 10.1016/j.molimm.2004.03.037. [DOI] [PubMed] [Google Scholar]
- 14.De Smet K, Contreras R. Human antimicrobial peptides: defensins, cathelicidins and histatins. Biotechnol Lett. 2005;27:1337–1347. doi: 10.1007/s10529-005-0936-5. [DOI] [PubMed] [Google Scholar]
- 15.O'Malley YQ, et al. Subcellular localization of Pseudomonas pyocyanin cytotoxicity in human lung epithelial cells. Am J Physiol Lung Cell Mol Physiol. 2003;284:L420–L430. doi: 10.1152/ajplung.00316.2002. [DOI] [PubMed] [Google Scholar]
- 16.Gallagher LA, Manoil C. Pseudomonas aeruginosa PAO1 kills Caenorhabditis elegans by cyanide poisoning. J Bacteriol. 2001;183:6207–6214. doi: 10.1128/JB.183.21.6207-6214.2001. [DOI] [PMC free article] [PubMed] [Google Scholar]
- 17.Estes KA, Dunbar TL, Powell JR, Ausubel FM, Troemel ER. bZIP transcription factor zip-2 mediates an early response to Pseudomonas aeruginosa infection in Caenorhabditis elegans. Proc Natl Acad Sci U S A. 2010;107:2153–2158. doi: 10.1073/pnas.0914643107. [DOI] [PMC free article] [PubMed] [Google Scholar]
- 18.Pukkila-Worley R, et al. Stimulation of host immune defenses by a small molecule protects C. elegans from bacterial infection. PLoS Genet. 2012;8:e1002733. doi: 10.1371/journal.pgen.1002733. [DOI] [PMC free article] [PubMed] [Google Scholar]
- 19.Tan MW, Mahajan-Miklos S, Ausubel FM. Killing of Caenorhabditis elegans by Pseudomonas aeruginosa used to model mammalian bacterial pathogenesis. Proc Natl Acad Sci U S A. 1999;96:715–720. doi: 10.1073/pnas.96.2.715. [DOI] [PMC free article] [PubMed] [Google Scholar]
- 20.Gomes LC, Di Benedetto G, Scorrano L. During autophagy mitochondria elongate, are spared from degradation and sustain cell viability. Nat Cell Biol. 2011;13:589–598. doi: 10.1038/ncb2220. [DOI] [PMC free article] [PubMed] [Google Scholar]
- 21.Feng J, Bussiere F, Hekimi S. Mitochondrial electron transport is a key determinant of life span in Caenorhabditis elegans. Dev Cell. 2001;1:633–644. doi: 10.1016/s1534-5807(01)00071-5. [DOI] [PubMed] [Google Scholar]
- 22.Kirienko NV, et al. Pseudomonas aeruginosa disrupts Caenorhabditis elegans iron homeostasis, causing a hypoxic response and death. Cell Host Microbe. 2013;13:406–416. doi: 10.1016/j.chom.2013.03.003. [DOI] [PMC free article] [PubMed] [Google Scholar]
- 23.Tan MW, Rahme LG, Sternberg JA, Tompkins RG, Ausubel FM. Pseudomonas aeruginosa killing of Caenorhabditis elegans used to identify P. aeruginosa virulence factors. Proc Natl Acad Sci U S A. 1999;96:2408–2413. doi: 10.1073/pnas.96.5.2408. [DOI] [PMC free article] [PubMed] [Google Scholar]
- 24.Richardson CE, Kooistra T, Kim DH. An essential role for XBP-1 in host protection against immune activation in C. elegans. Nature. 2010;463:1092–1095. doi: 10.1038/nature08762. [DOI] [PMC free article] [PubMed] [Google Scholar]
- 25.Baker BM, Nargund AM, Sun T, Haynes CM. Protective coupling of mitochondrial function and protein synthesis via the eIF2alpha kinase GCN-2. PLoS Genet. 2012;8:e1002760. doi: 10.1371/journal.pgen.1002760. [DOI] [PMC free article] [PubMed] [Google Scholar]
- 26.Walter L, Baruah A, Chang HW, Pace HM, Lee SS. The homeobox protein CEH-23 mediates prolonged longevity in response to impaired mitochondrial electron transport chain in C. elegans. PLoS Biol. 2011;9:e1001084. doi: 10.1371/journal.pbio.1001084. [DOI] [PMC free article] [PubMed] [Google Scholar]
- 27.Rauthan M, Ranji P, Aguilera Pradenas N, Pitot C, Pilon M. The mitochondrial unfolded protein response activator ATFS-1 protects cells from inhibition of the mevalonate pathway. Proc Natl Acad Sci U S A. 2013;110:5981–5986. doi: 10.1073/pnas.1218778110. [DOI] [PMC free article] [PubMed] [Google Scholar]
- 28.Kim DH, et al. Integration of Caenorhabditis elegans MAPK pathways mediating immunity and stress resistance by MEK-1 MAPK kinase and VHP-1 MAPK phosphatase. Proc Natl Acad Sci U S A. 2004;101:10990–10994. doi: 10.1073/pnas.0403546101. [DOI] [PMC free article] [PubMed] [Google Scholar]
- 29.Runkel ED, Liu S, Baumeister R, Schulze E. Surveillance-activated defenses block the ROS-induced mitochondrial unfolded protein response. PLoS Genet. 2013;9:e1003346. doi: 10.1371/journal.pgen.1003346. [DOI] [PMC free article] [PubMed] [Google Scholar]
- 30.Liu Y, Samuel BS, Breen PC, Ruvkun G. Caenorhabditis elegans pathways that surveil and defend mitochondria. Nature. 2014;508:406–410. doi: 10.1038/nature13204. [DOI] [PMC free article] [PubMed] [Google Scholar]
METHODS REFERENCES
- 31.Yoneda T, et al. Compartment-specific perturbation of protein handling activates genes encoding mitochondrial chaperones. J Cell Sci. 2004;117:4055–4066. doi: 10.1242/jcs.01275. [DOI] [PubMed] [Google Scholar]
- 32.Rual JF, et al. Toward improving Caenorhabditis elegans phenome mapping with an ORFeome-based RNAi library. Genome Res. 2004;14:2162–2168. doi: 10.1101/gr.2505604. [DOI] [PMC free article] [PubMed] [Google Scholar]
- 33.Ehses S, et al. Regulation of OPA1 processing and mitochondrial fusion by m-AAA protease isoenzymes and OMA1. J Cell Biol. 2009;187:1023–1036. doi: 10.1083/jcb.200906084. [DOI] [PMC free article] [PubMed] [Google Scholar]
- 34.Zhao Q, et al. A mitochondrial specific stress response in mammalian cells. Embo J. 2002;21:4411–4419. doi: 10.1093/emboj/cdf445. [DOI] [PMC free article] [PubMed] [Google Scholar]
- 35.Tan MW, Mahajan-Miklos S, Ausubel FM. Killing of Caenorhabditis elegans by Pseudomonas aeruginosa used to model mammalian bacterial pathogenesis. Proc Natl Acad Sci U S A. 1999;96:715–720. doi: 10.1073/pnas.96.2.715. [DOI] [PMC free article] [PubMed] [Google Scholar]
- 36.Liu Y, Samuel BS, Breen PC, Ruvkun G. Caenorhabditis elegans pathways that surveil and defend mitochondria. Nature. 2014;508:406–410. doi: 10.1038/nature13204. [DOI] [PMC free article] [PubMed] [Google Scholar]
- 37.Nargund AM, Pellegrino MW, Fiorese CJ, Baker BM, Haynes CM. Mitochondrial import efficiency of ATFS-1 regulates mitochondrial UPR activation. Science. 2012;337:587–590. doi: 10.1126/science.1223560. [DOI] [PMC free article] [PubMed] [Google Scholar]
- 38.Kennedy S, Wang D, Ruvkun G. A conserved siRNA-degrading RNase negatively regulates RNA interference in C. elegans. Nature. 2004;427:645–649. doi: 10.1038/nature02302. [DOI] [PubMed] [Google Scholar]
- 39.Benedetti C, Haynes CM, Yang Y, Harding HP, Ron D. Ubiquitin-like protein 5 positively regulates chaperone gene expression in the mitochondrial unfolded protein response. Genetics. 2006;174:229–239. doi: 10.1534/genetics.106.061580. [DOI] [PMC free article] [PubMed] [Google Scholar]
- 40.Kirienko NV, et al. Pseudomonas aeruginosa disrupts Caenorhabditis elegans iron homeostasis, causing a hypoxic response and death. Cell Host Microbe. 2013;13:406–416. doi: 10.1016/j.chom.2013.03.003. [DOI] [PMC free article] [PubMed] [Google Scholar]
Associated Data
This section collects any data citations, data availability statements, or supplementary materials included in this article.


