

Abstract
Isolated populations have advantages for genetic studies of longevity from decreased haplotype diversity and long-range linkage disequilibrium. This permits smaller sample sizes without loss of power, among other utilities. Little is known about the genome of the Okinawans, a potential population isolate, recognized for longevity. Therefore, we assessed genetic diversity, structure, and admixture in Okinawans, and compared this with Caucasians, Chinese, Japanese, and Africans from HapMap II, genotyped on the same Affymetrix GeneChip Human Mapping 500K array. Principal component analysis, haplotype coverage, and linkage disequilibrium decay revealed a distinct Okinawan genome—more homogeneity, less haplotype diversity, and longer range linkage disequilibrium. Population structure and admixture analyses utilizing 52 global reference populations from the Human Genome Diversity Cell Line Panel demonstrated that Okinawans clustered almost exclusively with East Asians. Sibling relative risk (λs) analysis revealed that siblings of Okinawan centenarians have 3.11 times (females) and 3.77 times (males) more likelihood of centenarianism. These findings suggest that Okinawans are genetically distinct and share several characteristics of a population isolate, which are prone to develop extreme phenotypes (eg, longevity) from genetic drift, natural selection, and population bottlenecks. These data support further exploration of genetic influence on longevity in the Okinawans.
Key Words: Okinawa, Longevity, Ancestry, Genome diversity, HapMap.
The genetic contribution to human longevity is poorly understood (1). After nearly three decades of candidate gene studies and a plethora of recent genome-wide association studies (GWAS) among other approaches, the only robust and widely replicated human genetic loci remain APOE and FOXO3 (2–11).
Many studies of common variants have been limited by small sample sizes, particularly in GWAS. The problem is exacerbated in the case of rare variants (some of which may have large effect sizes), where even larger sample sizes are required. This suggests one reason why a significant fraction of the heritability of longevity and other complex phenotypes remains unexplained (12). Increased use of population isolates may help overcome these challenges.
Rare variants are more likely to be present with higher frequency in isolated populations in comparison to the general population (13) and the use of isolated populations can facilitate their identification. Isolated populations can also be beneficial in genetic association studies and sequencing studies, owing to increased linkage disequilibrium (LD) and decreased allelic diversity (14–17). This can allow a smaller sample size to be used to achieve the same statistical power as a large sample. This has several major advantages. For example, smaller sample sizes can reduce the cost of such studies. In addition, with rare phenotypes, such as longevity, recruitment of large numbers of study participants may not be feasible. With this in mind, it would be valuable to know more about some of these population isolates and their utility for further large-scale studies of human longevity. Here, we explore the utility of the Okinawans for such studies.
Okinawa is the southernmost of 47 prefectures of Japan with a population of approximately 1.3 million persons. It consists of a chain of islands spread in an arc (Ryukyu archipelago) with the northern end of the chain near Amami Islands of Kyushu and the southern end near Taiwan. Okinawa Island, the largest and most populous of the Ryukyu Islands that make up Okinawa prefecture is geographically isolated, situated more than 500 km (300 miles) from mainland Japan, Taiwan, and mainland China. Okinawa prefecture was an independent kingdom (Kingdom of the Ryukyus) until 1879, when it was annexed by Japan and later became a Japanese prefecture. Historically, Okinawa has had a unique culture, including language, music, and religion (18). However, little is known for certain about the origin and genetic structure of its people.
Due to its geographic isolation, Okinawa has likely had few population influxes following the original peopling of the islands sometime during the Upper Paleolithic period (between 50,000 and 10,000 years ago). Archeological and other evidence suggests that at least two major waves of migration reached the Japanese archipelago from Asia likely from both Northern and Southern migratory routes through temporary land bridges to the continent (or island chains) although detailed timing, root populations, migration, and expansion routes are still being debated (19–22). The earliest human remains in Japan (from the Yamashita site in Okinawa) date to about 30,000 years ago and are thought to be ancestors of the Jomon people, whose pottery appeared throughout the Japanese archipelago as far north as Siberia by about 13,000 years ago. New migrants, called the Yayoi people, arrived in Japan from the Korean peninsula about 2,000 years ago causing admixture of the two populations (19,23) but appearing not to have had a major genetic influence in outlying regions such as Okinawa or Hokkaido (21,22). A study of the Y chromosome supports this admixture hypothesis (24) as do recent genetic studies of ancestry-informative human leukocyte antigen (HLA) alleles (25) and genome-wide single-nucleotide polymorphism (SNP) data of the three human populations inhabiting the Japanese archipelago, the Ainu, mainland Japanese, and the Ryukyuan (Okinawan) (26). These data suggest Okinawa has for a long period been a population isolate. Such isolates can develop extreme phenotypes as a result of genetic drift (allele dropout), natural selection, and population bottlenecks (27,28).
The Okinawans have a very low age-adjusted mortality rate at older ages and among the lowest prevalence of cardiovascular disease and other age-associated diseases in the world (29–32). Furthermore, Okinawa has long had the highest life expectancy at older ages (eg, remaining life expectancy at age 65 years) among the 47 Japanese prefectures, Japan having led the world in life expectancy for several decades (33,34). Okinawa also has had among the highest prevalence of centenarians among the 47 Japanese prefectures since records began to be kept by the Ministry of Health in the early 1960s despite the high birth rate and expanding population of Okinawa prefecture (35). This longevity phenotype has been in existence since records have been kept in Japan (36), and despite the well-known dietary and other nongenetic advantages of the Okinawans (37), there may be some additional unknown genetic influence favoring this extreme phenotype.
Therefore, we hypothesized that the Okinawans would possess characteristics of a population isolate, including a distinct genetic population structure. We hypothesized this would include a more homogeneous genome, with less haplotype diversity and longer range LD, furthering the attractiveness of this population for genetic studies of human longevity. The goal of our study was twofold. One, to investigate the genetic population structure of the Okinawans (extent of genetic variation, diversity, and admixture in this population); two, to estimate the heritability of longevity among siblings of Okinawan centenarians.
Methods
Study Populations
For comparisons of genome diversity and population structure in the Okinawans, a total of 26 healthy, unrelated, middle-aged Okinawans and 24 Okinawan centenarians or near-centenarians (defined as men 94 years or older and women 98 years or older, as they represent the upper 1% survival group (38)) were recruited by the Okinawa Centenarian Study (OCS) research team. The OCS began in 1976, making it the world’s longest ongoing population-based study of centenarians (39). Koseki (household registration), kept at the city offices were used to confirm the age of centenarians.
Participants provided informed consent and underwent the OCS protocol (includes a physical exam, electrocardiogram (EKG), health questionnaires, among other items described in more detail elsewhere) (39–42). A 25 mL blood sample was collected from the antecubital fossa of each participant by venipuncture. Total cellular DNA was isolated using the PureGene system (Gentra Systems, Inc.) and quantified using PicoGreen staining (Molecular Probes, Eugene, OR). The study was approved by the former local institutional review board at the University of California, San Francisco, CA, Pacific Health Research Institute, and Okinawa International University.
For comparison, we used genotypic data for four HapMap populations that were generated by the same genotyping platform used for genotyping the Okinawans (see below). These data were downloaded from the Affymetrix website (http://www.affymetrix.com/support/technical/sample_data/500k_hapmap_genotype_data.affx). The International HapMap project (43,44) is a multicountry collaboration that aims to catalog genetic similarities and differences between human individuals of different ethnicities with the use of approximately 1.2 × 10⁶ SNPs. In the current study, a total of 210 unrelated participants from the HapMap project were used, including 60 independent Caucasian (CEU) samples from Utah, United States with ancestry from Northern and Western Europe; 60 independent Yoruban (YRI) samples from Ibadan, Nigeria; 45 independent Japanese (JPT) samples from Tokyo, Japan; and 45 independent Han Chinese (CHB) samples from Beijing, China. CHB samples were collected at Beijing Normal University and these participants were self-identified as having at least three out of four CHB grandparents. The JPT samples were collected in the Tokyo metropolitan area and were from people who originated from (or whose ancestors originated from) many different parts of Japan. Hence, the JPT samples are considered representative of the majority of the population in Japan. The HapMap samples were genotyped by the International HapMap project.
To discern population structure and determine admixture estimates, we used the global reference populations from the Human Genome Diversity Cell Line Panel HGDP-CEPH (45). HGDP-CEPH is a resource of 1,063 cultured lymphoblastoid cell lines from 1,050 individuals banked at the Foundation Jean Dausset-CEPH in Paris. Samples were selected from 52 populations in seven broad geographic/continental regions (Africa, Europe, Middle East, Central/South Asia, East Asia, Oceania, and Americas). Genotypes of HGDP participants from the Illumina 650Y SNP array are publicly available (http://hagsc.org/hgdp/files.html). In the current study, we used a subset of the HGDP-CEPH that includes a total of 941 participants from the standardized H952 subset (46).
For calculation of sibling relative risk of centenarianism (achieving an age of 100 years), we used information collected by the OCS, which routinely collects family data from centenarians as part of the OCS protocol (39,41,47). We also used demographic data from the Okinawan Prefectural Government from the Okinawan birth cohort of 1886–1890, as the general population for comparison in the calculation of sibling relative risk. There was no age information recorded for both cohorts except if an individual has lived beyond the age of 100 years or not. Therefore, for this analysis, centenarians were defined as those who lived past the age of 100 years.
The OCS included a total of 988 siblings of centenarians (481 males and 507 females). The Okinawa birth cohort of 1886–1890 included a total of 23,563 males and 23,192 females, of which 52 males and 250 females lived past the age of 100 years.
Genotyping and Quality Control
Genotyping of the Okinawan samples (26 middle-aged Okinawans and 24 centenarians) was carried out using the Affymetrix GeneChip Human Mapping 500K (Affymetrix, Santa Clara, CA), according to the manufacturer’s protocols (http://www.affymetrix.com). This array contains ~500,000 SNPs. The average call rate for the Okinawan samples was ~98%. To obtain high quality data, we excluded samples for which more than 10% of genotypes were missing. We removed SNPs for which >5% of genotypes were missing and SNPs that deviated significantly from Hardy–Weinberg equilibrium (p < .001) in the control samples. This resulted in a dataset of 476,498 SNPs from the 22 autosomes for subsequent analysis.
Statistical Analysis
Population Structure and Diversity
Principal component analysis.—
Principal component analysis (PCA) is a linear dimensionality reduction technique used to identify patterns in data. PCA was performed on all SNPs to assess the difference in population structure between the Okinawan samples and the four HapMap populations (see Study populations) using the prcomp function in R 2.10.1 statistical software (www.r-project.org). The Okinawans and the four HapMap populations were projected on the top three principal components. To obtain a suitable picture on the extent of genetic structure among the Asian populations, we performed PCA on all of the SNPs common among the Okinawan, JPT, and CHB samples.
Distribution of minor allele frequency, LD decay, and haplotype coverage.—
To explore the difference in frequency distribution between the Okinawans and the four HapMap samples for the minor alleles of each genotype that passed the quality control filtering process, we calculated the frequency of SNPs in each of the minor allele frequency bins as shown in (Figure 1).
Figure 1.
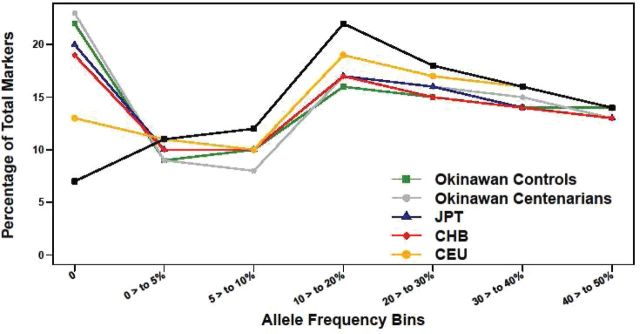
Allele frequency distribution in the Okinawan population and the four HapMap populations. Comparison of the distribution of minor allele frequency in the seven allele frequency bins between the Okinawan population and the four HapMap populations (JPT: Japanese, CHB: Han Chinese, CEU: Caucasian from Utah, YRI: Yoruban from Nigeria). The plot shows that the frequency of nonpolymorphic single-nucleotide polymorphisms (SNPs) in the Okinawans, Chinese, and Japanese (~20%) is higher compared with the Caucasians and Yoruban. For common SNPs, there was no difference in minor allele frequency between the Okinawan and HapMap samples. This shows that Asians have less diverse genomes with higher proportion of nonpolymorphic SNPs compared with the Caucasians and the Yoruban. The color version of this figure is available online.
The Haploview v4.0.1 program (48) was used to evaluate the LD between pairwise SNPs. This program uses Mendelian inheritance and an expectation-maximization (EM) type phasing algorithm to infer the haplotype, and uses the estimated haplotype to calculate LD. Here, LD was measured by r 2 and D′. The decline of LD over distance between SNPs was investigated in the Okinawan and the four HapMap populations by calculating the fraction of common SNPs (minor allele frequency > 0.1) with r 2 ≥ .8 over certain distance bins with a maximum distance of 1,000kb.
We calculated the haplotype coverage of the genome. This was compared between the Okinawans and the four HapMap populations. To do this, the whole genome was divided into segments of approximately 300-kb segments. Haploview was used to estimate the haplotype and the haplotype frequency for each segment. The program produces a list of the haplotype and the haplotype frequencies in a descending order of haplotype frequency. For each fixed n, cumulative frequencies of the first n haplotypes were calculated for each segment. Then, the cumulative haplotype frequencies for the first n haplotypes were averaged over all segments. The cumulative haplotype frequencies, so-called haplotype coverage, were compared between the Okinawans and the four HapMap populations.
Population structure and admixture estimation.—
To discern population structure and admixture proportions of the Okinawans, we first developed an ancestry-informative markers (AIMs) panel using Illumina 650Y SNP genotypes of 941 HGDP participants assigned to be from one of seven broad geographic/continental regions (Africa, Europe, Middle East, Central/South Asia, East Asia, Oceania and Americas). Starting with a previously developed ancestry-informative markers set of 5,000 markers with high informativeness to distinguish the seven continental regions (49), we chose a subset of 680 overlapping SNPs that were also genotyped in the Okinawan participants. Next, global ancestry of the 50 Okinawans was determined. STRUCTURE v2.3.2.1 (50,51) was used to obtain admixture estimates first considering genetic contributions of all 52 populations from the seven continental regions. Five independent runs were performed under the admixture model using 20,000 burn-in cycles and 20,000 MCMC (Markov Chain Monte Carlo) replications. For the allele frequency model, the “infer α” option with the same, uniform alpha for all populations was used under the λ = 1 option. Reference populations were predefined at K = 7 for the 941 reference participants and allele frequencies were updated using only individuals with population information at a migration prior of 0.05. All other parameters were set at default. CLUMPP v1.1.2 (52) was used to combine the results of the different runs. Finally, to determine Chinese versus Japanese admixture estimates of the Okinawans, the HGDP Han Chinese (N = 44) and Japanese (N = 27) participants were combined with the HapMap Han Chinese (N = 84) and JPT (N = 86) participants to build a reference population of 241 participants. STRUCTURE was run including 680 SNPs at K = 2 using the above settings.
Sibling relative risk estimate.—
To estimate the heritability of longevity among siblings, both the OCS dataset and the Okinawan birth cohorts from 1886 to 1890 were used to calculate the sibling relative risk (λs) of centenarianism (becoming a centenarian) for both male and female siblings relative to the general Okinawan population. The relative risk for siblings was calculated as the ratio of the percentage of centenarian siblings among the Okinawan centenarian population and the percentage of centenarian siblings among the general population. All statistical analyses were performed using R 2.10.1 statistical software (www.r-project.org) unless stated otherwise.
Results
Population Structure and Diversity
First, we performed PCA to identify structure in the distribution of the genetic variation across the Okinawan samples and the four HapMap populations. We used the SNP data from the five populations and their projection onto the primary PCA axes. Figure 2A shows the projection of the Okinawan samples along with the four HapMap samples on the top three principal components. The top PC divided the populations into three main clusters (Asian = [Okinawan, JPT, CHB], CEU, YRI). PCA revealed a good separation between the Okinawan samples and the YRI as well as the CEU. In addition, the Okinawans were close to both the JPT and the CHB HapMap samples as indicated by the plot, they are all clustered together. However, performing PCA using only the Okinawan and the Asian HapMap samples suggested that the Okinawan population is a homogeneous group and was distinct from the Japanese and the Chinese (Figure 2B). We also observed that the Okinawan centenarians were somewhat grouped together forming one cluster when compared with the middle-aged Okinawans. This may suggest that the Okinawan centenarians have a similar genetic background that contributes to their longevity.
Figure 2.
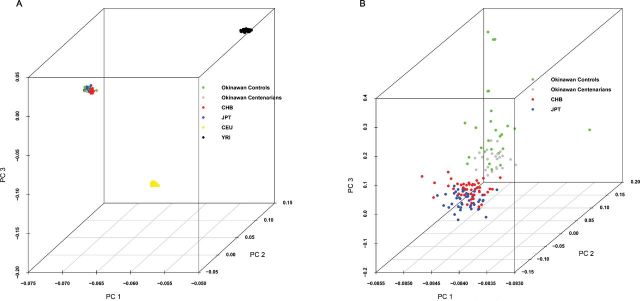
Principal component analysis (PCA) plots for the Okinawan population and the four HapMap populations. (A) PCA showing projection of the four HapMap populations and Okinawan samples on the top three principal components (Okinawans in green, Japanese in blue, Chinese in red, Caucasians in yellow, and Yoruban in black); 53.1%, 5.6%, and 2.8% of the variance were explained by PC1, PC2, and PC3, respectively. The Okinawans clustered closer to Japanese and Chinese and further away from the Caucasian and the Yoruban. (B) PCA results show the projection of the Okinawan, Japanese, and Chinese samples on the top three principal components (middle-aged Okinawans in green, Okinawan centenarians in gray, Japanese in blue, and Chinese in red); 63%, 0.7%, and 0.3% of the variance were explained by PC1, PC2, and PC3, respectively. The plot suggests: (i) the Okinawans are genetically homogenous and cluster distinctly from the Chinese and the Japanese, (ii) Okinawan centenarians tend to cluster together suggesting some shared genetic loci for longevity. The color version of this figure is available online.
Next, we examined the minor allele frequency distribution in the Okinawan samples and the four HapMap populations by calculating the frequency of SNPs in seven allele frequency bins in all five populations (Figure 1). The frequency of the nonpolymorphic SNPs in the Okinawan, JPT, and CHB (approximately 20%) was higher than in the CEU (13%) and YRI (7%). This is consistent with what has been reported in the literature previously (14). Thus, for nonpolymorphic SNPs, the allele frequency distribution is similar between the Okinawan and the Asian HapMap population with less variation compared with the CEU and the YRI. For common SNPs, we did not, however, observe a significant difference in the distribution of the allele frequency in the five different populations (Figure 1).
To investigate the relative extent of LD in the Okinawan population compared with the four HapMap populations, we calculated the fraction of pairwise common SNPs that were highly correlated (defined as r 2 > .8). Figure 3 shows that the LD decay over distance in the Okinawan is longer in comparison with the four HapMap populations. Overall, the Okinawan population had a higher LD between SNPs within 1,000-kb distance, compared with the four HapMap samples when using r 2 as measure for LD, but we did not see this when D′ was used as the LD measure. In the Okinawan samples, 54.2% SNP pairs at <5kb had an r 2 ≥ .8, compared with 40.9%, 40.9%, 37%, and 23.7% in JPT, CHB, CEU, and YRI, respectively.
Figure 3.

Linkage disequilibrium (LD) decay over distance in the Okinawan and the four HapMap populations. This plot shows the LD decay over distance in the Okinawans is longer compared with the four HapMap populations (JPT: Japanese, CHB: Han Chinese, CEU: Caucasian from Utah, YRI: Yoruban from Nigeria). This suggests that the Okinawans are a population isolate with less genetic diversity and long stretches of LD. The color version of this figure is available online.
When considering SNP pairs that were further apart from each other (80–100kb), 3.4% of these pairs were in strong LD in the Okinawan compared with 2.2%, 2.1%, 2%, and 0.5% in JPT, CHB, CEU, and YRI, respectively (Figure 3). There were 1.1–3.1 times percentage of SNP pairs (>100kb apart) in strong LD in Okinawans compared with JPT, and there was 2.9–18.6-fold difference when comparing Okinawans to YRI.
As for the haplotype coverage, the Okinawa samples had higher haplotype coverage compared with the HapMap samples. Within a 300-kb distance of separation, the most common 15 haplotypes on average accounted for 90% of haplotypes that were present in the Okinawans, compared with 70% in JPT and CHB, 62% in CEU, and only 47% in YRI (Table 1). The most common 10 haplotypes on average accounted for 83% of haplotypes that were present in the Okinawans, but only accounted for 38%–61% of the haplotypes that were present in the four HapMap populations (Table 1). This indicated that the diversity of long-range haplotypes was significantly lower in Okinawan samples compared with the four HapMap samples. These results suggest that the Okinawa population has significantly higher LD and lower haplotype diversity compared with the four HapMap populations.
Table 1.
Percentage of Haplotypes Accounted for by the Most Common Haplotypes
| Population | Number of Most Common Haplotypes | |||||||
|---|---|---|---|---|---|---|---|---|
| 5 | 10 | 15 | 20 | 25 | 30 | 35 | 40 | |
| Okinawa | 66.8 | 82.6 | 89.9 | 94.1 | 96.5 | 97.4 | 97.5 | 97.6 |
| JPT | 46.9 | 61.1 | 69.7 | 75.4 | 79.9 | 83.7 | 86.9 | 89.5 |
| CHB | 47.3 | 61.4 | 70.1 | 75.7 | 80.1 | 84 | 87.3 | 89.9 |
| CEU | 40.9 | 54.5 | 62.4 | 67.1 | 68.8 | 69 | 69 | 69 |
| YRI | 26.1 | 38.4 | 46.6 | 51.8 | 54 | 54.2 | 54.3 | 54.3 |
Notes: Comparison of the haplotype coverage between the Okinawans and four HapMap populations (JPT: Japanese, CHB: Han Chinese, CEU: Caucasian from Utah, YRI: Yoruban from Nigeria). These results suggest that the Okinawans have a much lower haplotype diversity compared with the four HapMap populations and, therefore, are more genetically homogeneous.
Population Structure and Admixture Estimation
Using STRUCTURE to discern global ancestry and admixture proportions, we found that the Okinawans clustered consistently with East Asians, with individual ancestry estimates (ie, the estimated membership coefficients for each individual in each of the seven predefined world regions) ranging from 0.928 to 0.997. No other world population present in the reference dataset had a significant contribution to the Okinawan participants (Figure 4A). The maximum ancestry estimate of any Okinawan individual in non-East Asian clusters was 1.6% African, 0.8% European, 1.2% Middle Eastern, 1.6% Central/South Asian, 1.0% Americas, and 6.5% Oceanian.
Figure 4.
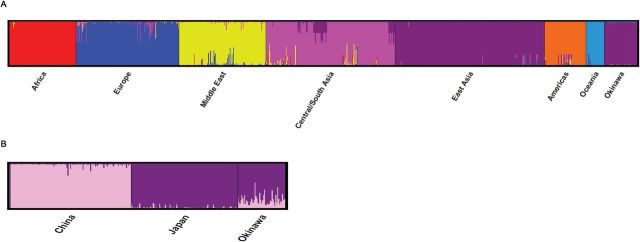
Summary plot of individual admixture proportions. (A) Summary plot of individual admixture proportions. These data demonstrate Okinawan ancestry proportions on a global scale from comparisons with 944 Human Genome Diversity Cell Line Panel (HGDP) participants, grouped into seven main global regions/continents (Africa, Europe, Middle East, Central/South Asia, Americas, and Oceania). From the admixture proportions plot, the Okinawans cluster primarily with East Asians and very little contribution (<1% individual ancestry estimates) from the remaining global regions. (B) Summary plot of individual admixture proportions. These data demonstrate the results of individual admixture proportions estimated from 680 Ancestry Informative Markers (AIMs), which are polymorphisms that exhibit substantially different frequencies between populations from different geographical regions and can be used to estimate the ancestry of an individual. Each individual is represented by a single vertical line broken into two colored segments, with lengths proportional to each of the two inferred clusters. Pink-colored shade indicates the Han Chinese ancestry proportion, and purple-colored shade indicates the Japanese ancestry proportion. The predefined populations Japanese, Han Chinese, and Okinawans are presented on the abscissa and the ordinate indicates the admixture proportion. On average, the Okinawans were found to share 80.8% (±11.2 SD) admixture with Japanese and 19.2% (±11.2 SD) admixture with Chinese suggesting that the Okinawans and the Japanese share substantial common ancestry. The color version of this figure is available online.
Based on these results, we next determined Okinawan admixture estimates within East Asian Chinese and Japanese populations only. For this analysis, our reference populations included the Han North and South Chinese, Japanese participants from HGDP, and the HapMap CHB in Beijing, and Japanese participants. On average, the Okinawans were found to share 80.8% (±11.2 SD) admixture with Japanese and 19.2% (±11.2 SD) admixture with Chinese. Individual admixture estimates were quite variable and ranged from 5.84% to 57.82% Chinese admixture (Figure 4B).
Sibling Relative Risk Estimate
To further quantify the genetic contribution to longevity in the Okinawan population, we calculated the sibling relative risk (λs) of centenarianism for the birth cohort of 1886–1890. There were a total of 52 male and 250 female centenarians among this birth cohort with 4 male and 17 female siblings of centenarians who also achieved centenarianism.
Based on λs values, we found that male siblings of Okinawan centenarians were 3.77 more likely to be centenarians (95% confidence interval [CI]: 1.37–10.38) compared with 3.11 for female siblings (95% CI: 1.92–5.04).
Discussion
Human longevity is a complex phenotype that is determined by the interplay of genes, environment, and chance. Evidence suggests that a significant proportion of this extreme phenotype may be due to genetic factors (4,53). However, only two genes (APOE and FOXO3) have been consistently shown to influence this phenotype in humans and studies of genetic pathways and networks are still in their infancy (54). Part of the challenge in studies of human longevity has been the lack of optimal study populations, including lack of birth cohort-matched controls, population stratification, among other issues (54). The more stringent the age qualification for longevity, the more strongly genes likely influence this phenotype (55), yet the longest lived are also the most difficult to recruit and examine. Population isolates can be used to help overcome these challenges (15,27).
In order to understand more about one putative population isolate well known for their longevity, the Okinawans, we performed a pilot GWAS of a small sample of middle-aged Okinawans recruited from the general Okinawan population as well as a small sample of Okinawan centenarians. We examined genetic structure, admixture, and diversity and found that the Okinawans are a genetically homogenous population that is clearly distinct from the four major HapMap populations. They clustered primarily with East Asians (with admixture estimates of about 80% Japanese and 19% Chinese) and no other world region had a significant contribution.
Long stretches of LD and decreased allelic diversity were observed and supports the hypothesis that Okinawans are an isolate with limited gene flow from outside populations, and are likely descended from an original, older ancestral population called the Jomon who already possessed a high degree of differentiation from Paleolithic times (22). These results are also supported by population genetic theory where genetic drift can play a significant role in the LD decay over distance (17). We observed, moreover, a clustering of the Okinawan centenarians into one group suggesting that there might be similar, strong genetic factors contributing to their longevity. In estimating the sibling relative risk (λs) for centenarianism, we found that male siblings of Okinawan centenarians were 3.77 (95% CI: 1.37–10.38) times more likely to become centenarians and female siblings 3.11 (95% CI: 1.92–5.04) times more likely. In a prior study of λs in long-lived Okinawans, we also found longevity advantages for centenarian siblings, this from an analysis of cumulative survival advantages for siblings of centenarians (56). For the 1890 Okinawan birth cohort, male siblings of centenarians had a 5.43-fold (95% CI: 4.52–6.32) higher likelihood, and female siblings had a 2.58-fold (95% CI: 2.28–2.87) higher likelihood, of nonagenarianism (living at least 90 years), compared with other members of their birth cohort.
Although the current estimates for centenarianism, at least for males, appear to be somewhat lower than our prior estimates for nonagenarianism, they both point to strong familial longevity advantages and we should expect some differences between the two sets of estimates due to methodological differences and the size of the CIs. The prior λs estimates used a demographic method and a large study population, where the calculation was based on the cumulative survival rates for siblings of centenarians versus the general population from the 1890 birth cohort. In contrast, the sibling relative risk for centenarianism reported in the current study is based on the ratio of the percentage of centenarian siblings in the centenarian population versus the general population, from the 1886–1890 birth cohorts. Due to the small number of siblings of centenarians who also achieved centenarianism in the current study (4 male centenarians and 17 female centenarians) the 95% CI for the relative risk of centenarianism is relatively wide. Nevertheless, two different methods of estimating λs come to the same conclusion—that there is a sizable longevity advantage for siblings of centenarians in Okinawa. In a population-based study of Utah families, the estimated λs was 2.3 (95% CI: 2.08–2.56) for near-centenarianism (age 95 years for men and 97 years for women) (57). This may suggest a stronger genetic influence for longevity in the Okinawan population, although more work would have to be done to confirm whether the Okinawan population has a genetic advantage for longevity versus other populations as the wide CI based on our Okinawan samples precludes any definitive conclusions.
Overall, these data suggest that further study of the genetic basis of human longevity utilizing the Okinawan population and other population isolates may be an attractive approach for both common and rare variants. Rare variants, in particular, are more likely to reach a relatively high frequency in population isolates and the possibility of attaining the necessary power to detect causal genetic variants that contribute to complex phenotypes is enhanced.
Past studies using geographically and/or ethnically isolated populations have yielded some interesting findings, with research in this area beginning in earnest in the 1980s. The first such studies came from the OCS research group. A study by Suzuki et al. (58) on the Okinawan population was the first to use centenarian pedigrees to demonstrate that long-lived siblings exist in centenarian families. This finding has since been replicated in several centenarian studies (56,59,60).
The first candidate gene study of the genetics of human longevity also used a population isolate. In 1987, Suzuki and colleagues from the OCS assessed HLA polymorphisms across age deciles from youth to centenarian years. This study demonstrated that long-lived Okinawans (nonagenarians and centenarians) had overrepresentation of some HLA-DR alleles and underrepresentation of others (61), suggesting that some alleles might modify risk for longevity. OCS investigators later extended these findings to other HLA alleles (62). Some of these findings, particularly with regard to homozygosity for HLA-DR alleles in long-lived persons, have since been replicated in other populations, and the immunogenetics of aging remains an active area of interest (63,64).
Population isolates have also demonstrated that variation in several genes is associated with life span and/or health span in several other candidate gene studies but none have yet been widely replicated. This includes studies of Ashkenazi Jews with the cholesteryl ester transfer protein (CETP) gene and the apolipoprotein C-III (APOC3) gene (65); Amish, with the APOC3 (66); Laron Ecuadorians with the growth hormone receptor (GHR) gene (67); and Americans of Japanese and Okinawan ethnicity in Hawaii, with the CETP gene (42,68). In one of few studies that included a large sample of African Americans, Jazwinski et al. (69) found certain combinations of variants in three genes (APOE, HRAS1, and LASS1) are associated with human longevity and healthy aging and replicated the results in a second population.
In 2008, using population isolates in Hawaii (Americans of Okinawan and Japanese ancestry) in a candidate gene study focused on the insulin-signaling pathway, Willcox et al. (2) found that long-lived Americans of Okinawan and Japanese ancestry had overrepresentation of several FOXO3 SNPs that were in LD with each other—suggesting a protective effect for longevity originating from the region of LD. This discovery was inspired by a prior assessment of the most promising, evolutionarily conserved genetic findings from model organisms of aging (70). In the most significant association with longevity (FOXO3 SNP rs2802292), those heterozygous for the protective allele had almost double the odds of centenarianism and those homozygous had near triple such odds. The protective finding was rapidly and widely replicated (4) in multiple human populations and, after APOE, remains the only other widely replicated locus in the genetics of human longevity.
Population isolates also overcome challenges with human population substructure for genetic studies of longevity. The challenges with differing population substructures, typically seen in populations that have had successive waves of recent immigration (eg, U.S. population) have become more obvious since the advent of large-scale GWAS. Genomic technology began rapidly evolving in the 2000s and the first GWAS of centenarian genomes was performed. Puca et al. (71) compared siblings of American centenarians (Caucasian descent) with siblings of individuals that died before the age of 73 and reported that siblings of these Caucasian centenarians had suggestive evidence of linkage with life span on chromosome 4 (Logarithm of the Odds score [LOD] = 3.65, p = .044). Geesaman et al. (72) subsequently identified a potential susceptibility gene (MTP) associated with life span using positional cloning in the same population. This finding has not, however, been widely replicated and some evidence suggests that it may be an artifact of population stratification (from differing genetic substructures of the ancestral Caucasian study populations) (73).
The aforementioned studies highlight some of the strengths and challenges with utilizing various study populations. Issues such as nonrandom sampling and population stratification may lead to null or artifactual findings. These challenges may be among the reasons for the lack of findings and/or replications from genetic studies of human longevity. These issues are compounded in GWAS by inadequate means of controlling for multiple comparisons and incomplete coverage of the genome by commercially available platforms.
Population isolates that possess genetic homogeneity and long-range LD can help reduce the problem of population stratification as well as help address issues of inadequate power and incomplete coverage, especially for large-scale genomic studies such as GWAS. With the advent of high-throughput sequencing technologies, exome or whole genome sequencing is becoming an attractive approach in the identification of novel and rare variants associated with many complex phenotypes (74). Sequencing individuals from population isolates with extreme phenotypes such as longevity may also shed some light on the missing heritability.
Although the current study supports the hypothesis that the Okinawans are genetically homogenous and are of special interest to studies in human longevity, our study has several limitations. One limitation is the small sample size. We studied 24 Okinawan centenarians and 26 middle-aged Okinawans. Although we were able to explore genetic structure, admixture, and diversity in the Okinawans, we did not have adequate power to conduct a more in-depth assessment of common variants that might influence longevity in the Okinawans. In addition, the Affymetrix GeneChip Human Mapping 500K array, by design, interrogates common variants, so we are unable to study rare variants. Further, SNPs on the array are not necessarily distributed uniformly across the genome because of experimental difficulties in designing probes in some parts of the genome. For population structure and admixture estimates, we employed the HapMap and the HGDP-CEPH–cultured lymphoblastoid cell lines that have proven useful in numerous population genetic studies (75). A challenge with cell lines is that they may be subject to rearrangements and significant mutations that can alter cell biology. However, genotype calls are affected to a lesser degree (76).
The strengths of the study include the fact that this is the first in-depth study of the Okinawan genome with implications for longevity research, that both average and long-lived Okinawans were studied, and that results were consistent across several different methods of assessing genetic homogeneity in the Okinawans. In addition, all participants provided blood specimens and samples were collected from one center and genotyped in the same lab, which reduces the possible confounding effect of differences between recruitment sites and genotyping labs.
In conclusion, we have demonstrated that the Okinawans are relatively homogeneous at the genetic level, Okinawan centenarians tend to cluster into an even more homogeneous group suggesting some shared genetic mechanisms for longevity, and that Okinawan centenarian siblings show a high relative risk of longevity. Given their high life expectancy, the high prevalence of centenarians, and the availability of a reliable age registration system (77), the aforementioned factors support the notion that the Okinawans could be a valuable population for future larger scale studies of genetic basis of healthy aging and longevity. Future studies in other large population-based samples of centenarians are needed to generalize our findings.
Funding
This work was supported in part by National Institutes of Health grants: K01 AG022782 (W.-C.H.), R01 AG023692 (W.-C.H.), RO3 AG02-293-01 (B.J.W.), K08 AG22788-02 (B.J.W.), R01MH093500 (C.M.N.), R01 AG030474 (C.M.N.), 5R01AG027060-06 (B.J.W.), 5R01AG038707-02 (B.J.W.), U19 AG023122 (C.M.N., B.J.W., W.-C.H., M.S., D.C.W.), and U01 MH092758 (C.M.N.). We also thank the Japan Ministry of Health, Labor and Welfare and the Japan Society for Promotion of Sciences for their past support of the Okinawa Centenarian Study (M.S., D.C.W.).
Acknowledgments
The authors thank Sayaka Mitsuhashi and the staff of the Okinawa Research Center for Longevity Science for research and editorial support and the assistance of multiple members of the NIA Genetics of Longevity Consortium who kindly donated time and resources to this study (U19 AG023122 – PI: Steve Cummings). Finally, this project would not have been possible without the understanding and support of the centenarians, their families, and the prefectural, city, town, and village public health officials of Okinawa prefecture.
References
- 1. Newman AB, Murabito JM. The epidemiology of longevity and exceptional survival. Epidemiol Rev. 2013;35:181–197 doi:10.1093/epirev/mxs013 [DOI] [PMC free article] [PubMed] [Google Scholar]
- 2. Willcox BJ, Donlon TA, He Q, et al. FOXO3A genotype is strongly associated with human longevity. Proc Natl Acad Sci USA. 2008;105:13987–13992. :10.1073/pnas.0801030105 [DOI] [PMC free article] [PubMed] [Google Scholar]
- 3. Flachsbart F, Caliebe A, Kleindorp R, et al. Association of FOXO3A variation with human longevity confirmed in German centenarians. Proc Natl Acad Sci USA. 2009;106:2700–2705. :10.1073/pnas.0809594106 [DOI] [PMC free article] [PubMed] [Google Scholar]
- 4. Murabito JM, Yuan R, Lunetta KL. The search for longevity and healthy aging genes: insights from epidemiological studies and samples of long-lived individuals. J Gerontol A Biol Sci Med Sci. 2012;67:470–479. :10.1093/gerona/gls089 [DOI] [PMC free article] [PubMed] [Google Scholar]
- 5. Michael Anson R, Willcox B, Austad S, Perls T. Within- and between-species study of extreme longevity–comments, commonalities, and goals. J Gerontol A Biol Sci Med Sci. 2012;67:347–350. :10.1093/gerona/gls010 [DOI] [PMC free article] [PubMed] [Google Scholar]
- 6. Tazearslan C, Cho M, Suh Y. Discovery of functional gene variants associated with human longevity: opportunities and challenges. J Gerontol A Biol Sci Med Sci. 2012;67:376–383. :10.1093/gerona/glr200 [DOI] [PMC free article] [PubMed] [Google Scholar]
- 7. Beekman M, Blanché H, Perola M, et al. ; GEHA consortium. Genome-wide linkage analysis for human longevity: Genetics of Healthy Aging Study. Aging Cell. 2013;12:184–193. :10.1111/acel.12039 [DOI] [PMC free article] [PubMed] [Google Scholar]
- 8. Schächter F, Faure-Delanef L, Guénot F, et al. Genetic associations with human longevity at the APOE and ACE loci. Nat Genet. 1994;6:29–32. :10.1038/ng0194-29 [DOI] [PubMed] [Google Scholar]
- 9. Schupf N, Barral S, Perls T, et al. Apolipoprotein E and familial longevity. Neurobiol Aging. 2013;34:1287–1291. :10.1016/j.neurobiolaging.2012.08.019 [DOI] [PMC free article] [PubMed] [Google Scholar]
- 10. Morris BJ, Donlon TA, He Q, et al. Association analyses of insulin signaling pathway gene polymorphisms with healthy aging and longevity in Americans of Japanese ancestry. J Gerontol A Biol Sci Med Sci. June 14, 2013. :10.1093/gerona/glt082 [DOI] [PMC free article] [PubMed] [Google Scholar]
- 11. Lindahl-Jacobsen R, Tan Q, Mengel-From J, Christensen K, Nebel A, Christiansen L. Effects of the APOE ε2 allele on mortality and cognitive function in the oldest old. J Gerontol A Biol Sci Med Sci. 2013;68:389–394. :10.1093/gerona/gls192 [DOI] [PubMed] [Google Scholar]
- 12. Manolio TA, Collins FS, Cox NJ, et al. Finding the missing heritability of complex diseases. Nature. 2009;461:747–753. :10.1038/nature08494 [DOI] [PMC free article] [PubMed] [Google Scholar]
- 13. Peltonen L, Palotie A, Lange K. Use of population isolates for mapping complex traits. Nat Rev Genet. 2000;1:182–190. :10.1038/35042049 [DOI] [PubMed] [Google Scholar]
- 14. Bonnen PE, Pe’er I, Plenge RM, et al. Evaluating potential for whole-genome studies in Kosrae, an isolated population in Micronesia. Nat Genet. 2006;38:214–217. :10.1038/ng1712 [DOI] [PubMed] [Google Scholar]
- 15. Heutink P, Oostra BA. Gene finding in genetically isolated populations. Hum Mol Genet. 2002;11:2507–2515. :10.1093/hmg/11.20.2507 [DOI] [PubMed] [Google Scholar]
- 16. Service S, DeYoung J, Karayiorgou M, et al. Magnitude and distribution of linkage disequilibrium in population isolates and implications for genome-wide association studies. Nat Genet. 2006;38:556–560. :10.1038/ng1770 [DOI] [PubMed] [Google Scholar]
- 17. Fu YX, Arnold J. On the association of restriction fragment length polymorphisms across species boundaries. Proc Natl Acad Sci USA. 1991;88:3967–3971 PMCID:51574 [DOI] [PMC free article] [PubMed] [Google Scholar]
- 18. Kerr GH. Okinawa: The History of an Island People. Boston, MA: Tuttle Publishing; 2000. [Google Scholar]
- 19. Omoto K, Saitou N. Genetic origins of the Japanese: a partial support for the dual structure hypothesis. Am J Phys Anthropol. 1997;102:437–446. :10.1002/(SICI)1096-8644(199704)102:4<437::AID-AJPA1> 3.0.CO;2-P [DOI] [PubMed] [Google Scholar]
- 20. Shi H, Zhong H, Peng Y, et al. Y chromosome evidence of earliest modern human settlement in East Asia and multiple origins of Tibetan and Japanese populations. BMC Biol. 2008;6:45. [DOI] [PMC free article] [PubMed] [Google Scholar]
- 21. He Y, Wang WR, Xu S, Jin L, Snp Consortium PA. Paleolithic contingent in modern Japanese: estimation and inference using genome-wide data. Sci Rep. 2012;2:355. :10.1038/srep00355 [DOI] [PMC free article] [PubMed] [Google Scholar]
- 22. Tanaka M, Cabrera VM, González AM, et al. Mitochondrial genome variation in eastern Asia and the peopling of Japan. Genome Res. 2004;14(10A):1832–1850. :10.1101/gr.2286304 [DOI] [PMC free article] [PubMed] [Google Scholar]
- 23. Hanihara K. [The population history of the Japanese]. Nihon Ronen Igakkai Zasshi. 1993;30:923–931. [DOI] [PubMed] [Google Scholar]
- 24. Hammer MF, Horai S. Y chromosomal DNA variation and the peopling of Japan. Am J Hum Genet. 1995;56:951–962 PMID:7717406 [PMC free article] [PubMed] [Google Scholar]
- 25. Nakaoka H, Mitsunaga S, Hosomichi K, et al. Detection of ancestry informative HLA alleles confirms the admixed origins of Japanese population. PLoS One. 2013;8:e60793. :10.1371/journal.pone.0060793 [DOI] [PMC free article] [PubMed] [Google Scholar]
- 26. Jinam T, Nishida N, Hirai M, et al. ; Japanese Archipelago Human Population Genetics Consortium. The history of human populations in the Japanese Archipelago inferred from genome-wide SNP data with a special reference to the Ainu and the Ryukyuan populations. J Hum Genet. 2012;57:787–795. :10.1038/jhg.2012.114 [DOI] [PubMed] [Google Scholar]
- 27. Lowe JK, Maller JB, Pe’er I, et al. Genome-wide association studies in an isolated founder population from the Pacific Island of Kosrae. PLoS Genet. 2009;5:e1000365. :10.1371/journal.pgen.1000365 [DOI] [PMC free article] [PubMed] [Google Scholar]
- 28. Traglia M, Sala C, Masciullo C, et al. Heritability and demographic analyses in the large isolated population of Val Borbera suggest advantages in mapping complex traits genes. PLoS One. 2009;4:e7554. :10.1371/journal.pone.0007554 [DOI] [PMC free article] [PubMed] [Google Scholar]
- 29. Suzuki M, Akisaka M, Ashitomi I, Higa K, Nozaki H. [Chronological study concerning ADL among Okinawan centenarians]. Nihon Ronen Igakkai Zasshi. 1995;32:416–423. [DOI] [PubMed] [Google Scholar]
- 30. Mathers CD, Sadana R, Salomon JA, Murray CJ, Lopez AD. Healthy life expectancy in 191 countries, 1999. Lancet. 2001;357:1685–1691. :10.1016/S0140-6736(00)04824-8 [DOI] [PubMed] [Google Scholar]
- 31. Bernstein AM, Willcox BJ, Tamaki H, et al. First autopsy study of an Okinawan centenarian: absence of many age-related diseases. J Gerontol A Biol Sci Med Sci. 2004;59:1195–1199. :10.1093/gerona/59.11.1195 [DOI] [PubMed] [Google Scholar]
- 32. Cockerham WC, Hattori H, Yamori Y. The social gradient in life expectancy: the contrary case of Okinawa in Japan. Soc Sci Med. 2000;51:115–122. :S027795369900444X [DOI] [PubMed] [Google Scholar]
- 33. Japan Ministry of Health, Labor and Welfare Statistics and Information Division. Japan National Health Statistics for 2000. Tokyo, Japan: Japan Ministry of Health, Labor and Welfare; 2002. [Google Scholar]
- 34. World Health Organization. 2000 World Health Statistics Annual. Geneva, Switzerland: World Health Organization; 2000. [Google Scholar]
- 35. Japan Health and Welfare Bureau for the Elderly. Japan Annual Centenarian Report. Tokyo, Japan: Japan Ministry of Health, Labour and Welfare; 2005. [Google Scholar]
- 36. Suzuki M, Willcox DC, Willcox BJ. The historical context of Okinawan longevity: influence of the United States and Mainland Japan. Okinawan J Am Studies 2007:46–61. [Google Scholar]
- 37. Willcox DC, Willcox BJ, Todoriki H, Suzuki M. The Okinawan diet: health implications of a low-calorie, nutrient-dense, antioxidant-rich dietary pattern low in glycemic load. J Am Coll Nutr. 2009;28(suppl):500S–516S doi:28/4_Supplement_1/500S [DOI] [PubMed] [Google Scholar]
- 38. Willcox BJ, Willcox DC, Todoriki H, et al. Caloric restriction, the traditional Okinawan diet, and healthy aging: the diet of the world’s longest-lived people and its potential impact on morbidity and life span. Ann N Y Acad Sci. 2007;1114:434–455. :10.1196/annals.1396.037 [DOI] [PubMed] [Google Scholar]
- 39. Sanabe E, Ashitomi I, Suzuki M. Social and medical survey of centenarians. Okinawa J Pub Health. 1977:98–106. [Google Scholar]
- 40. Willcox DC, Willcox BJ, Wang NC, He Q, Rosenbaum M, Suzuki M. Life at the extreme limit: phenotypic characteristics of supercentenarians in Okinawa. J Gerontol A Biol Sci Med Sci. 2008;63:1201–1208. :63/11/1201 [DOI] [PubMed] [Google Scholar]
- 41. Willcox DC, Willcox BJ, Hsueh WC, Suzuki M. Genetic determinants of exceptional human longevity: insights from the Okinawa Centenarian Study. Age (Dordr). 2006;28:313–332. :10.1007/s11357-006-9020-x9020 [DOI] [PMC free article] [PubMed] [Google Scholar]
- 42. Willcox BJ, Suzuki M, Donlon TA, et al. Optimizing human health span and life span: insights from Okinawa and Hawaii. Annu Rev Gerontol Geriatr. 2013;33:133–170. [Google Scholar]
- 43. A haplotype map of the human genome. Nature. 2005;437:1299–1320. :10.1038/nature04226 [DOI] [PMC free article] [PubMed] [Google Scholar]
- 44. Thorisson GA, Smith AV, Krishnan L, Stein LD. The International HapMap Project Web site. Genome Res. 2005;15:1592–1593. :10.1101/gr.4413105 [DOI] [PMC free article] [PubMed] [Google Scholar]
- 45. Li JZ, Absher DM, Tang H, et al. Worldwide human relationships inferred from genome-wide patterns of variation. Science. 2008;319:1100–1104. :10.1126/science.1153717 [DOI] [PubMed] [Google Scholar]
- 46. Rosenberg NA. Standardized subsets of the HGDP-CEPH Human Genome Diversity Cell Line Panel, accounting for atypical and duplicated samples and pairs of close relatives. Ann Hum Genet. 2006;70(Pt 6):841–847. :10.1111/j.1469-1809.2006.00285.x [DOI] [PubMed] [Google Scholar]
- 47. Suzuki M, Willcox BJ, Willcox CD. Implications from and for food cultures for cardiovascular disease: longevity. Asia Pac J Clin Nutr. 2001;10:165–171. :10.1111/j.1440-6047.2001.00219.x [DOI] [PubMed] [Google Scholar]
- 48. De La Vega FM, Isaac HI, Scafe CR. A tool for selecting SNPs for association studies based on observed linkage disequilibrium patterns. Pac Symp Biocomput. 2006:487–498 PMID: 17094263 [PubMed] [Google Scholar]
- 49. Nievergelt CM, Maihofer AX, Shekhtman T, et al. Inference of human continental origin and admixture proportions using a highly discriminative ancestry informative 41-SNP panel. Investig Genet. 2013;4:13. :10.1186/2041-2223-4-13 [DOI] [PMC free article] [PubMed] [Google Scholar]
- 50. Pritchard JK, Stephens M, Donnelly P. Inference of population structure using multilocus genotype data. Genetics. 2000;155:945–959 PMID:10835412 [DOI] [PMC free article] [PubMed] [Google Scholar]
- 51. Falush D, Stephens M, Pritchard JK. Inference of population structure using multilocus genotype data: linked loci and correlated allele frequencies. Genetics. 2003;164:1567–1587 PMID:12930761 [DOI] [PMC free article] [PubMed] [Google Scholar]
- 52. Jakobsson M, Rosenberg NA. CLUMPP: a cluster matching and permutation program for dealing with label switching and multimodality in analysis of population structure. Bioinformatics. 2007;23:1801–1806. :10.1093/bioinformatics/btm233 [DOI] [PubMed] [Google Scholar]
- 53. Sebastiani P, Perls TT. The genetics of extreme longevity: lessons from the New England centenarian study. Front Genet. 2012;3:277. :10.3389/fgene.2012.00277 [DOI] [PMC free article] [PubMed] [Google Scholar]
- 54. Deelen J, Beekman M, Capri M, Franceschi C, Slagboom PE. Identifying the genomic determinants of aging and longevity in human population studies: progress and challenges. Bioessays. 2013;35:386–396. :10.1002/bies.201200148 [DOI] [PMC free article] [PubMed] [Google Scholar]
- 55. Gögele M, Pattaro C, Fuchsberger C, Minelli C, Pramstaller PP, Wjst M. Heritability analysis of life span in a semi-isolated population followed across four centuries reveals the presence of pleiotropy between life span and reproduction. J Gerontol A Biol Sci Med Sci. 2011;66:26–37. :10.1093/gerona/glq163 [DOI] [PubMed] [Google Scholar]
- 56. Willcox BJ, Willcox DC, He Q, Curb JD, Suzuki M. Siblings of Okinawan centenarians share lifelong mortality advantages. J Gerontol A Biol Sci Med Sci. 2006;61:345–354 doi:61/4/345 [DOI] [PubMed] [Google Scholar]
- 57. Kerber RA, O’Brien E, Smith KR, Cawthon RM. Familial excess longevity in Utah genealogies. J Gerontol A Biol Sci Med Sci. 2001;56:B130–B139. :10.1093/gerona/56.3.B130 [DOI] [PubMed] [Google Scholar]
- 58. Suzuki M, Mori H, Asato T, Sakugawa H, Ishii T, Hosoda Y. [Medical researches upon centenarians in Okinawa (1)–Case controlled study of family history as hereditary influence on longevity]. Nihon Ronen Igakkai Zasshi. 1985;22:457–467. :10.3143/geriatrics.22.457 [DOI] [PubMed] [Google Scholar]
- 59. Atzmon G, Schechter C, Greiner W, Davidson D, Rennert G, Barzilai N. Clinical phenotype of families with longevity. J Am Geriatr Soc. 2004;52:274–277. :10.1111/j.1532-5415.2004.52068.x [DOI] [PubMed] [Google Scholar]
- 60. Perls TT, Bubrick E, Wager CG, Vijg J, Kruglyak L. Siblings of centenarians live longer. Lancet. 1998;351:1560. :10.1016/S0140-6736(05)61126-9 [DOI] [PubMed] [Google Scholar]
- 61. Takata H, Suzuki M, Ishii T, Sekiguchi S, Iri H. Influence of major histocompatibility complex region genes on human longevity among Okinawan-Japanese centenarians and nonagenarians. Lancet. 1987;2:824–826. :S0140-6736(87)91015-4 [DOI] [PubMed] [Google Scholar]
- 62. Akisaka M, Suzuki M, Inoko H. Molecular genetic studies on DNA polymorphism of the HLA class II genes associated with human longevity. Tissue Antigens. 1997;50:489–493 PMID:9389323 [DOI] [PubMed] [Google Scholar]
- 63. Ivanova R, Hénon N, Lepage V, Charron D, Vicaut E, Schächter F. HLA-DR alleles display sex-dependent effects on survival and discriminate between individual and familial longevity. Hum Mol Genet. 1998;7:187–194. :10.1093/hmg/7.2.187 [DOI] [PubMed] [Google Scholar]
- 64. Naumova E, Ivanova M, Pawelec G. Immunogenetics of ageing. Int J Immunogenet. 2011;38:373–381. :10.1111/j.1744-313X.2011.01022.x [DOI] [PubMed] [Google Scholar]
- 65. Barzilai N, Atzmon G, Schechter C, et al. Unique lipoprotein phenotype and genotype associated with exceptional longevity. JAMA. 2003;290:2030–2040. :10.1001/jama.290.15.2030 [DOI] [PubMed] [Google Scholar]
- 66. Pollin TI, Damcott CM, Shen H, et al. A null mutation in human APOC3 confers a favorable plasma lipid profile and apparent cardioprotection. Science. 2008;322:1702–1705. :10.1126/science.1161524322/5908/1702 [DOI] [PMC free article] [PubMed] [Google Scholar]
- 67. Guevara-Aguirre J, Balasubramanian P, Guevara-Aguirre M, et al. Growth hormone receptor deficiency is associated with a major reduction in pro-aging signaling, cancer, and diabetes in humans. Sci Transl Med. 2011;3:70ra13. :10.1126/scitranslmed.30018453/70/70ra13 [DOI] [PMC free article] [PubMed] [Google Scholar]
- 68. Koropatnick TA, Kimbell J, Chen R, et al. A prospective study of high-density lipoprotein cholesterol, cholesteryl ester transfer protein gene variants, and healthy aging in very old Japanese-american men. J Gerontol A Biol Sci Med Sci. 2008;63:1235–1240 doi:63/11/1235 [DOI] [PubMed] [Google Scholar]
- 69. Jazwinski SM, Kim S, Dai J, et al. ; Georgia Centenarian Study and the Louisiana Healthy Aging Study. HRAS1 and LASS1 with APOE are associated with human longevity and healthy aging. Aging Cell. 2010;9:698–708. :10.1111/j.1474-9726.2010.00600.x [DOI] [PMC free article] [PubMed] [Google Scholar]
- 70. Kenyon CJ. The genetics of ageing. Nature. 2010;464:504–512. :10.1038/nature08980 [DOI] [PubMed] [Google Scholar]
- 71. Puca AA, Daly MJ, Brewster SJ, et al. A genome-wide scan for linkage to human exceptional longevity identifies a locus on chromosome 4. Proc Natl Acad Sci USA. 2001;98:10505–10508. :10.1073/pnas.181337598 [DOI] [PMC free article] [PubMed] [Google Scholar]
- 72. Geesaman BJ, Benson E, Brewster SJ, et al. Haplotype-based identification of a microsomal transfer protein marker associated with the human lifespan. Proc Natl Acad Sci USA. 2003;100:14115–14120. :10.1073/pnas.1936249100 [DOI] [PMC free article] [PubMed] [Google Scholar]
- 73. Nebel A, Croucher PJ, Stiegeler R, Nikolaus S, Krawczak M, Schreiber S. No association between microsomal triglyceride transfer protein (MTP) haplotype and longevity in humans. Proc Natl Acad Sci USA. 2005;102:7906–7909. :10.1073/pnas.0408670102 [DOI] [PMC free article] [PubMed] [Google Scholar]
- 74. Kiezun A, Garimella K, Do R, et al. Exome sequencing and the genetic basis of complex traits. Nat Genet. 2012;44:623–630. :10.1038/ng.2303 [DOI] [PMC free article] [PubMed] [Google Scholar]
- 75. Cavalli-Sforza LL. The Human Genome Diversity Project: past, present and future. Nat Rev Genet. 2005;6:333–340. :10.1038/nrg1596 [DOI] [PubMed] [Google Scholar]
- 76. Shirley MD, Baugher JD, Stevens EL, et al. Chromosomal variation in lymphoblastoid cell lines. Hum Mutat. 2012;33:1075–1086. :10.1002/humu.22062 [DOI] [PMC free article] [PubMed] [Google Scholar]
- 77. Willcox DC, Willcox BJ, He Q, Wang NC, Suzuki M. They really are that old: a validation study of centenarian prevalence in Okinawa. J Gerontol A Biol Sci Med Sci. 2008;63:338–349 doi:63/4/338 [DOI] [PubMed] [Google Scholar]