

Abstract
Background:
Cyclooxygenase-2 (COX-2) directs the synthesis of prostaglandins including PGE-2 linking inflammation with mitogenic signaling. COX-2 is also an anticancer target, however, treatment strategies have been limited by unreliable expression assays and by inconsistent tumor responses to COX-2 inhibition.
Methods:
We analyzed the TCGA and Director’s Challenge lung cancer datasets (n = 188) and also generated an LKB1-null lung cancer gene signature (n = 53) to search the Broad Institute/Connectivity-MAP (C-MAP) dataset. We performed ChIP analyses, real-time polymerase chain reaction, immunoblotting, and drug testing of tumor cell lines (n = 8) and primary lung adenocarcinoma surgical resections (n = 13).
Results:
We show that COX-2 is a target of the cAMP/CREB coactivator CRTC1 signaling pathway. In addition, we detected a correlation between LKB1 status, CRTC1 activation, and presence of glycosylated, but not inactive hypoglycosylated COX-2 in primary lung adenocarcinoma. A search of the C-MAP drug database discovered that all high-ranking drugs positively associated with the LKB1-null signature are known CRTC1 activators, including forskolin and six different PGE-2 analogues. Somatic LKB1 mutations are present in 20.0% of lung adenocarcinomas, and we observed growth inhibition with COX-2 inhibitors in LKB1-null lung cancer cells with activated CRTC1 as compared with LKB1-wildtype cells (NS-398, P = .002 and Niflumic acid, P = .006; two-tailed t test).
Conclusion:
CRTC1 activation is a key event that drives the LKB1-null mRNA signature in lung cancer. We also identified a positive feedback LKB1/CRTC1 signaling loop for COX-2/PGE2 regulation. These data suggest a role for LKB1 status and glycosylated COX-2 as specific biomarkers that provide a framework for selecting patients for COX-2 inhibition studies.
Our laboratory isolated CRTC1 (ie, MECT1/TORC1) as the oncogenic element of a recurrent chromosomal rearrangement that underlies the etiology of salivary gland tumors and a rare subset of primary lung tumors (1–4). CRTCs were independently identified as essential LKB1/AMPK family-regulated CREB coactivators that: 1) control a cassette of enzymes linked with glucose/fatty acid metabolism (5–7), 2) mediate the ability of AMPK to regulate aging in C. elegans (8), and 3) are linked in genome-wide association studies to development of esophageal cancer and Barrett’s esophagus (9). LKB1 mutations are among the most common somatic events in lung adenocarcinoma (10,11), and our previous studies detected aberrant CRTC1 activation in lung and esophageal cancer samples carrying LKB1-null alleles (12,13), suggesting a role in lung tumorigenesis. In this model, somatic LKB1 mutations result in hypophosphorylated CRTC1 that is enriched in the nucleus to activate downstream cAMP/CREB target genes that may directly participate in tumorigenesis (see Supplementary Figure 1, available online). In this manuscript, we have now identified CRTC1 activation as a primary event driving the LKB1-null mRNA signature in lung cancer and have detected induction of glycosylated COX-2 (ie, PTSG2) protein, but not the inactive hypoglycosylated species, as a specific biomarker in LKB1-null lung adenocarcinoma resection samples.
The related COX-1 and COX-2 products initiate the synthesis of potent lipid signaling messengers called prostaglandins from membrane-bound arachidonic acid using dual cyclooxygenase and peroxidase enzymatic properties (14–16). In contrast to COX-1, the COX-2 product is not detected in most adult normal tissues and is selectively activated by tumor mitogens; elevated levels of COX-2 protein are detected in a large number of premalignant and malignant tissues (17). These observations have focused attention for the past two decades on COX-2 as a tumor biomarker and as a potential therapeutic target for cancer treatment and prevention by COX-2 inhibitors such as aspirin and related nonsteroidal anti-inflammatory agents (NSAIDs) (18). COX-2 inhibitors suppress tumor cell growth in vitro and in vivo by induction of apoptosis (19,20). However, despite promising preclinical results using tumor cell lines in vitro and xenograft mouse models in vivo, there have been inconsistent data supporting COX-2 as a tumor biomarker and as the etiologic target for the cancer prevention activity of aspirin and NSAIDs (21). In this manuscript, we have identified a positive feedback loop between CRTC/COX-2/PGE2/cAMP and have linked LKB1 loss and CRTC1 activation with induction of glycosylated COX-2 protein and preferential sensitivity to COX-2 inhibition. These data suggest a more focused strategy for future cancer treatment and prevention clinical trials.
Methods
Plasmids
LKB1 and CRTC1 plasmids were previously described (12). The pLKO.1 lentiviral LKB1 shRNA and CRTC1 shRNA constructs were obtained from Open Biosystems (Huntsville, AL). The COX-2 promoter plasmid was a gift of Dr. Curtis C. Harris (National Cancer Institute, National Institutes of Health, Bethesda, MD). Retroviral and lentiviral vectors were transfected with helper plasmids into HEK293 cells using FUGENE 6 reagent (Roche Applied Science, Indianapolis, IN). Cell clones with stable expression were maintained in puromycin (Sigma, St Louis, MO) selection.
Tumor Cells
Lung and esophageal cancer cell lines (A549, H2126, H23, H460, A427, H157, H2122, H1819, H2087, H358, H2009, H322, H522, H3123, TE4, and KYSE-70) were cultured in RPMI 1640 medium supplemented with 10% FBS and antibiotics (Life Technologies, Long Island, NY). Lung adenocarcinoma biopsy samples (n = 13) were collected from the Moffitt Cancer Center Program using institutional review board–approved protocols with signed informed consent, snap frozen within 15 minutes, and analyzed as deidentified samples using approved Material Transfer Agreement with the University of Florida. Proteins extracts were lysed in RIPA buffer (Boston Bioproducts, Ashland, MA) and subjected to immunoblotting as described in the Supplementary Methods (available online).
Reagents and Antibodies
Mouse monoclonal anti-LKB1 and goat polyclonal antibodies anti-COX-2 antibodies were purchased from Santa Cruz (Santa Cruz, CA). Rabbit polyclonal anti-CRTC1 was purchased from Rockland Immunochemicals (Gilbertsville, PA).
Luciferase Assays
COX-2 promoter assays were performed with the dual-luciferase assay kit (Promega Corporation, Madison, WI) 48 hours after transfected with the indicated constructs. Normalized promoter activity represents average values from triplicate determinations with SD values.
ChIP Assay
The protocol was adapted from Chen et al. (22). Briefly, cells were fixed with 1% formaldehyde for 15 minutes, harvested, and rinsed 2× with 1× PBS. The cell pellet was sonicated, and crosslinked DNA fragments were enriched by immunoprecipitation with anti-CRTC1 antibody or rabbit immunoglobulin G (IgG) as control. The purified DNA is subjected to real-time (RT) polymerase chain reaction (PCR) amplification using 5’ COX-2 promoter or 3’UTR primers. 5’ COX-2 promoter: forward 5′- CCCCCACCGGGCTTACGCA-3′; Reverse 5′- TGCTCCTGACGCTCACTGCAA-3′. COX-2 3’UTR: forward 5′- GGTAAACCTCAGCTCAGGACTGCTA -3′; Reverse 5′-TCTCTGAGGC ACTAGCCTCTTTGC-3′.
RT-PCR Analysis
Total RNA was isolated with TRIzol (Invitrogen, Grand Island, NY), and 2 μg processed with the High-Capacity cDNA Reverse Transcription Kits (Applied Biosystems, Grand Island, NY) and TaqMan Fast Universal PCR Master Mix (Applied Biosystems, Grand Island, NY). Quantitative real-time PCR (qRT-PCR) was carried out using a 7900 HT Fast (Applied Biosystems, Grand Island, NY) system, and expression of target genes mRNA relative to 18s rRNA was calculated.
Immunofluorescence
Cells were washed with PBS, fixed with 4% formaldehyde for 10 minutes at 37°C, permeabilized with 0.5% Triton X-100 for five minutes at room temperature, and then blocked with 3% BSA overnight at 4°C. After washing with PBS, cells were incubated with primary antibody (1:1000 dilution) in 1% BSA for one hour at room temperature and then secondary antibody (1:10,000 dilution) conjugated to Alexa Fluor 594 for one hour at room temperature. Nuclei were stained with DAPI in the Vectashield mounting medium (Vector Laboratories, Burlingame, CA).
Wound-Healing Scratch Assay
Cells were grown to confluence and wounds were created by manually scraping the cell monolayer with a 200 ul pipette tip. Cells were washed twice in PBS for and photographed at 0 hours and 48 hours as indicated. Cell migration was evaluated by measuring the width of the wound at the identical position.
MTS Assay
Lung cancer cells (1×10³ cells/well) were cultured in 96-well plates (Corning, NY) with medium plus DMSO or in the presence of COX-2 inhibitors, NS-398 or Niflumic Acid (Cayman Chemical Company, Ann Arbor, MI). Plates were incubated (5% CO2, 37°C) for 72 hours. Cell proliferation was measured using MTS reagent as recommended by the manufacturer (Promega Corporation, Madison, WI).
Generation of LKB1 Mutation Signature
Cell-line gene expression and metadata (n = 53 lung cancer cell lines) was obtained from ArrayExpress (23) accession E-MTAB-783, supplemented with additional data from the Sanger Cell Line Project (http://www.broadinstitute.org/cgi-bin/cancer/datasets.cgi). CEL files were normalized using IRON (24) against the median sample. Histology and site of origin was conformed, and several misannotated cell lines, identified as outliers through principle component analysis (PCA), were corrected for histology and site of origin where supported by literature (A4-Fuk, MDA-MB-435, NCI-H1155, NCI-H1299, NCI-H1770, NCI-H810, SK-NEP-1). Large differences in gene expression were observed because of the batch effect (Affy_batch in the Sanger/Broad metadata) and corrected with COMBAT (25), using a conformed combination of site of origin and histology as the covariable. LKB1 mutational status for non–small cell lung cancer cell lines was curated from the literature (Luc Girard, personal communication) and confirmed in selected cases by immunoblotting. See the Supplementary Methods (available online) for further details.
Generation of Drug-Response Signatures from Connectivity Map Data
Gene expression CEL file data was downloaded from the Connectivity Map (26) (CMAP) website (http://www.broadinstitute.org/cmap/), consisting of 7056 CEL files covering 1309 compounds. See the Supplementary Methods (available online) for further details.
Searching CMAP Drug-Response Signatures Against LKB1 Signature
The LKB1 signature was compared against the CMAP drug-response signatures. Signature probesets not present in the CMAP drug-response dataset were removed prior to searching. For each compound, the Tanimoto Similarity (27) and Fisher’s exact test (P overlap) were calculated for the overlap of the LKB1 and compound signatures. Additionally, % overlap was calculated as 100 * (# overlap/min [size of compound signature], size of LKB1 signature). To further score the agreement of signs between the overlapping probesets, the quadrant count ratio ([# agree in sign - # opposite in sign]/# overlap) was calculated, as well as the P value of the sign agreement, P signs, assuming a two-sided binomial distribution. Compounds with three or more overlapping probesets, 5% or greater overlap, P overlap less than .05, P signs less than .05, and quadrant count ratio over 0.5 were considered to be statistically significant compound hits. Final overlap score was defined as: % overlap * # overlap * Tanimoto Similarity * quadrant count ratio * -log2(P overlap) * -log2(P signs).
Statistical Analysis
Experimental data were expressed as the mean ± SD. Differences were considered statistically significant at P less than .05 using a two-tailed t test. Statistical analyses were performed using Graphpad Prism software version 5.00 (Graphpad Software, Inc., CA).
Other materials and methods are described in the Supplementary Methods (available online).
Results
Effect of CRTC1 Activation in LKB1-Null Cells on COX-2 Expression
To study downstream CRTC1/cAMP/CREB target genes in lung cancer, we analyzed the collection of 2516 predicted CREB target genes (28) on the Affymetrix HG-U133A platform using the Director’s Challenge lung adenocarcinoma and TCGA squamous cell carcinoma public datasets (29). We selected lung cancer because we show that endogenous CRTC1 migrates predominantly as an aberrantly activated underphosphorylated species (Figure 1A) that is enriched in the nucleus in LKB1-null lung tumor cell lines (Supplementary Figure 2, available online). Analysis of lung adenocarcinoma (Figure 1B) and lung squamous cell carcinoma (Figure 1C) datasets (n = 188) identified COX-2 as a CREB-regulated biomarker inversely correlated with LKB1 status.
Figure 1.

LKB1-CRTC1 circuit regulates COX-2 in lung cancer cells. A) Protein immunoblot of endogenous CRTC1 in lung cancer lines. B) Heatmap generated from lung adenocarcinoma caArray dataset (left panel). Total of 100 lung adenocarcinoma samples (top 50 and bottom 50 samples on basis of COX-2 expression) were identified and subjected to analysis. One hundred fifty-one differentially expressed CREB target genes (39) (P < .05 and |fold change|>1.5) were identified concordant with COX-2 expression in lung adenocarcinoma (see Supplementary Methods, available online, steps for further details; see Supplementary Table 1, available online, for list of differentially expressed gene targets) (right panel). The top and bottom quartile samples (n = 72) were selected for analysis on basis of HighCOX2/LowLKB1 or LowCOX2/HighLKB1 expression. Five hundred and five probe sets (P < .05 and |fold change|>1.5) were identified inversely correlated with LKB1. C) heatmap was generated from the TCGA lung squamous cell cancer dataset (left panel). Total of 88 samples (either High COX-2 or Low COX-2) were selected for analysis. One hundred and nineteen CREB target Probe sets (P < .05 and |fold change|>1.5) were identified (right panel). Total of 56 samples (either High COX-2-Low LKB1 or Low COX-2-High LKB1) were selected for analysis. Two hundred and eight CREB target Probe sets (P < .05 and |fold change|>1.5) were identified (see Supplementary Methods, available online, for further details). D) COX-2 promoter-luciferase activity in lung cancer cells with defined LKB1 status. P = .03 LKB1 wt vs LKB1 null.
To confirm that COX-2 promoter activity was augmented in LKB1-null cells, we transfected the pGL3-endogenous-COX-2-promoter luciferase reporter into lung tumor lines and detected increased promoter activity in LKB1-null as compared with wildtype (wt) cells (Figure 1D). We also tested the forced expression of wt LKB1 in LKB1-null A549 cells and observed repression of COX-2 protein associated with CRTC1 hyperphosphorylation (Figure 2A). Reduced COX-2 mRNA was observed in all four LKB1-null tumor cell lines following ectopic expression of wt LKB1 as compared with vector control (Figure 2B). Conversely, shRNA-mediated depletion in LKB1-wt cells (H2087) resulted in a subtle downward shift in CRTC1 mobility and induction of COX-2 protein (Figure 2C) and mRNA levels in each of four different LKB1-wt lung cancer lines (Figure 2D). Similar findings were observed in esophageal cancer lines with defined LKB1 status (Supplementary Figure 3, available online). Finally, we confirmed regulation of COX-2 promoter activity following ectopic LKB1 expression (P = .02, two-tailed t test) (Figure 2E) or shRNA depletion of endogenous LKB1 (P = .04, two-tailed t test) (Figure 2F) using the pGL3-COX-2-promoter luciferase reporter.
Figure 2.
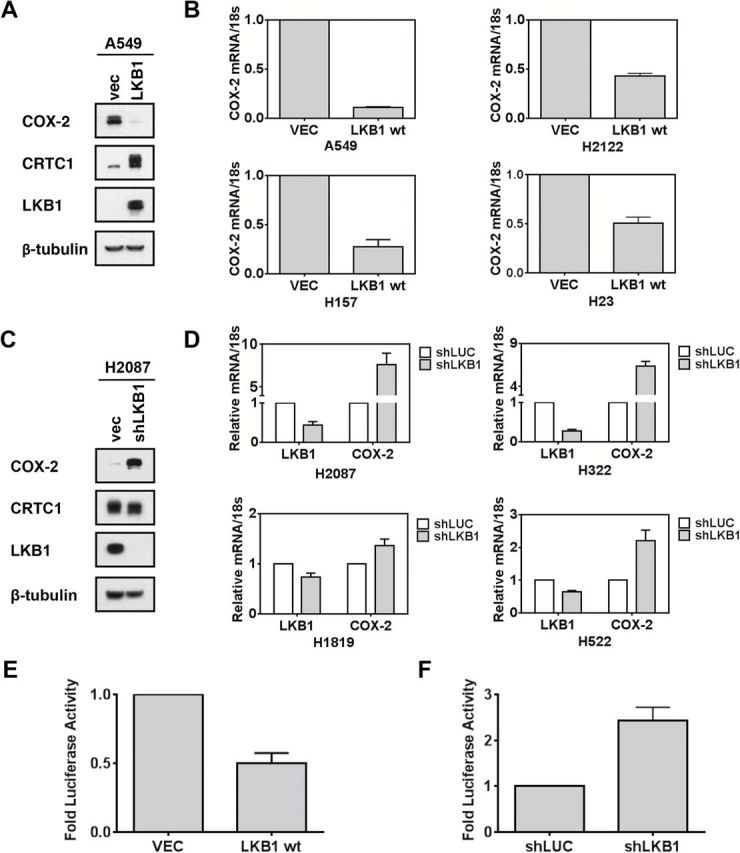
LKB1 regulates COX-2 in lung cancer cells through CRTC1. A) Protein immunoblot with indicated antibodies in A549 LKB1-null tumor cells. B) Quantitative real-time polymerase chain reaction analyses in LKB1-null tumor cell lines were normalized with 18S rRNA. Indicated cells were tested after forced expression with LKB1 or empty vector for 48 hours. C and D) Similar analyses as panels (A) and (B), except for use of LKB1-wt lung cancer cells following LKB1 shRNA depletion. E) COX-2 promoter-luciferase activity in LKB1-wt lung cancer cells (P = .02, two-tailed t test) or F) LKB1-null cells treated with indicated vectors for 48 hours (P = .04, two-tailed t test).
To test if LKB1-regulated CRTC1 can directly activate COX-2, we first showed coexpression of CRTC1 and COX-2 protein in each of 16 different adult mouse tissues tested by protein immunoblotting (Supplementary Figure 4, available online). Since human tumors express abundant CRTC1, we selected NIH3T3 cells with low endogenous CRTC1 and COX-2 levels and transfected either wt CRTC1 or a constitutively activated S151A CRTC1 that cannot undergo LKB1/AMPK-mediated phosphorylation (8,12,30). Levels of ectopic CRTC1 were comparable with endogenous steady-state CRTC1 in human tumor cells and we observed a nine-fold and more than 30-fold induction of COX-2 protein following transfection with wt or activated S151A CRTC1, respectively (Figure 3A). Cotransfection of CRTC1 shRNA blocked both CRTC1 expression and COX-2 induction. In addition, wt and S151A CRTC1 led to five-fold and 14-fold induction of COX-2 promoter activity, respectively (Figure 3B). Finally, chromatin immunoprecipitation (ChIP) analysis, using a highly specific anti-CRTC1 antibody (12), demonstrated binding of endogenous CRTC1 at the conserved 5’ promoter CRE element with 10-fold enrichment as compared with an IgG control or to ChIP from the 3’ untranslated COX-2 region (Figure 3C).
Figure 3.

CRTC1 directly regulates COX-2 and predicts a positive feedback loop deregulated following LKB1 loss. A) Protein immunoblot showing fold induction of COX-2 following ectopic expression of wt or constitutively activated S151A CRTC1. B) COX-2 promoter luciferase induction following ectopic expression of wt or S151A CRTC1. C) ChIP assay of CRTC1 binding to the 5’ COX2 promoter in lung cancer cells. P = .0016 vs IgG control for the real-time polymerase chain reaction analysis using the primers flanking the COX-2 promoter (two-tailed t test). The conserved CREB binding site (CRE) upstream of the TATA element in the COX-2 promoter is depicted. D) Illustration showing a new CRTC1 → COX-2 → PGE2 → cAMP → CRTC1 signaling loop that is normally restrained by wildtype LKB1 → AMPK/SIK1/2/MARK2 signaling. LKB1 is the master upstream regulator for AMPK-related kinases that phosphorylate and repress CRTC1 transcriptional activation via cytoplasmic sequestration. PGE2 (synthesized by COX-2), forskolin, and ß-adrenergic receptor agonists are known cAMP/CRTC1 activators and are depicted in red.
In summary, we demonstrate that activated CRTC1 enhances endogenous COX-2 expression in LKB1-null cells. Since PGE2 is both the product of COX-2 and can activate COX-2 expression in tumor cells (31,32), these data propose a novel positive feedback loop that is deregulated by loss of LKB1 and mediated by activation of CRTC1 (Figure 3D).
CRTC1 Activation and the LKB1-Null Gene Signature
We validated the LKB1 status and obtained global gene expression data in 53 lung cancer cell lines to define an LKB1-null mRNA signature that was used to screen the Broad Institute Connectivity Map (CMAP) (26) for potential drug compounds that induce this LKB1 signature. Only four outlier LKB1-wt lung tumor cell lines clustered within the LKB1-null signature, including H292 (Figure 4A, depicted by an arrow), which expresses a constitutively activated CRTC1 fusion oncogene required for tumorigenicity (1,33). This suggests an association of activated CRTC1 with expression of an LKB1-null signature. We confirmed this hypothesis by observing that each top-scoring compound from the CMAP database that was positively correlated with the LKB1-null signature represents a drug known to activate CRTC1 (two separate P value tests for each compound along with other measures of overlap and association were used to generate an overall composite score shown in Table 1; the statistical tests, measures of overlap and association, and the cutoffs used for significance are detailed in the Supplementary Methods, available online). For example, the top-scoring drug was colforsin, a water-soluble forskolin analogue that serves as the prototype for CRTC1 activation (see Supplementary Figure 2, available online) (6). In addition, multiple beta-adrenergic receptor agonists (34) and prostaglandin/PGE2 analogues (35) known to activate cAMP/CRTC1 were identified (Figure 4B). These data support a positive feedback loop, amplified by loss of LKB1, where the COX-2 product, PGE2, binds cognate EP receptors triggering cAMP/PKA activation that sustains CRTC1 dephosphorylation and further COX-2 activation (Figure 3D). In summary, these discoveries suggest that CRTC1 activation drives the LKB1-null mRNA signature and plays a critical role to mediate tumorigenic signaling in LKB1-null cancer cells. In addition, as predicted by clustering of the H292 cell line with the LKB1-null signature, we confirmed that activated CRTC1-MAML2 induced COX-2 protein expression (Supplementary Figure 5, available online).
Figure 4.
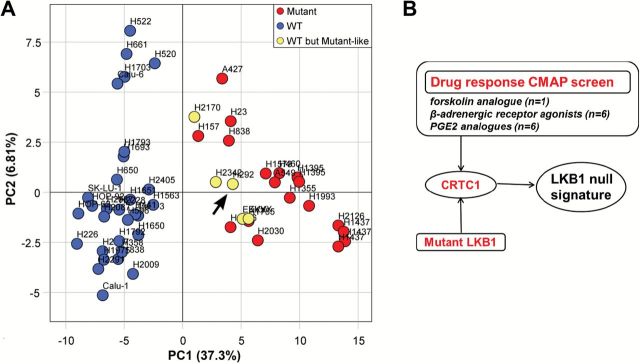
CRTC1 activation drives the LKB1-null gene signature. A) Principle component analysis of LKB1-null gene expression signature. LKB1-mutant lung cancer cell lines (red) completely separate from LKB1-wt cell lines (blue) along the first principle component. Four outlier LKB1-wt cell lines (H292, H2170, H2342, EKVX) exhibited an LKB1-null gene expression pattern (yellow). These cell lines were identified and omitted prior to signature generation. Two EKVX replicates were included for quality control and exhibit high reproducibility. The outlier H292 cell line (arrow) expresses the endogenous activated CRTC1 fusion oncogene that is required for sustained tumor cell growth (1,31). B) The indicated top scoring drugs identified in the C-MAP screen that drive the LKB1-null signature are known cAMP/CRTC1 activators. Custom software, metadata tables, and CMAP differentially expressed gene lists used in the CMAP and E-MTAB-783 analyses (see Supplementary Methods, available online, for further details).
Table 1.
Compounds positively correlated with LKB1 mutation signature
| Compound | # Probesets in CMAP DE signatures | # Probesets in compound signature | # Probesets in signature | # CMAP DE probesets in signature | # Overlap | % Overlap | Tanimoto similarity | Fisher’s exact test | Quadrant count tatio | P signs | Score |
|---|---|---|---|---|---|---|---|---|---|---|---|
| colforsin* | 18255 | 562 | 130 | 120 | 26 | 21.7 | 0.0396 | 2.58E-15 | 0.846 | 1.05E-05 | 168.8 |
| salbutamol† | 18255 | 325 | 130 | 120 | 20 | 16.7 | 0.0471 | 3.09E-14 | 1.000 | 1.91E-06 | 164.7 |
| alprostadil‡ | 18255 | 1001 | 130 | 120 | 24 | 20.0 | 0.0219 | 2.27E-08 | 0.750 | 2.77E-04 | 116.5 |
| dinoprostone‡ | 18255 | 484 | 130 | 120 | 17 | 14.2 | 0.0290 | 1.56E-08 | 0.882 | 2.75E-04 | 111.3 |
| (-)-isoprenaline† | 18255 | 203 | 130 | 120 | 12 | 10.0 | 0.0386 | 8.69E-09 | 0.833 | 6.35E-03 | 92.7 |
| 15(S)-15-methylprostaglandin E2‡ | 18255 | 334 | 130 | 120 | 13 | 10.8 | 0.0295 | 2.66E-07 | 0.846 | 3.42E-03 | 89.4 |
| 16,16-dimethylprostaglandin E2‡ | 18255 | 322 | 130 | 120 | 12 | 10.0 | 0.0279 | 1.22E-06 | 0.833 | 6.35E-03 | 81.6 |
| phenoxybenzamine§ | 18255 | 2018 | 130 | 120 | 24 | 20.0 | 0.0114 | 1.53E-03 | 0.583 | 6.61E-03 | 72.1 |
| isoxsuprine† | 18255 | 235 | 130 | 120 | 10 | 8.3 | 0.0290 | 3.05E-06 | 0.800 | 2.15E-02 | 70.8 |
| 16-phenyltetranorprostaglandin E2‡ | 18255 | 400 | 130 | 120 | 10 | 8.3 | 0.0196 | 2.44E-04 | 1.000 | 1.95E-03 | 69.3 |
| menadioneǁ | 18255 | 705 | 130 | 120 | 14 | 11.7 | 0.0173 | 1.60E-04 | 0.714 | 1.29E-02 | 67.9 |
| 11-deoxy-16,16-dimethylprostaglandin E2‡ | 18255 | 723 | 130 | 120 | 14 | 11.7 | 0.0169 | 2.05E-04 | 0.714 | 1.29E-02 | 67.2 |
| corbadrine† | 18255 | 177 | 130 | 120 | 9 | 7.5 | 0.0313 | 2.30E-06 | 0.778 | 3.91E-02 | 66.5 |
| metaraminol† | 18255 | 179 | 130 | 120 | 7 | 5.8 | 0.0240 | 1.58E-04 | 1.000 | 1.56E-02 | 58.3 |
| ritodrine† | 18255 | 208 | 130 | 120 | 7 | 5.8 | 0.0218 | 3.82E-04 | 1.000 | 1.56E-02 | 56.0 |
| chlortetracycline¶ | 18255 | 1198 | 130 | 120 | 13 | 10.8 | 0.0100 | 2.55E-02 | 0.692 | 2.25E-02 | 48.0 |
| calmidazolium¶ | 18255 | 526 | 130 | 120 | 9 | 7.5 | 0.0141 | 5.46E-03 | 0.778 | 3.91E-02 | 47.3 |
* Water-soluble forskolin. All compounds identified in the CMAP screen with a quadrant count ratio >0.5 listed in rank order of overall score of correlation with LKB1-null signature.
† β-adrenergic receptor agonists.
‡ Prostaglandin E (PGE) analogues.
§ α-adrenergic receptor antagonist.
‖ Unknown mechanism. However, exposure to menadione is associated with activation of PGC1alpha, the major downstream target for CRTC1/CREB, suggesting a possible role as a CRTC1 activator (Gleyzer N, Scarpulla RC. J Biol Chem. 22;288(12):8004–8015, 2013).
¶ Regulate intracellular calcium channel flow.
Glycosylated COX-2 as a Specific Biomarker for LKB1-Null Lung Cancer
COX-2 is differentially modified by N-glycosylation at Asn53, Asn130, Asn396, and Asn 580 sites (Figure 5A) (14,36). There are no previously published reports that discriminate glycosylated and basal COX-2 protein in lung tumor samples. Since LKB1/CRTC1 activates pathways associated with anabolic glucose metabolism (5) and since near-maximal N-glycosylation is required for COX-2 enzyme activity (36), we hypothesized that detection of glycosylated COX-2 could be a key biomarker for studying LKB1/CRTC1 activation in lung adenocarcinoma. In addition, we hypothesized that the failure of immunohistochemical assays to discriminate between unglycosylated and glycosylated COX-2 may explain the inconsistent role of COX-2 as a tumor biomarker and as a predictor for COX-2 inhibition in preclinical studies.
Figure 5.

Glycosylated COX-2 linked to LKB1 status in lung adenocarcinoma biopsy samples. A) Location of the 4 N-linked glycosylation sites of COX-2 and corresponding kDa (36). B) Protein immunoblot analysis from 13 fresh frozen lung primary lung adenocarcinoma resections using indicated antibodies. LKB1-null status (indicated with an asterisk) was inferred from relative LKB1 expression and direct gene resequencing. C) Protein immunoblot analyses of LKB1-null (A549) or wt (H2087) lung cancer cell lines in the presence or absence of tunicamycin after forced LKB1 expression or shRNA depletion, respectively. D) Protein immunoblots with whole cell lysates (W), cytoplasmic (C), or nuclear (N) fractions from the indicated lung cancer cells using the indicated antibodies, including HDAC1, enriched in the nucleus, and GAPDH, enriched in the cytoplasm, controls.
To test these hypotheses, lung adenocarcinoma surgical resections were subjected to immunoblot analysis for LKB1 and COX-2 expression. Despite presence of contaminating normal tissue, we were able to infer LKB1 status by scoring protein levels compared with ß-actin controls (Figure 5B). We also obtained LKB1 exon sequencing to confirm immunoblot findings in selected cases. We observed the slower mobility 72 of 74kDa COX-2 glycoforms in LKB1-null samples, while LKB1-wt samples were enriched for the faster migrating basal, 66–70kDa species (Figure 5B). Similar data were observed in two primary esophageal cancer biopsy samples with matched adjacent normal tissue (Supplementary Figure 6, available online).
To confirm these findings, we assessed the effect of tunicamycin to block N-glycosylation in lung tumor lines (Figure 5C). A549 LKB1-null and H2087 LKB1-wt cells were engineered to stably express vector control, LKB1, or LKB1-shRNA, respectively, in the presence or absence of tunicamycin. As expected, tunicamycin collapsed the slower mobility COX-2 species to the enzymatically inactive, hypoglycosylated 66, and 70kDa species. Unexpectedly, glycosylated 72–74kDa COX-2 species were detected in a nuclear membrane compartment that fractionated with the nuclear extract as compared with the hypoglycosylated species that fractionated to the cytoplasm (Figure 5D), confirming biological distinctions between differentially glycosylated COX-2 species.
Effect of LKB1 Status on Preferentially Sensitivity to COX-2 Inhibition in Lung Cancer
We tested the clinical implications of these findings by first investigating all published preclinical reports on the growth inhibitory effects of COX-2 inhibitors. We performed a PubMed search with the terms “COX-2 or PTGS2 inhibitor” and “lung cancer” and identified 52 publications over the past decade that showed a striking enrichment for growth inhibition in LKB1-null tumor lines. Although only 20% of non–small cell lung cancers are LKB1-null, 48 of 52 publications (92.3%) that assessed preclinical testing of COX-2 inhibitors in lung cancer in vivo or in vitro used the LKB1-null cell lines A549, H460, H23, H157, A427, or H2126. Fourteen of 15 publications (93.3%) showed tumor growth inhibition in LKB1-null lung cancer cells using in vivo mouse xenograft models (see Table 2), and 34 of 37 (91.9%) published reports showed tumor inhibition in LKB1-null lung cancer cells using in vitro assays (Supplementary Table 2, available online).
Table 2.
Preclinical studies with COX-2 inhibitors in human lung cancer xenograft models1999-2014
We then tested H23 (LKB1-null) or H322 (LKB1-wt) lung cancer cells with either the COX-2 inhibitors NS-398 or Niflumic Acid (Figure 6A) and observed enhanced cell killing in the LKB1-null tumor samples using clinically achievable in vivo doses (Supplementary Table 3, available online). The effects of COX-2 inhibition on tumor cell migration were also assessed by scratch assays, which demonstrated enhanced inhibition of LKB1-null cell migration (Figure 6B). We extended these observations by testing seven different lung cancer cell lines using both COX-2 inhibitors and observed enhanced efficacy in LKB1-null cells (P = .002 for NS-398; P = .006 for Niflumic Acid) (Figure 6C). Finally, we validated these findings by observing loss of drug sensitivity to both COX-2 inhibitors after engineering A549 cells to express wt LKB1 (P =.05 for NS-398; P =.02 for Niflumic Acid) (Figure 6D). Conversely, we observed enhanced tumor cell inhibition with either Niflumic acid or NS-398 after shRNA depletion of LKB1 in H2087 cells (P =.03 for NS-398; P =.02 for Niflumic Acid) (Figure 6E).
Figure 6.
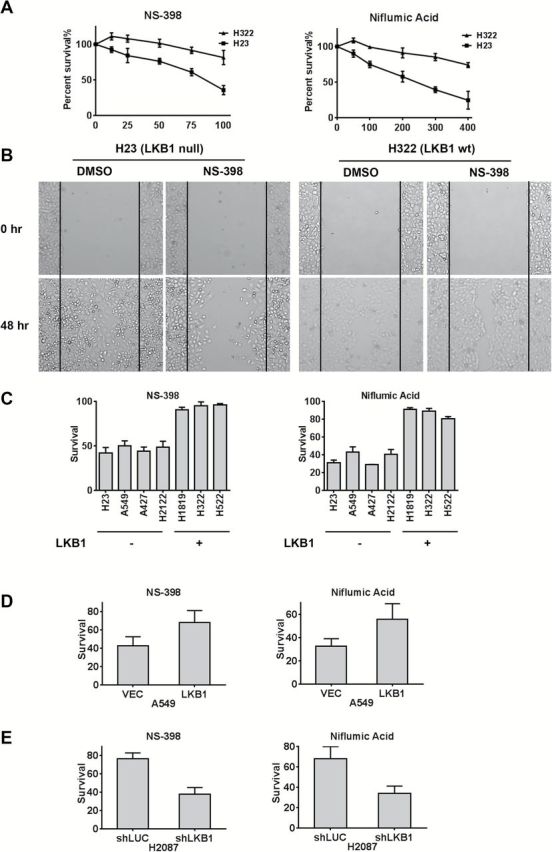
LKB1-null lung cancer cells are preferentially sensitive to COX-2 inhibition. A) LKB1-null H23 and LKB1-wt H322 cells were incubated with vehicle (DMSO) or Niflumic Acid at indicated µM doses. After 72 hours, MTS-based cell viability was determined. B) Scratch assay showing that NS-398 preferentially inhibits cell mobility in LKB1-null tumor cells. C) Seven different lung cancer cells with indicated LKB1 status were treated with either NS-398 (50 μM), P = .002 LKB1 null vs LKB1 wt or Niflumic Acid (300 μM), P = .006 LKB1 null vs LKB1 wt for 72 hours. MTS-based cell viability was determined as the mean of three independent experiments. D) Forced expression of LKB1 in A549 cells confers resistance to both COX-2 inhibitor agents using an MTS-based cell assay (72-hour incubation with either 100 μM NS-398 (left) P = .05 or 400 μM Niflumic Acid (right) P = .02. E) shRNA depletion of LKB1 in H2087 cells confers enhanced sensitivity to both COX-2 inhibitors under the same conditions as (D). P = .03 for NS -398, and P = .02 for Niflumic Acid.
To further confirm these data, we also tested tumor growth inhibition following COX-2 inhibition either by COX-2 inhibitor or shRNA depletion using a colony formation assay on eight lung cancer cell lines (four LKB1-null and four wt) (see Supplementary Figure 7, available online) and also using an in vivo mouse xenograft models (P = .02 with n = 12 mice and three mice for each treatment group) (see Supplementary Figure 8, available online). In summary, both assays detected preferential tumor growth inhibition in LKB1-null as compared with LKB1-wildtype lung tumor cells.
Discussion
These data raise several important points. First, because LKB1 signaling has the potential to impact many different phenotypes linked to alterations in cell polarity, cell invasion and motility, cell cycle regulation, and anabolic metabolism, there has been uncertainty in defining key signaling pathway(s) that underlie lung tumorigenesis following somatic mutational events (10). Our discovery that CRTC1 activators, including forskolin, PGE analogues, and beta-adrenergic agonist, drive the LKB1-null mRNA signature in lung cancer samples has provided a new understanding connecting CRTC/CREB coactivation with aberrant AMPK/SIK1/2 signaling as a critical event underlying this subset of lung cancer. Second, we identified a positive PGE2 → CRTC1/COX-2 → PGE2 feedback loop deregulated by loss of LKB1. The identification of COX-2 as a target for CRTC1 activation also helps explain earlier observations that gastrointestinal polyps in a Peutz-Jeghers LKB1-null mouse model are preferentially sensitive to tumor inhibition by COX-2 inhibitors (37). Finally, we identified induction of glycosylated COX-2 species as a predictive biomarker for LKB1-null lung adenocarcinoma samples that suggests limitations for the routine use of COX-2 immunohistochemical assays that do not discriminate between basal inactive COX-2. Study limitations for this analysis include the requirement for assays on additional tumor samples to validate these results and to determine if LKB1 loss acts jointly with other cooperating events such as KRAS mutations.
More recently, LKB1-null tumor cells have also been correlated with enhanced sensitivity in vivo to the mitochondrial inhibitor and AMPK activator, phenformin (38), although the mechanism for this effect is still undefined. In addition, a high-throughput screen using siRNA/synthetic small molecules identified sensitivity to depletion of COPI subunits in LKB1-null lung cancer cells (39), suggesting a possible role through maintenance and organization of Golgi machinery including glycosylation pathways (40). In summary, the CREB coactivator CRTC family links LKB1 with COX-2 activation and provides a new framework for selecting patients for COX-2 inhibition.
Funding
This work is supported by UF Gatorade Grant (F. J. Kaye), by National Cancer Institute K99-CA157954 (A. L. Amelio), by National Cancer Institute P50 CA119997 and the Department of Defense W81XWH-08-2-0101-P0001 (E. A. Welsh, W. D. Cress, E. B. Haura).
Supplementary Material
The study sponsors had no role in the design of the study, the collection, analysis, or interpretation of the data, the writing of the manuscript, nor the decision to submit the manuscript for publication.
The authors acknowledge the sharing of cell lines and information from Drs. John Minna and Luc Girard. We thank Yehia Daaka for helpful discussions and Rony Francois for technical assistance and review of the manuscript.
References
- 1. Tonon G, Modi S, Wu L, et al. t(11;19)(q21;p13) translocation in mucoepidermoid carcinoma creates a novel fusion product that disrupts a Notch signaling pathway. Nat Genet. 2003;33(2):208–213. [DOI] [PubMed] [Google Scholar]
- 2. Coxon A, Rozenblum E, Park YS, et al. Mect1-Maml2 fusion oncogene linked to the aberrant activation of cyclic AMP/CREB regulated genes. Cancer Res. 2005;65(16):7137–7144. [DOI] [PubMed] [Google Scholar]
- 3. Serra A, Schackert HK, Mohr B, Weise A, Liehr T, Fitze G. t(11;19)(q21;p12~p13.11) and MECT1-MAML2 fusion transcript expression as a prognostic marker in infantile lung mucoepidermoid carcinoma. J Pediatr Surg. 2007;42(7):E23–E29. [DOI] [PubMed] [Google Scholar]
- 4. Wu L, Liu J, Gao P, et al. Transforming activity of MECT1-MAML2 fusion oncoprotein is mediated by constitutive CREB activation. Embo J. 2005;24(13):2391–2402. [DOI] [PMC free article] [PubMed] [Google Scholar]
- 5. Altarejos JY, Montminy M. CREB and the CRTC co-activators: sensors for hormonal and metabolic signals. Nat Rev Mol Cell Biol. 2011;12(3):141–151. [DOI] [PMC free article] [PubMed] [Google Scholar]
- 6. Conkright MD, Canettieri G, Screaton R, et al. TORCs: transducers of regulated CREB activity. Mol Cell. 2003;12(2):413–423. [DOI] [PubMed] [Google Scholar]
- 7. Iourgenko V, Zhang W, Mickanin C, et al. Identification of a family of cAMP response element-binding protein coactivators by genome-scale functional analysis in mammalian cells. Proceedings of the National Academy of Sciences of the United States of America. 2003;100(21):12147–12152. [DOI] [PMC free article] [PubMed] [Google Scholar]
- 8. Mair W, Morantte I, Rodrigues AP, et al. Lifespan extension induced by AMPK and calcineurin is mediated by CRTC-1 and CREB. Nature. 2011;470(7334):404–408. [DOI] [PMC free article] [PubMed] [Google Scholar]
- 9. Levine DM, Ek WE, Zhang R, et al. A genome-wide association study identifies new susceptibility loci for esophageal adenocarcinoma and Barrett’s esophagus. Nat Genet. 2013;45(12):1487–1493. [DOI] [PMC free article] [PubMed] [Google Scholar]
- 10. Shah U, Sharpless NE, Hayes DN. LKB1 and lung cancer: more than the usual suspects. Cancer Res. 2008;68(10):3562–3565. [DOI] [PubMed] [Google Scholar]
- 11. Sanchez-Cespedes M, Parrella P, Esteller M, et al. Inactivation of LKB1/STK11 is a common event in adenocarcinomas of the lung. Cancer Res. 2002;62(13):3659–3662. [PubMed] [Google Scholar]
- 12. Komiya T, Coxon A, Park Y, et al. Enhanced activity of the CREB co-activator Crtc1 in LKB1 null lung cancer. Oncogene. 2010;29(11):1672–1680. [DOI] [PMC free article] [PubMed] [Google Scholar]
- 13. Gu Y, Lin S, Li JL, et al. Altered LKB1/CREB-regulated transcription co-activator (CRTC) signaling axis promotes esophageal cancer cell migration and invasion. Oncogene. 2012;31(4):469–479. [DOI] [PubMed] [Google Scholar]
- 14. Simmons DL, Botting RM, Hla T. Cyclooxygenase isozymes: the biology of prostaglandin synthesis and inhibition. Pharmacol Rev. 2004;56(3):387–437. [DOI] [PubMed] [Google Scholar]
- 15. Ferreira SH, Moncada S, Vane JR. Indomethacin and aspirin abolish prostaglandin release from the spleen. Nat New Biol. 1971;231(25):237–239. [DOI] [PubMed] [Google Scholar]
- 16. DeWitt DL, Smith WL. Primary structure of prostaglandin G/H synthase from sheep vesicular gland determined from the complementary DNA sequence. Proceedings of the National Academy of Sciences of the United States of America. 1988;85(5):1412–1416. [DOI] [PMC free article] [PubMed] [Google Scholar]
- 17. Kargman SL, O’Neill GP, Vickers PJ, Evans JF, Mancini JA, Jothy S. Expression of prostaglandin G/H synthase-1 and -2 protein in human colon cancer. Cancer Res. 1995;55(12):2556–2559. [PubMed] [Google Scholar]
- 18. Dannenberg AJ, Lippman SM, Mann JR, Subbaramaiah K, DuBois RN. Cyclooxygenase-2 and epidermal growth factor receptor: pharmacologic targets for chemoprevention. J Clin Oncol. 2005;23(2):254–266. [DOI] [PubMed] [Google Scholar]
- 19. Elder DJ, Halton DE, Crew TE, Paraskeva C. Apoptosis induction and cyclooxygenase-2 regulation in human colorectal adenoma and carcinoma cell lines by the cyclooxygenase-2-selective non-steroidal anti-inflammatory drug NS-398. Int J Cancer. 2000;86(4):553–560. [DOI] [PubMed] [Google Scholar]
- 20. Sawaoka H, Kawano S, Tsuji S, et al. Cyclooxygenase-2 inhibitors suppress the growth of gastric cancer xenografts via induction of apoptosis in nude mice. Am J Physiol. 1998;274(6 Pt 1):G1061–G1067. [DOI] [PubMed] [Google Scholar]
- 21. Peng L, Zhou Y, Wang Y, Mou H, Zhao Q. Prognostic significance of COX-2 immunohistochemical expression in colorectal cancer: a meta-analysis of the literature. PloS one. 2013;8(3):e58891. [DOI] [PMC free article] [PubMed] [Google Scholar]
- 22. Chen Z, Chen J, Gu Y, et al. Aberrantly activated AREG-EGFR signaling is required for the growth and survival of CRTC1-MAML2 fusion-positive mucoepidermoid carcinoma cells. Oncogene. 2013; 2014;33(29):3869–3877. [DOI] [PubMed] [Google Scholar]
- 23. Rustici G, Kolesnikov N, Brandizi M, et al. ArrayExpress update--trends in database growth and links to data analysis tools. Nucleic Acids Res. 2013;41(Database issue):D987–D990. [DOI] [PMC free article] [PubMed] [Google Scholar]
- 24. Welsh EA, Eschrich SA, Berglund AE, Fenstermacher DA. Iterative rank-order normalization of gene expression microarray data. BMC Bioinformatics. 2013;14:153. [DOI] [PMC free article] [PubMed] [Google Scholar]
- 25. Johnson WE, Li C, Rabinovic A. Adjusting batch effects in microarray expression data using empirical Bayes methods. Biostatistics. 2007;8(1):118–127. [DOI] [PubMed] [Google Scholar]
- 26. Lamb J, Crawford ED, Peck D, et al. The Connectivity Map: using gene-expression signatures to connect small molecules, genes, and disease. Science. 2006;313(5795):1929–1935. [DOI] [PubMed] [Google Scholar]
- 27. Rogers DJ, Tanimoto TT. A Computer Program for Classifying Plants. Science. 1960;132(3434):1115–1118. [DOI] [PubMed] [Google Scholar]
- 28. Zhang X, Odom DT, Koo SH, et al. Genome-wide analysis of cAMP-response element binding protein occupancy, phosphorylation, and target gene activation in human tissues. Proceedings of the National Academy of Sciences of the United States of America. 2005;102(12):4459–4464. [DOI] [PMC free article] [PubMed] [Google Scholar]
- 29. Comprehensive genomic characterization of squamous cell lung cancers. Nature. 2012;489(7417):519–525. [DOI] [PMC free article] [PubMed] [Google Scholar]
- 30. Screaton RA, Conkright MD, Katoh Y, et al. The CREB coactivator TORC2 functions as a calcium- and cAMP-sensitive coincidence detector. Cell. 2004;119(1):61–74. [DOI] [PubMed] [Google Scholar]
- 31. Tjandrawinata RR, Dahiya R, Hughes-Fulford M. Induction of cyclo-oxygenase-2 mRNA by prostaglandin E2 in human prostatic carcinoma cells. Br J Cancer. 1997;75(8):1111–1118. [DOI] [PMC free article] [PubMed] [Google Scholar]
- 32. Sonoshita M, Takaku K, Sasaki N, et al. Acceleration of intestinal polyposis through prostaglandin receptor EP2 in Apc(Delta 716) knockout mice. Nat Med. 2001;7(9):1048–1051. [DOI] [PubMed] [Google Scholar]
- 33. Komiya T, Park Y, Modi S, Coxon A, Oh H, Kaye FJ. Sustained expression of Mect1-Maml2 is essential for tumor cell growth in salivary gland cancers carrying the t(11;19) translocation. Oncogene. 2006;25(45):6128–6132. [DOI] [PubMed] [Google Scholar]
- 34. Kanyo R, Amyotte N, McTague J, Chik CL, Ho AK. Adrenergic regulation of the distribution of transducer of regulated cAMP-response element-binding protein (TORC2) in rat pinealocytes. Endocrinology. 2011;152(9):3440–3450. [DOI] [PubMed] [Google Scholar]
- 35. Jiang J, Dingledine R. Prostaglandin receptor EP2 in the crosshairs of anti-inflammation, anti-cancer, and neuroprotection. Trends Pharmacol Sci. 2013;34(7):413–423. [DOI] [PMC free article] [PubMed] [Google Scholar]
- 36. Otto JC, DeWitt DL, Smith WL. N-glycosylation of prostaglandin endoperoxide synthases-1 and -2 and their orientations in the endoplasmic reticulum. J Biol Chem. 1993;268(24):18234–18242. [PubMed] [Google Scholar]
- 37. Udd L, Katajisto P, Rossi DJ, et al. Suppression of Peutz-Jeghers polyposis by inhibition of cyclooxygenase-2. Gastroenterology. 2004;127(4):1030–1037. [DOI] [PubMed] [Google Scholar]
- 38. Shackelford DB, Abt E, Gerken L, et al. LKB1 inactivation dictates therapeutic response of non-small cell lung cancer to the metabolism drug phenformin. Cancer Cell. 2013;23(2):143–158. [DOI] [PMC free article] [PubMed] [Google Scholar]
- 39. Kim HS, Mendiratta S, Kim J, et al. Systematic identification of molecular subtype-selective vulnerabilities in non-small-cell lung cancer. Cell. 2013;155(3):552–566. [DOI] [PMC free article] [PubMed] [Google Scholar]
- 40. Pokrovskaya ID, Willett R, Smith RD, Morelle W, Kudlyk T, Lupashin VV. Conserved oligomeric Golgi complex specifically regulates the maintenance of Golgi glycosylation machinery. Glycobiology. 2011;21(12):1554–1569. [DOI] [PMC free article] [PubMed] [Google Scholar]
Associated Data
This section collects any data citations, data availability statements, or supplementary materials included in this article.