Abstract
Background
Previous studies have suggested the potential importance of three DPYD variants (DPYD*2A, D949V, and I560S) with increased 5-FU toxicity. Their individual associations, however, in 5-FU-based combination therapies, remain controversial and require further systematic study in a large patient population receiving comparable treatment regimens with uniform clinical data.
Methods
We genotyped 2886 stage III colon cancer patients treated adjuvantly in a randomized phase III trial with FOLFOX or FOLFIRI, alone or combined with cetuximab, and tested the individual associations between functionally deleterious DPYD variants and toxicity. Logistic regressions were used to assess univariate and multivariable associations. All statistical tests were two-sided.
Results
In 2594 patients with complete adverse event (AE) data, the incidence of grade 3 or greater 5FU-AEs in DPYD*2A, I560S, and D949V carriers were 22/25 (88.0%), 2/4 (50.0%), and 22/27 (81.5%), respectively. Statistically significant associations were identified between grade 3 or greater 5FU-AEs and both DPYD*2A (odds ratio [OR] = 15.21, 95% confidence interval [CI] = 4.54 to 50.96, P < .001) and D949V (OR = 9.10, 95% CI = 3.43 to 24.10, P < .001) variants. Statistical significance remained after adjusting for multiple variables. The DPYD*2A variant statistically significantly associated with the specific AEs nausea/vomiting (P = .007) and neutropenia (P < .001), whereas D949V statistically significantly associated with dehydration (P = .02), diarrhea (P = .003), leukopenia (P = .002), neutropenia (P < .001), and thrombocytopenia (P < .001). Although two patients with I560S had grade≥3 5FU-AEs; a statistically significant association could not be demonstrated because of its low frequency (P = .48).
Conclusion
In the largest study to date, statistically significant associations were found between DPYD variants (DPYD*2A and D949V) and increased incidence of grade 3 or greater 5FU-AEs in patients treated with adjuvant 5-FU-based combination chemotherapy.
Since its introduction more than 50 years ago, the fluoropyrimidine antimetabolite 5-fluorouracil (5-FU) has remained the mainstay of colon cancer treatment regimens. Though standard treatment of 5-FU/leucovorin (LV) with oxaliplatin (FOLFOX) or irinotecan (FOLFIRI) has improved survival and response rates in patients with metastatic disease (1–4), 5-FU-based treatment remains challenging because of patient variability in efficacy and toxicity (5,6). While variability may be linked to multiple clinical factors, the concept that genetic differences contribute to drug response has been confirmed in many research settings.
Pharmacogenetic studies related to 5-FU have traditionally focused on the rate-limiting catabolic enzyme, dihydropyrimidine dehydrogenase (DPD). DPD catabolizes approximately 85% of administered 5-FU, and its impairment leads to toxic accumulation of 5-FU anabolites in treated patients (5). To date, three DPYD gene variants are known to affect DPD activity: DPYD*2A (c.1905+1 G>A; rs3918290), D949V (c.2846A>T; rs67376798), and I560S (c.1679 T>G, DPYD*13, rs55886062) (7–16). Previous studies have identified links between increased incidence of 5-FU toxicity and the three variants (17–19); however, discrepant results in other studies have limited their utility for toxicity prediction (20–23). All three variants have relatively low minor allele frequencies (24), resulting in insufficient power to detect associations with toxicity in previous studies with limited numbers of patients. Combining disease populations and different treatment classes may also have contributed to the conflicting results.
Because of previous discrepancies and the need for validation in larger patient populations uniformly treated with current standard combination therapies, we genotyped the DPYD*2A, D949V, and I560S variants in a large cohort of stage III colon cancer patients treated in a randomized trial of FOLFOX or FOLFIRI, alone or combined with cetuximab, as adjuvant chemotherapy. Furthermore, we genotyped an additional 22 DPYD germ-line variants recently shown to result in decreased DPD activity (16) to test their individual associations with grade 3 or greater (grade ≥3) toxicity.
Methods
Study Population
Biospecimens were prospectively collected from resected, stage III colon cancer patients in a randomized phase III trial (NCCTG N0147, NCT00079274) (25). All patients received chemotherapy within 10 weeks of surgery after enrollment in one of the following treatment arms: FOLFOX only, FOLFOX+cetuximab, FOLFIRI only, FOLFIRI+cetuximab, or six cycles of FOLFOX followed by six cycles of FOLFIRI ± cetuximab. The stratification factors included: N stage (N1 vs N2), T stage (T1/2 vs T3 vs T4), histologic grade (high [poorly differentiated/undifferentiated] vs low [well/moderately differentiated]), right (proximal) tumor side (cecum, ascending and transverse colon), and left (distal) tumor side (splenic flexure, descending and sigmoid colon). The study was approved by the Mayo Clinic Institutional Review Board and the NCCTG (Alliance for Clinical Trials in Oncology). Each participant signed an IRB-approved informed consent in accordance with federal and institutional guidelines.
DNA derived from whole blood was available on 2886 patients. Patients were assessed biweekly for adverse events (AEs) according to the National Cancer Institute (NCI), Common Toxicity Criteria (v.3). Fatigue, anorexia, dehydration, diarrhea, stomatitis/mucositis, nausea/vomiting, leukopenia, neutropenia, febrile neutropenia, thrombocytopenia, and pain are all AEs that were classified as common to 5-FU treatment (5FU-AEs) which was performed by the study chair who was blinded to SNP data. In August 2008, treatment randomization was restricted to patients whose tumors had wild-type (WT) copies of KRAS. Patients with KRAS mutant (MUT) tumors (n = 292) were treated per physician discretion with very limited AE data. Therefore, a total of 2594 patients were included in the AE association analyses. Data on BRAF and DNA mismatch repair proteins (MMR) were also available (25,26).
Genotyping for Functionally Deleterious DPYD Variants
Genotyping for 25 DPYD variants functionally characterized to result in decreased DPD enzyme activity was performed as a part of a larger genetic biomarker screening project including a total of 180 variants across 22 genes involved in 5-FU, oxaliplatin, or irinotecan response. Polymerase chain reaction (PCR) and extension primers were designed for all genotyped variants using the Sequenom Assay Design Software version 4.0 (Sequenom, San Diego CA). Functionally deleterious DPYD variants, frequencies, and primer sequences are available in Supplementary Table 1 (available online). PCR amplification was performed in a 5µl multiplex reaction using 20ng of patients’ DNA following manufacturer’s protocol. PCR products were digested with Shrimp Alkaline Phosphatase prior to single-base extension using the IPLEX Gold Kit following manufacturer’s protocol. Extension products were then desalted with a cation exchange resin, transferred to a 384-element silica array (SpectroCHIP v.II) using the MassARRAY nanodispenser, and analyzed on the basis of mass using matrix-assisted laser desorption ionization time-of-flight (MALDI-TOF) mass spectrometry on the Sequenom MassARRAY system.
Statistical Analysis
The primary outcome was rate of AEs common in 5-FU treatment (5FU-AE), defined as the proportion of patients with at least one grade three or greater 5FU-AE during the entire course of the treatment. The secondary outcomes include any grade≥3 AE (overall AE) rate and disease-free survival (DFS). DFS was defined as the time from the date of random assignment to the first documented recurrence of colon cancer or death from any cause, whichever occurred first. Follow-up for all patients was censored five years after randomization. The frequency for each variant was compared with the published frequencies in dbSNP and tested for departure from Hardy-Weinberg equilibrium. Chi-squared or Fisher’s exact test, unequal variance two-sample t test, and Wilcoxon rank sum test were used to compare the categorical variables, continuous variables, and counts between patients’ DPYD variant status (27,28). Logistic regression was used to assess the association between SNP status and AE rates, adjusting for clinicopathological factors (28). The Kaplan-Meier method was used to estimate the distributions of DFS (29). Cox model was used to assess univariate and multivariable associations between variant status and DFS (30). The proportional hazards assumption was verified by diagnostic test based on scaled Schoenfeld residuals. Unless otherwise specified, all multivariable models were adjusted for age, sex, performance score, stratification factors (T/N stage and grade), primary tumor site, KRAS, BRAF, MMR, treatment, total number of treatment cycles, and dose modifications. Associations between 5FU-AE rate and variant status were further assessed in prespecified subgroups: treatments, race, and sex. Sensitivity, specificity, and positive and negative predictive values were calculated for variants with statistically significant associations with grade≥3 5FU-AEs. All analyses were performed in SAS v9 and a P value under .05 was considered statistically significant. All statistical tests were two-sided. Data collection and statistical analyses were conducted by the Alliance Statistics and Data Center.
Results
Patient Characteristics and Incidence of Grade≥3 AEs
Summary characteristics for 2886 colon cancer patients with available DNA are as followed: 53.2% male, median age of 58 years [range = 19–86 years], 87.6% Caucasian, T3 73.0% T3, 12.6% BRAF MUT, 36.2% KRAS MUT, 40.5% with 4 or more positive nodes 88.6% pMMR status, 76.6% Performance Score 0 (PS-0), 8.1% of patients received irinotecan, 45.9% received cetuximab, 25.7% received fewer than12 treatment cycles, and 74.3% had at least one dose modification.
A total of 2594 of 2886 patients had complete AE and genotype data available for analysis. Summary statistics for our study cohort of 2594 patients with complete AE data are provided in Table 1. One thousand six hundred and eight patients (62.0%) reported any grade≥3 AE (overall AE), with 859 patients (33.1%) reporting any grade≥3 5FU-AE. Most frequent 5FU-AEs included: diarrhea (12.0%), neutropenia (11.7%), nausea/vomiting (5.0%), fatigue (4.9%), and mucositis (4.2%). Older patients were more likely to experience 5FU-AEs than younger patients (P < .001). Females reported higher 5FU-AEs than males (38.5% vs 28.4%, P < .001). Caucasian patients also showed a higher 5FU-AE rate compared to other races (P = .001). Other factors statistically significantly associated with higher rates of 5FU-AEs were high (vs low) histology grade, right-sided (vs left-sided) tumors, BRAF MUT (vs WT) tumors, and patients receiving cetuxumab (vs not). Patients who discontinued treatment before completing 12 cycles were more likely to have experienced 5FU-AEs, compared with those who completed all 12 cycles (38.3% vs 31.4%, P = .001). Patients with either grade≥3 5FU-AEs or grade≥3 overall AEs were also more likely to have received a dose modification (13.7% vs 39.6%, P < .001; 32.4% vs 72.0%, P < .001).
Table 1.
Patient characteristics among study population with adverse event data
| Grade≥3 5FU-AE | Grade≥3 overall AE | |||||||
|---|---|---|---|---|---|---|---|---|
| Characteristic | No (n = 1735) | Yes (n = 859) | Total (n = 2594) | P | No (n = 986) | Yes (n = 1608) | Total (n = 2594) | P |
| Age, y | <.001* | <.001* | ||||||
| Median | 57.0 | 62.0 | 58.0 | 57.0 | 59.0 | 58.0 | ||
| Range | (19.0–85.0) | (25.0–86.0) | (19.0–86.0) | (19.0–85.0) | (21.0–86.0) | (19.0–86.0) | ||
| Sex, No. (%) | <.001† | <.001† | ||||||
| Female | 743 (61.5) | 466 (38.5) | 1209 (46.6) | 413 (34.2) | 796 (65.8) | 1209 (46.6) | ||
| Male | 992 (71.6) | 393 (28.4) | 1385 (53.4) | 573 (41.4) | 812 (58.6) | 1385 (53.4) | ||
| Race, No. (%) | .006† | .007† | ||||||
| Missing | 25 | 8 | 33 | 15 | 18 | 33 | ||
| Caucasian | 1476 (65.7) | 772 (34.3) | 2248 (87.8) | 831 (37.0) | 1417 (63.0) | 2248 (87.8) | ||
| Black/African American | 131 (77.1) | 39 (22.9) | 170 (6.6) | 70 (41.2) | 100 (58.8) | 170 (6.6) | ||
| Asian | 89 (73.6) | 32 (26.4) | 121 (4.7) | 63 (52.1) | 58 (47.9) | 121 (4.7) | ||
| Other | 14 (63.6) | 8 (36.4) | 22 (0.86) | 7 (31.8) | 15 (68.2) | 22 (0.86) | ||
| T stage, No. (%) | .73† | .36† | ||||||
| Missing | 1 | 0 | 1 | 0 | 1 | 1 | ||
| T1 or T2 | 272 (68.5) | 125 (31.5) | 397 (15.3) | 162 (40.8) | 235 (59.2) | 397 (15.3) | ||
| T3 | 1278 (66.7) | 639 (33.3) | 1917 (73.9) | 714 (37.2) | 1203 (62.8) | 1917 (73.9) | ||
| T4 | 184 (65.9) | 95 (34.1) | 279 (10.8) | 110 (39.4) | 169 (60.6) | 279 (10.8) | ||
| N stage, No. (%) | .05† | .16† | ||||||
| N1 | 1001 (65.3) | 531 (34.7) | 1532 (59.1) | 565 (36.9) | 967 (63.1) | 1532 (59.1) | ||
| N2 | 734 (69.1) | 328 (30.9) | 1062 (40.9) | 421 (39.6) | 641 (60.4) | 1062 (40.9) | ||
| Histology grade, No. (%) | .02† | .26† | ||||||
| Low | 1324 (68.1) | 619 (31.9) | 1943 (74.9) | 751 (38.7) | 1192 (61.3) | 1943 (74.9) | ||
| High | 411 (63.1) | 240 (36.9) | 651 (25.1) | 235 (36.1) | 416 (63.9) | 651 (25.1) | ||
| ECOG PS, No. (%) | .33† | .18† | ||||||
| Missing | 2 | 0 | 2 | 0 | 2 | 2 | ||
| 0 | 1328 (67.4) | 643 (32.6) | 1971 (76.0) | 764 (38.8) | 1207 (61.2) | 1971 (76.0) | ||
| 1 or 2 | 405 (65.2) | 216 (34.8) | 621 (24.0) | 222 (35.7) | 399 (64.3) | 621 (24.0) | ||
| Primary tumor side, No. (%) | <.001† | <.001† | ||||||
| Missing | 24 | 13 | 37 | 17 | 20 | 37 | ||
| Right | 821 (63.8) | 466 (36.2) | 1287 (50.3) | 445 (34.6) | 842 (65.4) | 1287 (50.3) | ||
| Left | 890 (70.1) | 380 (29.9) | 1270 (49.7) | 524 (41.3) | 746 (58.7) | 1270 (49.7) | ||
| KRAS, No. (%) | .54† | .86† | ||||||
| Missing | 65 | 29 | 94 | 37 | 57 | 94 | ||
| Mutant | 489 (67.7) | 233 (32.3) | 722 (28.9) | 272 (37.7) | 450 (62.3) | 722 (28.9) | ||
| Wildtype | 1181 (66.4) | 597 (33.6) | 1778 (71.1) | 677 (38.1) | 1101 (61.9) | 1778 (71.1) | ||
| BRAF, No. (%) | <.001† | .23† | ||||||
| Missing | 101 | 46 | 147 | 58 | 89 | 147 | ||
| Mutant | 201 (58.6) | 142 (41.4) | 343 (14.0) | 120 (35.0) | 223 (65.0) | 343 (14.0) | ||
| Wildtype | 1433 (68.1) | 671 (31.9) | 2104 (86.0) | 808 (38.4) | 1296 (61.6) | 2104 (86.0) | ||
| MSI, No. (%) | .12† | .90† | ||||||
| Missing | 64 | 28 | 92 | 37 | 55 | 92 | ||
| pMMR | 1481 (67.3) | 718 (32.7) | 2199 (87.9) | 833 (37.9) | 1366 (62.1) | 2199 (87.9) | ||
| dMMR | 190 (62.7) | 113 (37.3) | 303 (12.1) | 116 (38.3) | 187 (61.7) | 303 (12.1) | ||
| Received cetuximab, No. (%) | <.001† | <.001† | ||||||
| No | 1002 (71.4) | 401 (28.6) | 1403 (54.1) | 664 (47.3) | 739 (52.7) | 1403 (54.1) | ||
| Yes | 733 (61.5) | 458 (38.5) | 1191 (45.9) | 322 (27.0) | 869 (73.0) | 1191 (45.9) | ||
| Received irinotecan, No. (%) | .40† | .18† | ||||||
| No | 1600 (67.1) | 784 (32.9) | 2384 (91.9) | 897 (37.6) | 1487 (62.4) | 2384 (91.9) | ||
| Yes | 135 (64.3) | 75 (35.7) | 210 (8.1) | 89 (42.4) | 121 (57.6) | 210 (8.1) | ||
| Total number of cycles of treatment received, No. (%) | .001† | .16† | ||||||
| Missing | 4 | 0 | 4 | 2 | 2 | 4 | ||
| <12 cycles | 411 (61.7) | 255 (38.3) | 666 (25.7) | 238 (35.7) | 428 (64.3) | 666 (25.7) | ||
| 12 cycles | 1320 (68.6) | 604 (31.4) | 1924 (74.3) | 746 (38.8) | 1178 (61.2) | 1924 (74.3) | ||
| Dose modification, No. (%) | <.001† | <.001† | ||||||
| Missing | 16 | 13 | 29 | 7 | 22 | 29 | ||
| No | 568 (86.3) | 90 (13.7) | 658 (25.7) | 445 (67.6) | 213 (32.4) | 658 (25.7) | ||
| Yes | 1151 (60.4) | 756 (39.6) | 1907 (74.3) | 534 (28.0) | 1373 (72.0) | 1907 (74.3) | ||
* Two-sided unequal variance t test. 5-FU = 5-fluorouracil; AE = adverse event; dMMR = deficient mismatch repair; ECOG PS = Eastern Cooperative Oncology Group performance status; MSI = microsatellite instability; N stage = lymph node stage; pMMR = proficient mismatch repair; T stage = tumor stage.
† Two-sided chi-squared test (or Fisher’s Exact test).
Incidence of DPYD Variants in the Study Population
In the 2886 patients genotyped, 27 (0.94%), four (0.14%), and 32 (1.1%) patients carried the DPYD*2A, I560S, and D949V variants, respectively, in the heterozygous state. One patient was heterozygous for both DPYD*2A and D949V. Six patients had missing genotype calls for DPYD*2A and D949V because of failure of PCR amplification or extension. All patients were successfully genotyped for the I560S variant. One patient (Caucasian female, 61 years of age) was heterozygous for P92A (c.274 G>C; rs143986398). Twenty-one of the functionally deleterious variants were not present in the study population. Allele frequencies for DPYD*2A, I560S, and D949V were consistent with published data and were in Hardy-Weinberg equilibrium (Supplementary Table 2, available online).
Patients carrying DPYD*2A variants were less likely to complete all 12 treatment cycles compared with wild-type patients (56.0% vs 74.0%, P = .04). No statistically significant associations were detected between DPYD variants and other patient characteristics described in Supplementary Table 3 (available online).
Among 2594 patients with complete AE data, the incidence of grade≥3 5FU-AEs in DPYD*2A, I560S, and D949V carriers were 22/25 (88.0%), 2/4 (50.0%), and 22/27 (81.5%), respectively, whereas incidence of grade≥3 overall AEs were 22/25 (88.0%), 3/4 (75.0%), and 24/27 (88.9%). A total of 16 DPYD*2A (64.0%), 1 I560S (25.0%), and 18 D949V (66.7%) patients had at least one grade 4 AE. The compound heterozygous DPYD*2A/D949V patient had a grade 5 event. No grade≥3 AEs were detected in the patient carrying P92A.
In the 25 DPYD*2A patients, 11 (44.0%) received less than 12 cycles (median = 8, range = 1–11), and 20 (80.0%) had at least one dose modification. All 14 DPYD*2A patients who completed all 12 treatment cycles received at least one dose modification. In the three patients carrying the DPYD*2A variant with no grade≥3 AE, three received at least one dose modification and two completed all 12 treatment cycles.
In the 27 D949V patients, eight (29.6%) received <12 cycles (median = 3.5, range = 1–6), and 20 (74.1%) had at least one dose modification. For the 19 D949V patients who completed all 12 cycles, 17 received at least one dose modification. In the three patients carrying the D949V variant with no grade≥3 AE, all completed 12 treatment cycles with one receiving at least one dose modification. The patient carrying both the DPYD*2A and D949V variants was only able to receive one cycle of FOLFOX+cetuximab.
In the four I560S patients, one (25.0%) received less than 12 cycles, and three (75.0%) had at least one dose modification.
Association Analysis Vetween DPYD Variants and Grade≥3 AEs
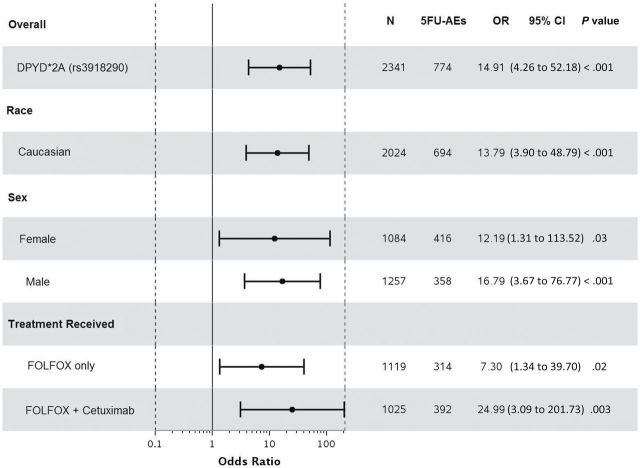
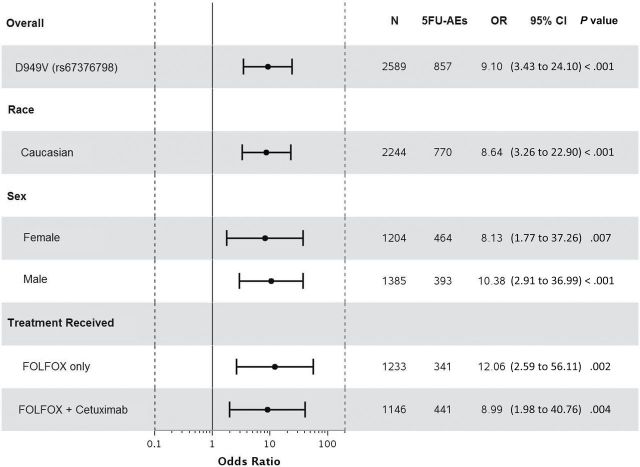
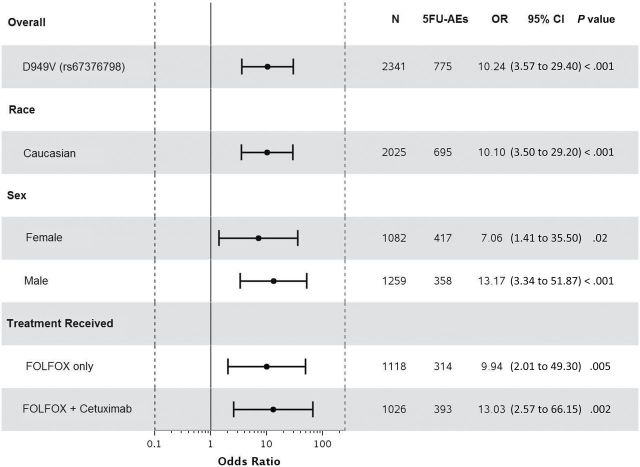
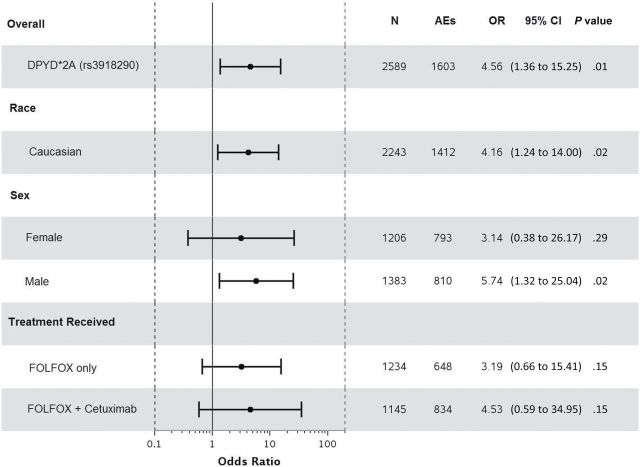
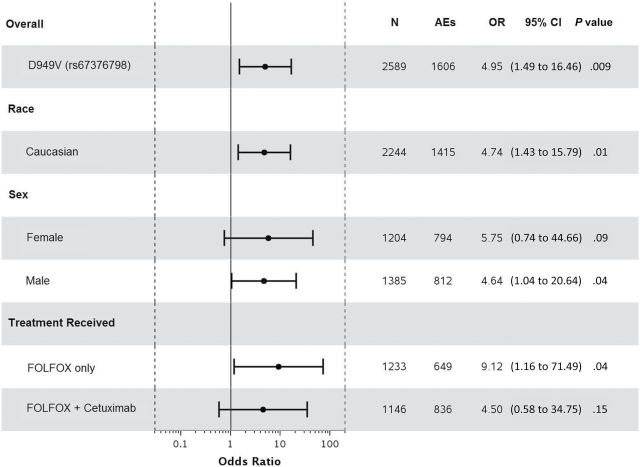
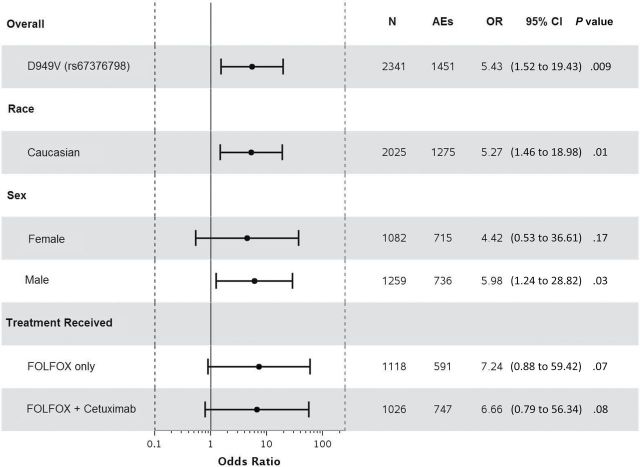
Statistically significant associations were identified between grade≥3 5FU-AEs and both DPYD*2A (odds ratio [OR] = 15.21, 95% confidence interval [CI] = 4.54 to 50.96, P < .001) and D949V (OR = 9.10, 95% CI = 3.43 to 24.10, P < .001) variants (Figure 1, A and C). Associations were also detected between grade≥3 overall AEs and both DPYD*2A (OR = 4.56, 95% CI = 1.36 to 15.25, P = .01) and D949V (OR = 4.95, 95% CI = 1.49 to 16.46, P = .009) variants (Figure 2, A and C). Both DPYD*2A and D949V associations with grade≥3 5FU-AEs remain statistically significant after adjusting for age, sex, grade, T/N stage, PS, tumor location, KRAS, MSI, treatment, number of cycles received, and dose modification (Figure 1, B, and D). D949V remained significantly associated with grade>3 overall AEs in the adjusted model (P = .009), but not DPYD*2A (P = .05) (Figure 2, B and D). The DPYD*2A variant significantly associated with the specific AEs nausea/vomiting (P = .007) and neutropenia (P < .001), whereas D949V statistically significantly associated with dehydration (P = .02), diarrhea (P = .003), leukopenia (P = .002), neutropenia (P < .001), and thrombocytopenia (P < .001) (Table 2).
Figure 1.
Forest plots for the associations between DPYD variants and grade≥3 5FU-AEs in the N0147 study population and in different subgroups. A) DPYD*2A univariate (unadjusted). B) DPYD*2A multivariable (adjusted). C) D949V univariate (unadjusted). D) D949V multivariable (adjusted). Multivariable models were adjusted for age, sex, performance score, stratification factors (T/N stage and grade), primary tumor site, KRAS, BRAF, MMR, treatment, total number of treatment cycles, and dose modifications.Two-sided P values were calcuated using a logistic regression model. 5FU-AEs = grade≥3 adverse events common to 5-FU; CI = confidence interval; OR = odds ratio.
Figure 2.
Forest plots for the associations between DPYD variants and grade≥3 overall adverse events in the N0147 study population and in different subgroups. A) DPYD*2A univariate (unadjusted). B) DPYD*2A multivariable (adjusted). C) D949V univariate (unadjusted). D) D949V multivariable (adjusted). Multivariable models were adjusted for age, sex, performance score, stratification factors (T/N stage and grade), primary tumor site, KRAS, BRAF, MMR, treatment, and total number of treatment cycles, and dose modifications. Two-sided P values were calculated using a logistic regression model. AEs = any grade≥3 adverse event; CI = confidence interval; OR = odds ratio.
Table 2.
Grade≥3 5FU-Adverse events and incidence of DPYD*2A and D949V variants••
| Adverse events (grade≥3) | DYPD*2A (rs3918290) | D949V (rs67376798) | ||||
|---|---|---|---|---|---|---|
| Carrier, no. (%) (n = 25) | Wild-type, no. (%) (n = 2564) | P* | Carrier, no. (%) (n = 27) | Wild-type, no. (%) (n = 2562) | P* | |
| Overall AEs | 22 (88.0%) | 1581 (61.7%) | .007 | 24 (88.9%) | 1582 (61.8%) | .004 |
| 5FU-AEs | 22 (88.0%) | 834 (32.5%) | <.001 | 22 (81.5%) | 835 (32.6%) | <.001 |
| Constitutional symptoms | ||||||
| Fatigue | 2 (8.0%) | 122 (4.8%) | .34 | 2 (7.4%) | 124 (4.8%) | .38 |
| Gastrointestinal | ||||||
| Anorexia | 0 (0.0%) | 39 (1.5%) | 1.0 | 0 (0.0%) | 39 (1.5%) | 1.0 |
| Dehydration | 2 (8.0%) | 58 (2.3%) | .11 | 3 (11.1%) | 57 (2.2%) | .02 |
| Diarrhea | 3 (12.0%) | 305 (11.9%) | 1.0 | 9 (33.3%) | 299 (11.7%) | .003 |
| Stomatitis/muscositis | 3 (12.0%) | 107 (4.2%) | .09 | 2 (7.4%) | 106 (4.1%) | .31 |
| Nausea/vomiting | 5 (20.0%) | 124 (4.8%) | .007 | 2 (7.4%) | 127 (5.0%) | .39 |
| Blood/bone marrow | ||||||
| Leukopenia | 2 (8.0%) | 47 (1.8%) | .08 | 4 (14.8%) | 46 (1.8%) | .002 |
| Neutropenia | 16 (64.0%) | 288 (11.2%) | <.001 | 15 (55.6%) | 289 (11.3%) | <.001 |
| Thrombocytopaenia | 1 (4.0%) | 8 (0.3%) | .08 | 3 (11.1%) | 6 (0.2%) | <.001 |
| Febrile neutropenia | 2 (8.0%) | 42 (1.6%) | .07 | 2 (7.4%) | 42 (1.6%) | .08 |
| Pain | 0 (0.0%) | 20 (0.8%) | 1.0 | 0 (0.0%) | 20 (0.8%) | 1.0 |
* Two-sided P values were calculated using a chi-squared test. Overall AEs = any adverse event grade≥3. 5FU-AEs = grade≥3 adverse event common to 5-fluorouracil. P values in bold indicate statistical significance.
When restricting the analysis to Caucasians, sex, or treatment, statistically significant associations were maintained between both DPYD*2A and D949V variants and grade≥3 5FU-AEs (Figure 1). Furthermore, DPYD*2A displayed a greater effect size on risk of 5FU-AEs in males compared with females (unadjusted OR = 20.96 vs 9.74); however, the interaction effect was not statistically significant. This effect differentiation trend was not seen for D949V (unadjusted OR = 10.38 males vs 8.13 females). DPYD*2A showed statistically significant associations with overall grade≥3 AEs within both Caucasian (P = .02) and male (P = .02) subgroups, but not within FOLFOX alone, FOLFOX+cetuximab, or female subgroups (Figure 2). D949V also showed statistically significant associations with overall grade≥3 AEs in patients treated with FOLFOX alone (P = .04), Caucasian (P = .01), and male (P = .04) subgroups, but not within the female or FOLFOX+cetuximab subgroups (Figure 2).
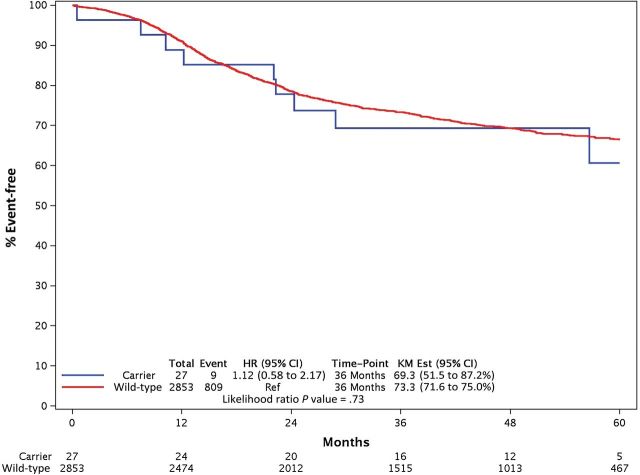
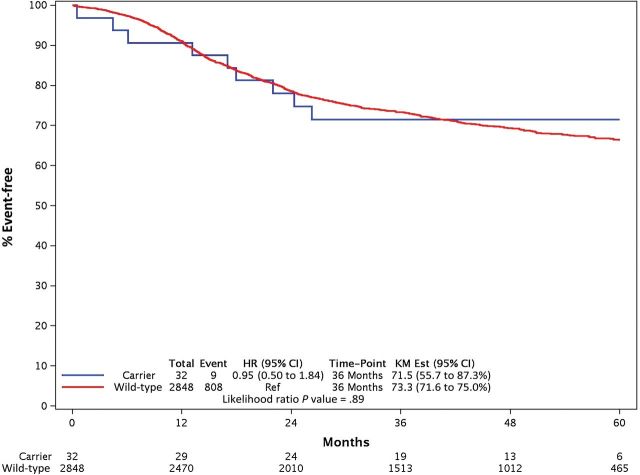
Because of its low frequency, a statistically significant association could not be demonstrated between I560S and either 5FU-AEs (OR = 2.02, 95% CI = 0.28 to 14.38, P = .48; n = 2) or overall (OR = 1.84, 95% CI = 0.19 to 17.70, P = .60; n = 3) grade≥3 AEs. No interaction effect was found between DPYD*2A and D949V on grade≥3 5FU-AEs (P = .98), nor on overall grade≥3 AEs (P = .98). None of the DPYD variants showed statistically significant associations with DFS (Figure 3).
Figure 3.
Comparisons of disease-free survival (DFS) between DPYD variants. A) DPYD*2A. B) D949V. Two-sided P values were calculated for univariate and multivariable associations between variant status and DFS using a Cox model, and distributions of DFS were estimated using the Kaplan-Meier method. CI = confidence interval; HR = hazards ratio; KM Est = Kaplan-Meier estimate.
Discussion
The pivotal role of DPD in 5-FU metabolism is clear and remains the only US Food and Drug Administration<en>approved pharmacogenomic marker for predicting toxicities to 5-FU-related chemotherapy (31). To date, three DPYD variants, DPYD*2A, D949V, and I560S, have been suggested as having potential importance in 5-FU toxicity based on deleterious effects on DPD activity (9–16,32–34). Because of conflicting evidence and their relatively low frequencies, meta-analyses of multiple studies have attempted to clarify the importance of the DPYD*2A and D949V variants (35,36). Unfortunately, numerous differences among studies (eg, genes and specific variants genotyped, types and stages of cancer, assessment of toxicity and pertinent clinical data, and treatment regimens used) greatly limit the power of this approach, highlighting the need for assessment in larger patient populations receiving comparable treatment regimens with uniform clinical data.
Utilizing NCCTG N0147 biospecimens, we were able to compare grade≥3 AE rates by genotype in a cohort of stage III colon cancer patients with well-characterized clinicopathological factors, standardized treatment, and uniformly assessed treatment-related AEs and outcomes. Our analysis identified statistically significant associations for both DPYD*2A and D949V variants with not only grade≥3 5FU-AEs but also overall grade≥3 AEs in the largest patient population published to date, confirming their importance in predicting toxicity to FOLFOX or FOLFIRI, alone or combined with cetuximab.
Our subgroup analysis also showed statistically significant associations between both DPYD*2A and D949V variants and grade≥3 5FU-AEs in patients treated with FOLFOX alone and FOLFOX+cetuximab, Caucasian patients, and both male and female patient populations. Interestingly, we observed a greater effect of DPYD*2A in males compared with females. It has been suggested that sex-gene interactions may lead to different effects of the same genetic variant in males and females, however our analysis displayed no statistically significant interaction between DPYD*2A genotype and sex on grade≥3 5FU-AE. Previously, Schwab et al. showed that 5/6 DPYD*2A patients with severe toxicity were men, but 6/7 DPYD*2A patients without severe toxicity were women (19), indicating a potential sex dependent effect. In our study, only three patients carrying DPYD*2A had no grade≥3 AEs, only one was female. It has been well established that women experience more severe toxicity than men while receiving 5-FU (37,38), which was also observed in our study. These findings suggest that the impact of sex on 5-FU toxicity should be considered when calculating DPYD variants’ predictive values for toxicity, as the proportion of toxic cases explained by DPYD variants may differ between men and women. Because of the increased incidence of grade≥3 toxicity and lower frequency of DPYD*2A in females observed in our study cohort, further studies in larger female populations with equal representation of DPYD*2A will be needed to validate the observed effect size difference between male and female DPYD*2A carriers.
The Clinical Pharmacogenetics Implementation Consortium recently provided recommendations for adjusting 5-FU dose in the presence of the three deleterious DPYD variants (39). However, genetic testing prior to 5-FU<en>based treatment remains to be fully utilized, in part, because of low sensitivity prediction values. In our study, genetic testing for DPYD*2A, D949V, and I560S resulted in the following values for grade≥3 5FU-AE prediction: sensitivity = 5.3%, specificity = 99.4%, positive predictive value = 81.8%, and negative predictive value = 68.0%. Low sensitivity and negative predictive values observed in this study may be attributed to the combination chemotherapy regimen, which may result in an additive effect on AE rates. Nevertheless, high specificity and positive predictive values emphasize the importance of the three DPYD variants as predictive toxicity markers.
Our study is not without limitations. Our cohort represents a highly selected group of stage III colon cancer patients with strict inclusion criteria, which may introduce unavoidable bias. Generalizability of our findings needs to be demonstrated in other stages and cancer types. Furthermore, heterogeneity in the overall proportion of toxicity explained by DPYD variants across different studies may be attributed to differences in the extent of examination of the DPYD gene. Variant databases have identified approximately 120 DPYD variants that alter the amino acid sequence (24). In this study, we focused on the DPYD variants displaying functionally deleterious effects on DPD activity from the current literature (16). Out of the 25 deleterious DPYD variants screened in our study cohort, only DPYD*2A and D949V were present in frequencies suitable to assess for associations with grade≥3 toxicity. Though I560S has been shown to cause a statistically significant decrease in DPD enzyme activity and has been identified in 5-FU toxic patients, we were unable to assess its statistical significance with grade≥3 5FU-AEs in this population because of low frequency. Additionally, 21 other functionally deleterious DPYD variants were absent from our study population, while P92A was identified in one patient with no grade≥3 toxicity.
Several of the more common DPYD variants have shown conflicting evidence regarding their effects. For example, previous functional assessment of c.85 T>C (C29R; DPYD*9) indicated a deleterious effect on enzyme activity (40), however recently published studies have shown increased (hyperactive) activity (15–16). Hyperactivity was also observed for c.1601 G>A (S534N; DPYD*4) (15), which was previously suggested to correlate with reduced DPD activity (14). Other variants such as c.1627 A>G (I543V; DPYD*5) and c.2194 G>A (V732I; DPYD*6) were also recently shown to result in DPD activity similar to wild type (15,16). Because of the lack of deleterious functional evidence, we elected to exclude the more common DPYD variants from the current study. Though functional analysis indicates that these variants individually do not decrease DPD enzyme activity, future studies are necessary to determine the potential compounding effects of multiple DPYD variants on protein structure and function. Successfully detecting statistically significant associations between functionally deleterious DPYD variants and increased incidence of grade≥3 5FU-AEs represents our first step to understanding their toxicity-related predictive value. Future analysis in this population will investigate the potential associations between combinations of common DPYD variants and grade≥3 AEs, which may provide a more comprehensive DPYD variant model for 5-FU toxicity prediction.
Funding
The study was supported by a National Cancer Institute Senior Scientist Award (K05CA-142885 to FAS), the North Central Cancer Treatment Group (NCCTG) Biospecimen Resource National Institutes of Health grant (CA-114740), and NIH grants CA-62164 and CA-116964 (RBD). The study was also supported, in part, by grants from the National Cancer Institute to the Alliance for Clinical Trials in Oncology (Monica M. Bertagnolli, MD, CA-31946), the Alliance Statistics and Data Center (DJS, CA-33601), and the Mayo Clinic Cancer Center (CA-15083). Support for correlative studies was also provided by unrestricted funds from Bristol-Myers Squibb, ImClone, Sanofi-aventis, and Pfizer.
Supplementary Material
Initial results from this study were recently presented as an abstract at the 2013 American Society of Clinical Oncology National Meeting (Gastrointestinal [Colorectal] Cancer Poster Discussion Session; Abstract #3510).
The study funders had no role in the design of the study, the collection, analysis, or interpretation of the data, the writing of the manuscript, nor the decision to submit the manuscript for publication.
The authors have no conflicts of interest.
The authors would like to thank Kangsheng Wang for her laboratory work with the Sequenom multiplex assay development and DNA sample alliqoting.
References
- 1. de Gramont A. Leucovorin and fluorouracil with or without oxaliplatin as first-line treatment in advanced colorectal cancer. J Clin Oncol. 2000;18(16):2938–2947. [DOI] [PubMed] [Google Scholar]
- 2. Thirion P, Michiels S, Pignon JP, et al. Modulation of fluorouracil by leucovorin in patients with advanced colorectal cancer: an updated meta-analysis. J Clin Oncol. 2004;22(18):3766–3775. [DOI] [PubMed] [Google Scholar]
- 3. Van Cutsem E, Köhne CH, Hitre E, et al. Cetuximab and chemotherapy as initial treatment for metastatic colorectal cancer. N Engl J Med. 2009;360(14):1408–1417. [DOI] [PubMed] [Google Scholar]
- 4. Goldberg RM, Sargent DJ, Morton RF, et al. A randomized controlled trial of fluorouracil plus leucovorin, irinotecan, and oxaliplatin combinations in patients with previously untreated metastatic colorectal cancer. J Clin Oncol. 2004;22(1):23–30. [DOI] [PubMed] [Google Scholar]
- 5. Diasio RB, Harris BE. Clinical pharmacology of 5-fluorouracil. Clin Pharmacokinet. 1989;16:215–237. [DOI] [PubMed] [Google Scholar]
- 6. McLeod HL, Papageorgio C, Watters JW. Using genetic variation to optimize cancer chemotherapy. Clin Adv Hematol Oncol. 2003;1(2):107–111. [PubMed] [Google Scholar]
- 7. Meinsma R, Fernandez-Salguero P, Van Kuilenburg AB, Van Gennip AH, Gonzalez FJ. Human polymorphism in drug metabolism: mutation in the dihydropyrimidine dehydrogenase gene results in exon skipping and thymine uracilurea. DNA Cell Biol. 1995;14(1):1–6. [DOI] [PubMed] [Google Scholar]
- 8. Wei X, McLeod HL, McMurrough J, Gonzalez FJ, Fernandez-Salguero P. Molecular basis of the human dihydropyrimidine dehydrogenase deficiency and 5-fluorouracil toxicity. J Clin Invest. 1996;98(3):610–615. [DOI] [PMC free article] [PubMed] [Google Scholar]
- 9. Johnson MR, Wang K, Diasio RB. Profound dihydropyrimidine dehydrogenase deficiency resulting from a novel compound heterozygote genotype. Clin Cancer Res. 2002;8(3):768–774. [PubMed] [Google Scholar]
- 10. Van Kuilenburg AB, Vreken P, Beex LV, et al. Heterozygosity for a point mutation in an invariant splice donor site of dihydropyrimidine dehydrogenase and severe 5-fluorouracil related toxicity. Eur J Cancer. 1997;33(13):2258–2264. [DOI] [PubMed] [Google Scholar]
- 11. Van Kuilenburg AB, Haasjes J, Richel DJ, et al. Clinical implications of dihydropyrimidine dehydrogenase (DPD) deficiency in patients with severe 5-fluorouracil-associated toxicity: identification of new mutations in the DPD gene. Clin Cancer Res. 2000;6(12):4705–4712. [PubMed] [Google Scholar]
- 12. Van Kuilenburg AB, Dobritzsch D, Meinsma R, et al. Novel disease-causing mutations in the dihydropyrimidine dehydrogenase gene interpreted by analysis of the three dimensional protein structure. Biochem J. 2002;364:157–163. [DOI] [PMC free article] [PubMed] [Google Scholar]
- 13. Mattison LK, Johnson MR, Diasio RB. A comparative analysis of translated dihydropyrimidine dehydrogenase cDNA, conservation of functional domains and relevance to genetic polymorphisms. Pharmacogenetics. 2002;12(2):133–144. [DOI] [PubMed] [Google Scholar]
- 14. Seck K, Riemer S, Kates R, et al. Analysis of the DPYD gene implicated in 5-fluorouracil catabolism in a cohort of Caucasian individuals. Clin Cancer Res. 2005;11(16):5866–5892. [DOI] [PubMed] [Google Scholar]
- 15. Offer SM, Wegner NJ, Fossum C, Wang K, Diasio RB. Phenotypic profiling of DPYD variations relevant to 5-fluorouracil sensitivity using real-time cellular analysis and in vitro measurement of enzyme activity. Cancer Res. 2013;73(6):1958–1968. [DOI] [PMC free article] [PubMed] [Google Scholar]
- 16. Offer SM, Fossum CC, Wegner NJ, Stufflesser AJ, Butterfield GL, Diasio RB. Comparative functional analysis of DPYD variants of potential clinical relevance to dihydropyrimidine dehydrogenase activity. Cancer Res. 2014;74(9):2545–2554. [DOI] [PMC free article] [PubMed] [Google Scholar]
- 17. Boisdron-Celle M, Remaud G, Traore S, et al. 5-fluorouracil-related severe toxicity: a comparison of different methods for the pretherapeutic detection of dihydropyrimidine dehydrogenase deficiency. Cancer Lett. 2007;249(2):271–282. [DOI] [PubMed] [Google Scholar]
- 18. Morel A, Boisdron-Celle M, Fey L, et al. Clinical relevance of different dihydropyrimidine dehydrogenase gene single nucleotide polymorphisms on 5-fluorouracil tolerance. Mol Cancer Ther. 2006;5(11):2895–2904. [DOI] [PubMed] [Google Scholar]
- 19. Schwab M, Zanger UM, Marx C, et al. Role of genetic and nongenetic factors for fluorouracil treatment-related severe toxicity: a prospective clinical trial by the German 5-FU Toxicity Study Group. J. Clin Oncol. 2008;26(13):2131–2138. [DOI] [PubMed] [Google Scholar]
- 20. Gross E, Busse B, Riemenschneider M, et al. Strong association of a common dihydropyrimidine dehydrogenase gene polymorphism with fluoropyrimidine-related toxicity in cancer patients. PLoS One. 2008;3(12):e4003. [DOI] [PMC free article] [PubMed] [Google Scholar]
- 21. Collie-Duguid ES, Etienne MC, Milano G, Mcleod HI. Known variant DPYD alleles do not explain DPD deficiency in cancer patients. Pharmacogenetics. 2000;10(3):217–223. [DOI] [PubMed] [Google Scholar]
- 22. Ridge SA, Sludden J, Brown O, et al. Dihydropyrimidine dehydrogenase pharmacogenetics in Caucasian subjects. Br J Clin Pharmacol. 1998;46(2): 151–156. [DOI] [PMC free article] [PubMed] [Google Scholar]
- 23. Braun MS, Richman SD, Thompson L, et al. Association of molecular markers with toxicity outcomes in a randomized trial of chemotherapy for advanced colorectal cancer: the FOCUS trial. J Clin Oncol. 2009;27(33):5519–5528. [DOI] [PubMed] [Google Scholar]
- 24. Database of Single Nucleotide Polymorphisms (dbSNP). Bethesda (MD): National Center for Biotechnology Information, National Library of Medicine. (dbSNP Build ID: human 138). Available at: http://www.ncbi.nlm.nih.gov/projects/SNP/snp_ref.cgi?showRare=on&chooseRs=coding&go=Go&locusId=1806. Accessed February 6, 2013.
- 25. Alberts SR, Sargent DJ, Nair S, et al. Effect of oxaliplatin, fluorouracil, and leucovorin with or without cetuximab on survival among patients with resected stage III colon cancer: a randomized trial. JAMA. 2012;307:1383–1393. [DOI] [PMC free article] [PubMed] [Google Scholar]
- 26. Sinicrope FA, Mahoney MR, Smyrk TC, et al. Prognostic impact of deficient DNA mismatch repair in patients with stage III colon cancer from a randomized trial of FOLFOX-based adjuvant chemotherapy. J Clin Oncol. 2013;10;31(29):3664–3672. [DOI] [PMC free article] [PubMed] [Google Scholar]
- 27. Altman DG. “Practical Statistics for Medical Research.” London: Chapman & Hall, 1991. [Google Scholar]
- 28. Rosner B. Fundamentals of biostatistics. 5 th edition. Pacific Grove, CA: Duxbury, 2000. [Google Scholar]
- 29. Kaplan EL, Meier P. Nonparametric Estimation from Incomplete Observations. J AmStat Assoc. 1958;53(282):457–481. [Google Scholar]
- 30. Cox DR. Regression Models and Life-Tables. J Royal Stat Soc. Series B (Methodological). 1972;34(2):187–220. [Google Scholar]
- 31. Table of US FDA-approved pharmacogenomic biomarkers in drug labels. Available at: http://www.fda.gov/drugs/scienceresearch/researchareas/pharmacogenetics/ucm083378.htm. Accessed January 14, 2014.
- 32. Loganayagam A, Arenas-Hernandez M, Fairbanks L, Ross P, Sanderson JD, Marinaki A. The contribution of deleterious DPYD gene sequence variants to fluoropyrimidine toxicity in British cancer patients. Cancer Chemother Pharmacol. 2010;65(2):403–406. [DOI] [PubMed] [Google Scholar]
- 33. Johnson MR, Hageboutros A, Wang K, High L, Smith JB, Diasio RB. Life-threatening toxicity in a dihydropyrimidine dehydrogenase-deficient patient after treatment with topical 5-fluorouracil. Clin Cancer Res. 1999;5(8):2006–2011. [PubMed] [Google Scholar]
- 34. Ezzeldin H, Johnson MR, Okamoto Y, Diasio R. Denaturing high performance liquid chromatography analysis of the DPYD gene in patients with lethal 5-fluorouracil toxicity. Clin Cancer Res. 2003;9(8):3021–3028. [PubMed] [Google Scholar]
- 35. Rosmarin D, Palles C, Church D, et al. Genetic markers of toxicity from capecitabine and other 5-fluorouracil-based regimens: investigation in the QUASAR2 study, systemic review and meta-analysis. J Clin Oncol. 2014;32(10):1031–1039. [DOI] [PMC free article] [PubMed] [Google Scholar]
- 36. Terrazzino S, Cargnin S, Del Re M, Danesi R, Canonico PL, Genazzani AA. DPYD IVS14+1G>A and 2846A>T genotyping for the prediction of severe fluoropyrimidine-related toxicity: a meta-analysis. Pharmacogenomics. 2013;14(11):1255–1272. [DOI] [PubMed] [Google Scholar]
- 37. Chansky K, Benedetti J, Macdonald JS. Differences in toxicity between men and women treated with 5-fluorouracil therapy for colorectal carcinoma. Cancer. 2005;103(6):1165–1171. [DOI] [PubMed] [Google Scholar]
- 38. Sloan JA, Goldberg RM, Sargent DJ, et al. Women experience greater toxicity with Fluorouracil-based chemotherapy for colorectal cancer. J Clin Oncol. 2002;20(6):1491–1498. [DOI] [PubMed] [Google Scholar]
- 39. Caudle KE, Thorn CF, Klein TE, et al. Clinical Pharmacogenetics Implementation Consortium Guidelines for Dihydropyrimidine Dehydrogenase Genotype and Fluoropyrimidine Dosing. Clin Pharmacol Ther. 2013;94(6):640–645. [DOI] [PMC free article] [PubMed] [Google Scholar]
- 40. Vreken P, Van Kuilenburg AB, Meinsma R, van Gennip AH. Dihydropyrimidine dehydrogenase deficiency: identification and expression of missense mutations C29R, R886H, and R235W. Hum Genet. 1997;101(3):333–338. [DOI] [PubMed] [Google Scholar]
Associated Data
This section collects any data citations, data availability statements, or supplementary materials included in this article.


