

Abstract
Although extrinsic factors, such as nutritional status, and some intrinsic genetic factors may modify susceptibility to developmental lead (Pb) poisoning, no studies have specifically examined the influence of genetic background on outcomes from Pb exposure. In this study, we used gene microarray profiling to identify Pb-responsive genes in rats of different genetic backgrounds, including inbred (Fischer 344 (F344)) and outbred (Long Evans (LE), Sprague Dawley (SD)) strains, to investigate the role that genetic variation may play in influencing outcomes from developmental Pb exposure. Male and female animals received either perinatal (gestation through lactation) or postnatal (birth through weaning) exposure to Pb in food (0, 250, or 750 ppm). RNA was extracted from the hippocampus at day 55 and hybridized to Affymetrix Rat Gene 1.0 ST Arrays. There were significant strain-specific effects of Pb on the hippocampal transcriptome with 978 transcripts differentially expressed in LE rats across all experimental groups, 269 transcripts differentially expressed in F344 rats, and only 179 transcripts differentially expressed in SD rats. These results were not due to strain-related differences in brain accumulation of Pb. Further, no genes were consistently differentially regulated in all experimental conditions. There was no set of “Pb toxicity” genes that are a molecular signature for Pb neurotoxicity that transcended sex, exposure condition, and strain. These results demonstrate the influence that strain and genetic background play in modifying the brain's response to developmental Pb exposure and may have relevance for better understanding the molecular underpinnings of the lack of a neurobehavioral signature in childhood Pb poisoning.
Keywords: lead, development, hippocampus, mRNA, strain differences
Despite major initiatives to reduce environmental sources of lead (Pb) exposure in the United States, elevated blood Pb levels in children persist as an important public health problem. This is particularly true for lower socioeconomic status children living in older housing stock containing deteriorating Pb paint and those children living in areas near industries that currently or previously produced or utilized Pb. Although children from all social and economic levels can be affected by Pb poisoning, children whose families are poor, live in old, poorly maintained housing, and are members of minority groups are at the highest risk of having harmful blood Pb levels (CDC, 1991). The current consensus from data accumulated over the last decade is that blood Pb levels at least as low as 5 μg/dl harm children in numerous ways (ACCLPP, 2012; Wheeler and Brown, 2013) and this new reference level has been adopted by the CDC as the level at which to identify children who have been exposed to Pb and who require case management (CDC, 2012).
A variety of intrinsic and extrinsic factors can modify an individual's sensitivity to a toxicant. Extrinsic factors that may modify susceptibility to Pb poisoning include conditions that enhance absorption of Pb such as anemia, low iron, calcium and zinc levels, and poor diet or malnutrition (Levander, 1979; Mahaffey, 1995). Intrinsic variables that can modify sensitivity to Pb (Cory-Slechta et al., 2000; Leggett, 1993) and that contribute to children being especially sensitive to the effects of Pb include: immaturity of the gastrointestinal tract such that there is a greater absorption of ingested Pb from the gastrointestinal tract of children than of adults (i.e., 30–50% of ingested Pb is absorbed from the gastrointestinal tract in children vs. ∼10–20% in adults) (Rabinowitz et al., 1974, 1980; Ziegler et al., 1978); retention characteristics of Pb such that more of the Pb absorbed by a child is retained in the body, compared with an adult, due to differences in distribution and elimination in immature versus adult systems (Leggett, 1993); blood-brain barrier immaturity, such that a greater proportion of systemically circulating Pb gains access to the brain in children, due to enhanced penetration through an immature blood brain barrier, compared with adults (Cory-Slechta et al., 2000; Leggett, 1993; Scheuplein et al., 2002) (blood-brain disruption by Pb may also enhance the accumulation of Pb in the brain (Finkelstein et al., 1998)); and, differential vulnerability of the developing nervous system to toxic effects of Pb due to high growth and metabolic demands as well as the utilization of Pb in place of calcium in numerous growth and maturation-related processes (Han et al., 2000; Leggett, 1993).
Genetic factors are other potential intrinsic influences that may modulate the sensitivity to Pb. At least three genes have been identified that can influence the accumulation and toxicokinetics of Pb in humans (Onalaja and Claudio, 2000). d-Aminolevulinic acid dehydratase (ALAD-1 and ALAD-2) has been implicated in susceptibility to Pb toxicity and genotype frequencies vary by geography and race (Onalaja and Claudio, 2000). Variants of the vitamin D receptor gene (VDR), involved in Ca2+ absorption through the gut, has been suggested to play a role in modifying Pb absorption (Schwartz et al., 2000a,b). The hemochromatosis gene (HFE), coding for the HFE protein that plays a role in regulation of iron uptake may influence the kinetics of Pb accumulation. Polymorphisms in HFE have been suggested to influence Pb toxicokinetics via iron metabolic pathways (Wright et al., 2004).
Genetic variations may influence the “sensitivity” to Pb intoxication in humans however, the possibility also exists that there might be intrinsic genetic components in the population that may influence the “outcomes” from developmental Pb exposure. Such differences, if they exist, could in part underlie the well-documented lack of a behavioral signature in children poisoned by Pb (i.e., different individuals with similar Pb exposures express different behavioral and cognitive impairments). Individual children with similar Pb exposures (determined by measure of ambient Pb in their environment and/or blood Pb levels) can have very different profiles of neuropsychological impairments (e.g., in areas of fine motor skills, language, attention, aspects of memory and learning, and executive functioning), even when all subjects are tested on the same battery of tests (Lidsky and Schneider, 2006). Although a number of factors could influence such diversity, part of this lack of behavioral signature in response to Pb toxicity could lie in differences in the way each child's brain responds to Pb, based on each individual's unique genetic makeup. Although attention has been paid to the influence of factors such as environment, socioeconomic status, and race on blood Pb levels (ex., Chung et al., 2001; Gellert et al., 1993) and how genetic factors may affect the brain's vulnerability to the neurotoxic effects of Pb (Onalaja and Claudio, 2000; Stewart et al., 2002), we are not aware of any studies that have specifically or systematically examined the influence of genetic background on outcomes from Pb exposure. In the present study, we have used gene profiling and microarray technology to identify Pb-responsive genes in rats of different genetic backgrounds, including inbred (Fischer 344 (F344)) and outbred (Long Evans (LE), Sprague Dawley (SD)) strains, to investigate the role that genetic variation may play in influencing outcomes from developmental Pb exposure.
Materials and Methods
Animals
The use of animals was in compliance with National Institutes of Health (NIH) guidelines for the care and use of laboratory animals and the study was approved by the Institutional Animal Care and Use Committee at Thomas Jefferson University. In the current study, 20 male and 20 female SD (Taconic) and 20 male and 20 female F344 (Harlan) were used. We previously reported an in-depth analysis of the effects of Pb exposure on the hippocampal transcriptome in LE rats (20 male and 20 female), employing the same exposure paradigms as used with the current cohorts and as described in this paper (see below) (Schneider et al., 2012a). Data from the LE strain will be reviewed in this paper for comparison with data obtained from the two strains currently used. Two Pb exposure paradigms were employed: perinatal exposure and postnatal exposure. For perinatally exposed animals, dams were fed Pb-containing food (RMH 1000 chow with or without added Pb acetate: 0, 250, or 750 ppm) for 2 weeks prior to breeding and remained on the same diet through weaning. Litters were culled to equal numbers of pups to standardize litter size, with an aim of having eight pups per litter. Equal numbers of males and females were maintained wherever possible and were exposed to Pb from gestation through lactation (i.e., to postnatal day 21). At weaning, rats were housed three to a standard cage (940 cm2) and had ad lib access to control chow (no added Pb) and water until postnatal day 55. For animals with only postnatal exposure to Pb, dams were fed control chow (no added Pb) during gestation and were then fed Pb-containing food (RMH 1000 chow with or without added Pb acetate: 0, 250, or 750 ppm) beginning at parturition and pups continued to receive the same exposure to Pb (0, 250, or 750 ppm) through their food until postnatal day 55. All animals were exposed to a 12 h:12 h light:dark cycle for the duration of the experiment and all animals were housed and handled in exactly the same manner during the study. Animals from different groups were euthanized at postnatal day 55 at the same time of day by decapitation and hippocampi were rapidly removed, flash frozen on dry ice and stored at −80°C until processed. No more than one male and one female from any litter were included in any experimental group.
Blood and brain samples were collected at the time of euthanasia and analyzed for Pb levels by graphite furnace atomic absorption with Zeeman background correction (ESA Labs, MA for blood Pb levels; University of Rochester School of Medicine for brain Pb levels). Brain Pb levels were obtained from cerebellum, a brain region known to be sensitive to Pb toxicity (Finkelstein et al., 1998; Lidsky and Schneider, 2003) and not used for any other analyses in this study. Differences in blood and brain Pb levels were analyzed within sex by two-way ANOVA, followed by post hoc analysis using Tukey's multiple comparison test.
RNA extraction and processing
Total RNA was extracted from the hippocampus using the Qiagen RNeasy Kit according to the manufacturer's protocol (Qiagen, Valencia, CA). Briefly, samples were homogenized and processed through spin columns using a QiaCube automated sample handling system (Qiagen). Quantity/quality and purity of RNA was assessed using a GE Nanovue spectrophotometer and an Agilent 2100 Bioanalyzer prior to further processing. Acceptance criteria for RNA extraction was a 260 nm/280 nm ratio of 2.0 by UV analysis and a RNA integrity number of >8.5 on the Bioanalyzer. RNA was amplified using the Affymetrix (Santa Clara, CA) HT one-cycle target labeling kit using 1 μg total RNA to make 15 μg cRNA. Labeled RNA samples were hybridized to Affymetrix Rat Gene 1.0 ST Arrays (80 microarrays used, with four biological replicates per experimental condition) using standard methods according to Affymetrix (performed at the Cancer Genomics Laboratory, Kimmel Cancer Center, Thomas Jefferson University). Hybridization spike-in control transcripts (i.e., BioB, BioC, BioDx, and CreX) were included in the hybridization experiments to verify that the in vitro transcription reaction, hybridization and washing steps were performed similarly across arrays. Arrays were scanned on an Affymetrix Gene Chip Scanner 3000 with autoloader using Command Console Software. Background correction and normalization were accomplished with Iterative Plier 16.
Microarray data normalization and filtering
Differentially expressed genes were identified using data normalization and statistical analysis performed using Partek Genomics Suite (Partek Inc., St Louis, MO). The standard Robust Multichip Average (RMA) approach was used to normalize raw gene expression data (Irizarry et al., 2003). Principal component analysis showed no outliers in the SD group and one outlier in the F344 group. We previously reported that there were no outlier samples in the LE data (Schneider et al., 2012a). The data were filtered to retain only the transcripts with a minimum log2 (normalized signal intensity) of 5 in at least one of the samples.
Sex-dependent differential gene expression in control animals
Normalized data for the control male and female SD and F344 animals were analyzed using Partek Genomics Suite, with a two-way mixed effects ANOVA with sex and scan date as parameters. The resulting p-values (0.05 cutoff) were corrected for multiple testing using a q-value approach to improve sensitivity of the analysis by estimating the proportion of nondifferentially regulated genes (Storey and Tibshirani, 2003). Fold changes in gene expression between male and female control animals within each strain were calculated from the ANOVA. These methods are similar to those used in our previous study using the LE strain (Schneider et al., 2012a).
Differential gene expression in response to lead exposure during different developmental periods
Normalized data from each strain were analyzed using a three-way mixed effects ANOVA (implemented in the Partek Genomics Suite) that considered the following two variables and their interactions as fixed effects: (1) sex (male or female), (2) lead exposure (0 ppm (control), 250 ppm, 750 ppm), and time of exposure (perinatal or postnatal) as merged parameters as the groups share the same controls. The data from the SD group were analyzed using a Method of Moments approach in the ANOVA model. In the F344 group, the microarray batch was considered as a random effect to account for variation across arrays. These data were analyzed using a Restricted Maximum Likelihood (REML) approach. Differentially expressed genes were identified based on statistically significant effects of Pb exposure, time of exposure, gender, or an interaction between these factors. A p-value threshold of 0.05 (chosen in order to improve the sensitivity for detecting differential expression with significant interactions between gender and treatment factors) was used to identify differentially expressed genes. Heat map visualizations of these and other data sets were constructed and hierarchical clustering using Complete Linkage and Pearson correlation similarity metric was performed using MeV software (Howe et al., 2010).
Gene sets affected by lead exposure
A list of differentially expressed genes derived from the ANOVA was filtered based on a minimum fold-change threshold of 1.3 (up- or downregulation) in response to Pb exposure in male or female animals. The filtered, differentially expressed genes were considered further based on pairwise post hoc analysis, yielding eight gene coexpression sets: male-250 ppm-perinatal versus male control (M250Pe), male-750 ppm-perinatal versus male control (M750Pe), male-250 ppm-postnatal versus male control (M250Po), male-750 ppm-postnatal versus male control (M750Po), female-250 ppm-perinatal versus female control (F250Pe), female-750 ppm-perinatal versus female control (F750Pe), female-250 ppm-postnatal versus female control (F250Po), female-750 ppm-postnatal versus female control (F750Po). Heat map visualizations of these data sets were constructed and hierarchical clustering using Complete Linkage and Pearson correlation similarity metric was performed using MeV software (Howe et al., 2010).
Pathway analyses
Gene sets affected by Pb exposure were analyzed for overrepresented biological pathways, networks, and other functional annotations using DAVID software (Huang da et al., 2009) as described by us previously (Schneider et al., 2012a). This software was used to identify biological functions, cellular processes, and molecular function annotations and analyze them using functional annotation clustering.
Quantitative RT-PCR
Real-time reverse transcription-polymerase chain reaction (RT-PCR) was used to confirm microarray results for a subset of biologically relevant, selected genes from those fulfilling the criteria of significant (p < 0.05) expression differences. Reverse transcription of 2 μg of each sample RNA was performed with Omniscript RT Kit (Qiagen) according to the manufacturer's protocol. Real-time PCR was performed on cDNA using the Roche LightCycler 480. A typical reaction took ∼1 h to complete and included a 10-min denaturation step at 95°C, followed by 45 cycles consisting of 95°C for 15 s (melting) and 60°C for 60 s (annealing). To confirm specificity of amplification the products were subjected to a melting curve analysis at the end of the final annealing period. PCR data were analyzed using the ΔΔCt method to calculate fold change of mRNA expression and PCR data for individual genes were compared with data from microarray studies. All samples were analyzed and run in triplicate. Comparative (correlation) analysis of fold-change outcomes from both qPCR data and microarray data were performed.
Results
Animal Characteristics
There were no significant differences in body weights (measured at the end of the study) between controls and Pb-exposed groups within sex and strain (Supplementary table S1). All control animals had blood and brain Pb levels at minimal levels or below detectable limits (Fig. 1). In perinatal and postnatal exposure groups, in both SD and F344 strains, mean blood Pb levels (BLLs) showed dose- and time-dependent increases (Fig. 1), similar to what we previously reported for similarly treated LE rats (Schneider et al., 2012a). There was an overall significant effect of strain and Pb exposure in males (F(2, 45) = 40.28, p < 0.0001 and F(2, 45) = 84.57, p < 0.0001, respectively) and females (F(2, 45) = 11.71, p < 0.0001 and F(2, 45) = 73.46, p < 0.0001, respectively). In males with the lowest level Pb exposure (i.e., 250 ppm), F344 rats had the highest BLLs in both perinatal and postnatal exposure groups (p < 0.01 vs. all other strains, Fig. 1). At this level of exposure, there were no significant differences in BLLs between LE and SD strains. Surprisingly, there was no difference in the BLLs between the three strains in males perinatally exposed to the higher level of Pb (750 ppm) and BLLs in LE and F344 animals in this group were actually lower than those in the 250 ppm exposure group. In postnatally exposed males, F344 animals in the 750-ppm exposure group again had higher BLLs versus comparably exposed LE and SD animals (p < 0.0001 vs. LE or SD; Fig. 1), with no differences observed between the LE and SD strains.
FIG. 1.

Blood and brain lead (Pb) levels in male and female Long Evans, Fischer 344 and Sprague Dawley rats. Rats received Pb exposure over different developmental periods (perinatal or postnatal) and received different levels of exposure (0 ppm = control animals/no Pb exposure; 250 or 750 ppm Pb acetate incorporated into chow). Blood and brain (cerebellum) samples were taken for analysis at time of euthanasia (postnatal day 55). *p < 0.05; **p < 0.01; ****p < 0.0001.
In females with perinatal or postnatal Pb exposure at the lower level, F344 animals had higher BLLs compared to the other strains and no differences in BLLs between LE and SD animals (perinatal: p < 0.0001 vs. LE and SD, and postnatal: p < 0.05 vs. LE and SD; Fig. 1). In females perinatally exposed to 750 ppm Pb, the lowest levels of Pb were found in F344 animals although differences in BLLs between the strains were not statistically significantly different. In females postnatally exposed to 750 ppm Pb, the highest BLLs were found in F344, but again, differences between strains were not statistically significantly different (Fig. 1).
There was an overall significant effect of both strain and lead exposure on brain Pb levels in males (F(2, 45) = 26.09, p < 0.0001 and F(2, 45) = 51.06, p < 0.0001) and females (F(2, 45) = 27.41, p < 0.0001 and F(2, 45) = 92.41, p < 0.0001). In males with the lower level Pb exposure, the pattern of brain Pb levels across strains was similar in perinatal and postnatal exposure groups, with F344 rats having the highest brain Pb levels although the differences between strains were not statistically significant. In animals with the higher level Pb exposure, strain differences in brain Pb levels were found only in animals with postnatal Pb exposure and F344 animals had significantly higher brain Pb levels than either of the other strains (Fig. 1). F344 females with 250 ppm Pb exposure showed higher brain Pb levels compared to the other strains only in the perinatal condition (Fig. 1). F344 females postnatally exposed to 750 ppm Pb had significantly higher brain Pb levels compared to the other strains (Fig. 1).
Hippocampal Gene Expression Profiles in Control Male and Female Rats from Different Strains
All gene expression data for this study have been deposited in the Gene Expression Omnibus (GEO) database (accession no.: GSE56666). The expression of 193 transcripts (112 unique genes of 125 annotated transcripts) was differentially regulated between control male and female F344 rats. Forty-nine transcripts (22 unique annotated genes) were downregulated in males compared with females whereas 144 transcripts (89 unique annotated genes) were upregulated in males. In SD rats, 110 transcripts (76 unique genes of 77 annotated transcripts) were differentially regulated between control male and female rats. Forty-two transcripts (19 unique annotated genes) were downregulated in males compared with females whereas 68 transcripts (57 unique annotated genes) were upregulated in males. In LE rats, the expression of 149 transcripts (54 unique genes of 54 annotated transcripts) was differentially regulated between control male and female rats, with 84 transcripts (14 unique annotated genes) downregulated in males compared with females and 65 transcripts (40 unique annotated genes) upregulated in males (Schneider et al., 2012a).
Strain-specific Effects of Pb on the Hippocampal Transcriptome
Previously, we reported a total of 978 transcripts (395 unique genes of 409 annotated transcripts) as being differentially expressed in LE rats across all experimental groups (multiple testing corrected q-value <0.3; fold change >1.3) (Schneider et al., 2012a). In addition, sex influenced the expression of 572 transcripts (213 unique genes of 223 annotated transcripts), Pb exposure influenced the expression of 717 transcripts (328 unique genes of 341 annotated transcripts), and the interaction of sex and Pb exposure influenced the expression of 104 transcripts (60 unique genes of 64 annotated transcripts) (Schneider et al., 2012a). Additionally, a set of 53 transcripts (33 unique genes of 36 annotated transcripts) showed significant differential response to all the parameters considered in the analysis, i.e., these genes showed overall differences related to sex and Pb exposure, as well as sex-dependent Pb exposure effects (Fig. 2).
FIG. 2.

Differential gene expression in response to lead exposure in three strains of rats. Distributions of differentially expressed transcripts in Long Evans, Fischer 344, and Sprague Dawley rats across the experimental factors considered in the statistical analysis. The circles for sex and lead/exposure indicate transcripts significantly affected by these factors independently. Lead/exposure is a combined factor of lead dose and exposure period. (Lead/exposure): sex indicates the interaction effect between these factors. The numbers of transcripts that show statistically significant differential expression due to one or more factors are indicated in the Venn diagram.
In contrast to what was observed in LE rats, a total of only 269 transcripts (88 unique genes of 115 annotated transcripts) were differentially expressed in F344 rats across all parameters (multiple testing corrected q-value <0.3; fold change >1.3). Pb exposure influenced the expression of 153 transcripts (65 unique genes of 65 annotated transcripts); sex influenced the expression of 82 transcripts (40 unique genes of 43 annotated transcripts); the interaction of sex and Pb exposure influenced the expression of 96 transcripts (27 unique genes of 27 annotated transcripts) (Fig. 2). A set of only four transcripts showed significant differential response to all the parameters considered in the analysis in F344 rats.
The SD rats showed the lowest number of differentially expressed transcripts of the three strains examined. In SD rats, a total of only 179 transcripts (74 unique genes of 86 annotated transcripts) were differentially expressed in SD rats across all parameters (multiple testing corrected q-value <0.3; fold change >1.3). Pb exposure influenced the expression of 123 transcripts (57 unique genes of 57 annotated transcripts); sex influenced the expression of 54 transcripts (23 unique genes of 24 annotated transcripts); the interaction of sex and Pb exposure influenced the expression of 33 transcripts (11 unique genes of 11 annotated transcripts) (Fig. 2). A set of four transcripts showed significant differential response to all the parameters considered in the analysis, i.e., these genes showed overall differences related to sex and Pb exposure, as well as sex-dependent Pb exposure effects. Results from both F344 and SD strains are in stark contrast to results previously described by us from LE rats, in which a much higher number of transcripts/unique genes were affected by Pb exposure (Fig. 2). As described previously for LE rats (Schneider et al., 2012a), few transcripts (11 total in LE, 20 total in SD) were affected by Pb exposure in a sex-dependent fashion without significant overall differences due to Pb exposure or sex, although a larger number of total transcripts (63 total) were affected by Pb exposure in a sex-dependent fashion in F344 rats.
Differentially Regulated Genes Following Pb Exposure in Males
Perinatal exposure
In perinatally exposed LE rats, the effect of Pb on gene expression was primarily upregulation. A greater number of transcripts affected in rats with 250 ppm exposure (328 transcripts, 137 unique genes of 140 annotated transcripts: 81 genes of 116 transcripts were downregulated and 56 genes of 212 transcripts were upregulated in response to Pb) than with 750 ppm exposure (262 transcripts, 131 unique genes of 134 annotated transcripts: 107 annotated genes of 159 transcripts were downregulated and only 24 annotated genes of 103 transcripts were upregulated in response to Pb exposure) (Schneider et al., 2012a) (Fig. 3).
FIG. 3.

Dose- and exposure period-dependent differential gene expression in male Long Evans, Fischer 344, and Sprague Dawley rats. Heat map visualization of transcript profiles show differential expression in perinatal and postnatal conditions both within and across strains. The vertical bars adjacent to the heat maps indicate the genes that show significant changes for each of the two lead dose levels studied. Up- and downregulated gene expression is represented by red and green, respectively in the heat maps. Fold-change calibration bar (−1 to 1) appears at the bottom of the figure.
In F344 rats, 61 transcripts (20 unique genes of 20 annotated transcripts) were differentially affected in 250 ppm perinatally exposed rats (15 genes of 27 transcripts downregulated and 5 genes of 34 transcripts upregulated) and 66 transcripts (22 unique genes of 22 annotated transcripts: 19 genes of 43 transcripts downregulated and 3 genes of 23 transcripts upregulated) were differentially affected in 750 ppm perinatally exposed rats. In both instances, the predominant effect was downregulation (Fig. 3).
In SD rats, 47 transcripts (29 unique genes of 29 annotated transcripts: 11 genes of 19 transcripts downregulated and 18 genes of 28 transcripts upregulated) were differentially affected in 250 ppm perinatally exposed rats and 37 transcripts (14 unique genes of 14 annotated transcripts: 7 genes of 12 transcripts downregulated and 7 genes of 25 transcripts upregulated) were differentially affected in 750 ppm perinatally exposed rats (Fig. 3).
In LE rats, key functionally relevant genes downregulated by Pb exposure in the 250 ppm group included Arc, Glycam1, Fos, JunB, Otx2, Btg2, Crx, Egr2, Dusp1, Npas4, Pla2g5, Folr1, Nr4a1, Ace, F5, and Tmem27 (Schneider et al., 2012a). Key functionally relevant genes downregulated by 250 ppm Pb exposure in F344 rats also included Npas4, Egr2, and Fos as well as Alox15, Alas2, Slc6a20, and Gch1. In SD rats, none of the key genes downregulated in the other strains were affected; key functionally relevant genes downregulated by 250 ppm Pb exposure in SD rats included Serpina3n, Pcdhb6, and Nqo2. Key functionally relevant genes downregulated by 750 ppm Pb exposure in LE rats included all of those mentioned above for the 250 ppm group and additional genes including A2m, Bmp2, Camk2d, Egr1, Crabp1, Ly6C, Mmp14, Plod2, Sik1, Slc39a8, Slc5a7, Trpv4, and Usp18 (Schneider et al., 2012a). In 750 ppm-exposed F344 rats, key functionally relevant genes downregulated by Pb included Alox15, Gch1, Lims2, and Gpd1. Key functionally relevant genes downregulated by 750 ppm Pb in SD rats included Serpina3n, Lrp1b, and Pcdhb6.
In LE rats, key genes upregulated by exposure to 250 ppm Pb included Gjc2, Cd48, Ddr2, Cav1, Epha8, Klk6, Nmur2, Gpd1, and Hif3a. Key genes upregulated by exposure to 750 ppm Pb included Nmur2, Gpd1, Gldn, and Prss12. None of these functionally relevant genes upregulated in LE rats were upregulated in the other strains. Key upregulated genes in F344 rats included Kcne3 (250 ppm) and Cyr61, and Apold (750 ppm); in SD rats: Egr1, Egr2, Fos, JunB, Nr4a1, Dusp1, Arc, Apold1, Fcrls, and Ephx2 (250 ppm) and Pcdh11x, Pcdga6, Fcrls, and Pcdhb8 (750 ppm).
Postnatal exposure
In postnatally exposed LE rats with 250 ppm exposure, 242 transcripts were differentially affected (101 unique genes of 108 annotated transcripts: 58 genes of 110 transcripts were downregulated and 43 genes of 132 transcripts were upregulated), and with 750 ppm exposure, 286 transcripts were differentially affected (126 unique genes of 129 annotated transcripts: 63 genes of 128 transcripts were downregulated and 63 genes of 158 transcripts were upregulated) (Schneider et al., 2012a). In F344 rats, 57 transcripts (22 unique genes of 22 annotated transcripts) were differentially affected in 250 ppm postnatally exposed rats (21 genes of 35 transcripts were downregulated and 1 gene of 22 transcripts was upregulated) and 94 transcripts (47 unique genes of 51 annotated transcripts) were differentially affected in 750 ppm postnatally exposed rats (21 genes of 35 transcripts were downregulated and 29 genes of 59 transcripts were upregulated). The effect was almost exclusively downregulation in the 250 ppm group and was predominantly upregulation in the 750 ppm group. In SD rats, 39 transcripts (19 unique genes of 19 annotated transcripts: 9 genes of 19 transcripts were downregulated and 10 genes of 20 transcripts were upregulated) were differentially affected in 250 ppm postnatally exposed rats and 55 transcripts (21 unique genes of 21 annotated transcripts: 9 genes of 20 transcripts were downregulated and 12 genes of 35 transcripts were upregulated) were differentially affected in 750 ppm postnatally exposed rats. Similar to what was observed in LE rats, there was a similar number of genes downregulated as upregulated by Pb exposure (Fig. 3).
In LE rats, key functionally relevant genes downregulated by Pb exposure included Arc, Fos, Dusp1, Egr2, Crx, Npas4, Nr4a1, JunB, Btg2, Cngb3, Esm1, Gpr139, Ly6C, Ncoa2, Sik1, Sox18, Trnt1, and Usp18 (Schneider et al., 2012a). With little overlap with LE animals, key functionally relevant genes downregulated by Pb exposure in F344 rats included Npas4, Alox15, Alas2, Slc6a20, Gch1, Anxa2, Ccl19, Tspan8, Foxp2, Fkbp5, Gstm2, Lims2, and Gpd1. In SD rats, none of the key genes downregulated in the other strains were affected; key functionally relevant genes downregulated by Pb exposure in SD rats included Serpina3n, Pcdhb6, and Aldh1a1. In LE rats, key genes upregulated included Gpd1, Ace, Efcab2, Ephx2, Folr1, F5, Rgs13, Sgk1, Sulf1, and Tgfb3. None of the functionally relevant genes upregulated in LE rats were upregulated in the other strains (except for Ephx2 in the SD 750 ppm group). Key upregulated genes in F344 rats included Camk2d, Cyr61, Ecel1, Rgs18, Gpr88, Prkg2, Sema3a, Junb, Cplx3, Btg2, Fos, Arc, Nr4a1, Npas4, Dusp1, and Apold1; in SD rats: Acer2, Fcrls, Dusp12, Pcdhb8, and Slc11a1.
Differentially Regulated Genes Following Pb Exposure in Females
Perinatal exposure
In LE females in the 250 ppm exposure group, 305 transcripts (78 unique genes of 81 annotated transcripts) were affected by Pb exposure: 51 genes of 84 transcripts were downregulated and 27 genes of 221 transcripts were upregulated. Females in the 750 ppm exposure group had 207 transcripts (100 unique genes of 105 annotated transcripts) affected by Pb exposure: 27 genes of 79 transcripts downregulated and 73 genes of 128 transcripts upregulated (Schneider et al., 2012a) (Fig. 4). Key functionally relevant genes downregulated in LE females included F5, Tmem27, Folr1, Otx2, Pla2g5, Glycam1, Ace, Npas4, Slc39a12, Dusp12, Ace, Acsm5, Bhmt, Ctsc, Ephx2, Htr3a, Npr3, Cyr61, Prps1, and Trhr. Key upregulated genes included Gpd1, Adamts4, Elovl1, Gpr126, Scn7a, Slc2a10, Cd163, Cdkn1a, Dio2, Fkbp5, Hif3a, Mt2A, P2rx7, Ret, Sgk1, Slc19a3, Slc5a7, Slco2a1, Sult1a1, Tsc22d3, Vamp5, and Ugt8 (Schneider et al., 2012a).
FIG. 4.
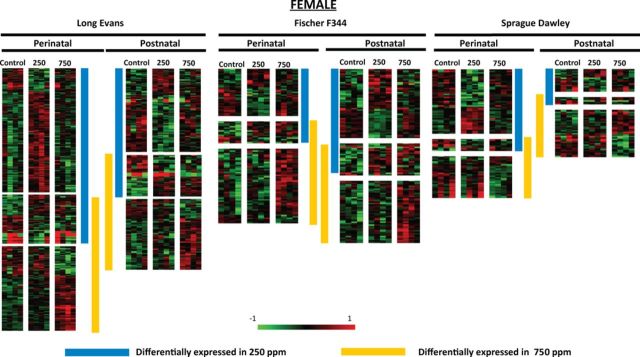
Dose- and exposure period-dependent differential gene expression in female Long Evans, Fischer 344, and Sprague Dawley rats. Heat map visualization of transcript profiles show differential expression in perinatal and postnatal conditions both within and across strains. The vertical bars adjacent to the heat maps indicate the genes that show significant changes for each of the two lead dose levels studied. Up- and downregulated gene expression is represented by red and green, respectively in the heat maps. Fold-change calibration bar (−1 to 1) appears at the bottom of the figure.
In the 250 ppm perinatal-exposure group in F344 rats, 51 transcripts (22 unique genes of 24 annotated transcripts) were affected by Pb exposure: 17 genes of 26 transcripts were downregulated and 7 genes of 25 transcripts were upregulated. Females in the 750 ppm perinatal-exposure group had 71 transcripts (10 unique genes of 10 annotated transcripts) affected by Pb exposure: 7 genes of 11 transcripts were downregulated and 3 genes of 60 transcripts were upregulated (Fig. 4). Key functionally relevant genes downregulated in F344 females included Glycam1, Slc6a20, Nr4a1, Anxa2, Serpinf1, Pdk4, Gpr88, Dusp1, and Gstm2. There were no functionally relevant upregulated genes in these animals.
In SD rats, 54 transcripts (27 unique genes of 27 annotated transcripts) were affected by Pb exposure in the 250 ppm group: 10 genes of 32 transcripts were downregulated and 17 genes of 22 transcripts were upregulated. Females in the 750 ppm perinatal-exposure group had 39 transcripts (20 unique genes of 21 annotated transcripts) affected by Pb exposure: 17 genes of 29 transcripts downregulated and 3 genes of 10 transcripts upregulated (Fig. 4). Key functionally relevant genes downregulated in SD females included Serpina3n, Nqo2, Pcdhb6, Selplg, Krt2, Lrp1b, Igh-6, Slc19a3, and Fmo2. Key upregulated genes in SD rats included Ephx2, Egr1, Egr2, Fos, Nr4a1, Arc, Dusp1, Apold1, Pdk4, Cyr61, Penk, and Fcrls.
Postnatal exposure
In LE female rats, the 250 ppm exposure group had 156 transcripts (48 unique genes of 52 annotated transcripts) affected by Pb exposure: 24 genes of 92 transcripts were downregulated and 24 genes of 64 transcripts were upregulated. In the 750 ppm exposure group, 151 transcripts (65 unique genes of 65 annotated transcripts) were affected by Pb exposure: 20 genes of 54 transcripts downregulated and 45 genes of 97 transcripts upregulated (Schneider et al., 2012a) (Fig. 4). Key functionally relevant genes downregulated in LE females included F5, Slc39a12, Tmem27, Klf9, Prokr2, Slc4a7, Ephx2, Nr4a1, Aph1b, Tnnt1, and Tnik. Key upregulated genes included Cyr61, Glycam1, Mgst1, Nkx6-2, P2rx7, Prps1, Gpd1, Ccr2, Col1a1, Nupr1, Slc13a3, Slc19a3, Slc5a7, Slco2a1, and Sult1a1 (Schneider et al., 2012a).
In F344 rats, 72 transcripts (20 unique genes of 20 annotated transcripts) were affected by Pb exposure in the 250 ppm exposure group: 16 genes of 27 transcripts were downregulated and 4 genes of 45 transcripts were upregulated. Females in the 750 ppm exposure group had 69 transcripts (27 unique genes of 28 annotated transcripts) affected by Pb exposure: 6 genes of 8 transcripts were downregulated and 21 genes of 61 transcripts were upregulated (Fig. 4). Key functionally relevant genes downregulated in F344 females exposed to 250 ppm Pb included Glycam1, Cldn1, Nr4a1, Apold1, Pdk4, Lypla2, Mmp14, Cdkn1a, and Slc6a20. There were no functionally relevant upregulated genes in these animals. In 750 ppm-exposed F344 rats, key functionally relevant genes downregulated included Glycam1, Slc6a20, Lypla2, and Anxa2. Key upregulated genes included Pdk4, Dusp1, Apold1, Npas4, Klf5, Prkg2, Cplx3, Rgs18, and Cbln4.
In SD rats, 22 transcripts (10 unique genes of 10 annotated transcripts) were affected by Pb exposure in the 250 ppm group: 5 genes of 12 transcripts were downregulated and 5 genes of 10 transcripts were upregulated. Females in the 750 ppm exposure group had 40 transcripts (12 unique genes of 12 annotated transcripts) affected by Pb exposure: 5 genes of 19 transcripts downregulated and 7 genes of 21 transcripts upregulated (Fig. 4). A key functionally relevant gene downregulated in 250 ppm SD females was Serpina3n. Key upregulated genes in SD rats included Eraf and Gstm2. In 750 ppm SD rats, Serpina3n and Pld6 were downregulated and Eraf and Ephx2 were upregulated. Across all groups, female SD rats with postnatal Pb exposures had the fewest differentially affected genes.
Biological Functions Affected by Pb Exposure
The enrichment of several functional groups based on strain, sex, and developmental timing of Pb exposure are shown in Table 1. Most notable is the enrichment of the process of “regulation of transcription” preferentially in males with postnatal exposures, with otherwise no common processes strongly modulated in males of all strains across the different developmental exposures. In female exposure groups, no common processes were strongly modulated in the different strains. Expression changes of important genes involved in selected functional groups are shown in Tables 2–4. In both males and females, within a given strain, we identified genes with unique strain-specific expression patterns (Tables 2 and 3, males and females respectively). In LE males, only the gene for cone-rod homeobox protein (Crx) was downregulated in all Pb exposure conditions (Table 2); in LE females the gene for solute carrier family 39 (zinc transporter) member 12 (Slc38a12) was downregulated in all Pb exposure groups (Table 3). In SD rats, the gene for serine (or cysteine) peptidase inhibitor, clade A, member 3N (Serpina3n) was downregulated in both males and females in all Pb exposure groups (Tables 2 and 3). No genes were affected in all exposure groups in either male or female F344 animals.
TABLE 1. Significantly Enriched Functional Groups of Regulated Genes in Males and Females of Different Strains with Perinatal or Postnatal Lead Exposures.
| Male | Female |
|---|---|
| Long Evans | |
| Perinatal | |
| Pattern binding | Organic substance transport |
| Acid secretion | Circulatory system process |
| Regulation of transcription | Pattern binding |
| Regulation of gene expression | Extracellular region |
| Regulation of tissue remodeling | |
| Postnatal | |
| Detection of stimulus | Peptide binding |
| Ion binding | Circulatory system process |
| Regulation of transcription | Membrane part |
| Regulation of gene expression | Immune response |
| Immune system development | |
| Extracellular matrix | |
| Fischer 344 | |
| Perinatal | |
| Detection of stimulus | Cognition |
| Neurological system process | Response to organic substance |
| Ion binding | Regulation of cell differentiation |
| Postnatal | |
| Regulation of transcription | Response to organic substance |
| Regulation of gene expression | Ion binding |
| Skeletal system development | |
| Sprague Dawley | |
| Perinatal | |
| Regulation of synaptic plasticity | Regulation of synaptic plasticity |
| Regulation of transcription | Regulation of system process |
| Regulation of transcription | |
| Cognition | |
| Postnatal | |
| Regulation of synaptic plasticity | Inflammatory response |
| Regulation of transcription | |
| Response to stimulus | |
TABLE 2. Lead-induced Changes in Regulation of Selected Genes with Unique Strain Expression in Males Displayed for Selected Functional Groups.
TABLE 4. Lead-induced Changes in Regulation of Selected Genes with Shared Expression Across at Least Two Strains Displayed for Selected Functional Groups.
TABLE 3. Lead-induced Changes in Regulation of Selected Genes with Unique Strain Expression in Females Displayed for Selected Functional Groups.
Lead-induced changes in gene expression shared across at least two strains are shown in Table 4. On no occasion were all three strains significantly affected for a single gene, regardless of Pb exposure level or developmental timing of the exposure. Of all differentially expressed genes, only three were identified as having significant changes in expression in both males and females within a strain following Pb exposure (i.e., Apold1, Cyr61, and Dusp1; Table 4).
Confirmation of Gene Expression Changes by Quantitative RT-PCR
Microarray results were verified by assessing the expression level of 14 genes selected across the different sexes and exposure groups, based on significant fold changes in the microarray data and potential biological relevance of the genes. Of the 58 comparisons of quantitative RT-PCR and microarray results, fold change and direction of change were similar in of 55 of 58 comparisons (Tables 5 and 6). Correlation analysis of fold change in the 58 comparisons generated an R2 = 0.8681.
TABLE 5. Microarray Validation Data (Males).
| 250Pe | 250Pe | 250Po | 250Po | 750Pe | 750Pe | 750Po | 750Po | |
|---|---|---|---|---|---|---|---|---|
| Validation | Array | Validation | Array | Validation | Array | Validation | Array | |
| LE | ||||||||
| Alox15 | −2.240 | −1.801 | −2.863 | −1.801 | ||||
| Arc | −2.030 | −1.387 | −2.206 | −1.371 | ||||
| Dusp1 | −1.737 | −1.577 | −1.767 | −1.315 | −2.223 | −1.315 | ||
| Egr2 | −1.950 | −1.393 | ||||||
| Fcrls | −6.549 | −2.896 | ||||||
| Fos | −1.788 | −1.519 | ||||||
| Junb | −1.858 | −1.403 | ||||||
| Npas4 | −1.947 | −1.623 | −2.529 | −1.623 | −2.079 | −1.623 | ||
| Nr4a1 | −1.795 | −1.522 | −1.826 | −1.498 | ||||
| Slc19a3 | 1.695 | 1.484 | 1.612 | 1.484 | ||||
| F344 | ||||||||
| Alox15 | −2.998 | −1.623 | −1.797 | −1.623 | ||||
| Arc | 1.637 | 1.519 | ||||||
| Dusp1 | −1.123 | 1.968 | 1.408 | 1.968 | ||||
| Egr2 | −1.225 | −1.307 | ||||||
| Fos | −1.220 | −1.306 | ||||||
| Npas4 | −2.394 | −1.811 | −1.084 | −1.811 | 2.043 | −1.811 | ||
| Nr4a1 | 2.057 | 1.562 | ||||||
| Slc19a3 | −1.327 | −1.348 | −1.578 | −1.348 | ||||
| SD | ||||||||
| Arc | 2.804 | 1.790 | ||||||
| Dusp1 | 2.325 | 1.778 | ||||||
| Egr2 | 1.679 | 1.378 | ||||||
| Fcrls | 2.374 | 1.956 | ||||||
| Fos | 1.699 | 1.490 | ||||||
| Junb | 1.876 | 1.382 | ||||||
| Nr4a1 | 2.017 | 1.568 | ||||||
250Pe = 250ppm lead acetate, perinatal exposure; 250Po = 250ppm lead acetate, postnatal exposure;
750Pe = 750ppm lead acetate, perinatal exposure; 750Po = 750ppm lead acetate, postnatal exposure.
Numbers reflect fold changes. Validation = PCR results.
Mismatched PCR:Array outcomes are highlighted in bold type.
TABLE 6. Microarray Validation Data (Females).
| F250Pe | F250Pe | F250Po | F250Po | F750Pe | F750Pe | F750Po | F750Po | |
|---|---|---|---|---|---|---|---|---|
| Validation | Array | Validation | Array | Validation | Array | Validation | Array | |
| LE | ||||||||
| Ephx2 | −1.960 | −1.430 | −1.807 | −1.430 | ||||
| Glycam1 | −4.269 | −1.447 | 1.542 | −1.447 | −2.172 | −1.447 | ||
| Slc19a3 | 2.283 | 1.997 | ||||||
| F344 | ||||||||
| Dusp1 | −1.641 | −1.311 | ||||||
| Glycam1 | −6.147 | −1.664 | −6.994 | −1.664 | −2.053 | −1.664 | ||
| Htra4 | −1.098 | −1.313 | ||||||
| Nr4a1 | −1.840 | −1.408 | ||||||
| Pdk4 | −1.688 | −1.367 | ||||||
| SD | ||||||||
| Dusp1 | 1.871 | 1.606 | ||||||
| Ephx2 | 2.739 | 1.309 | 3.422 | 1.309 | ||||
| Htra4 | −2.065 | −2.454 | ||||||
| Nr4a1 | 2.119 | 1.597 | ||||||
| Pdk4 | 1.646 | 1.404 | ||||||
| Slc19a3 | −1.438 | −1.390 | ||||||
250Pe = 250ppm lead acetate, perinatal exposure; 250Po = 250ppm lead acetate, postnatal exposure;
750Pe = 750ppm lead acetate, perinatal exposure; 750Po = 750ppm lead acetate, postnatal exposure.
Numbers reflect fold changes. Validation = PCR results.
Mismatched PCR:Array outcomes are highlighted in bold type.
Discussion
To the best of our knowledge, this is the first comparative gene expression profiling study examining the effects of developmental Pb exposure on the brain of animals of different genetic backgrounds. Previously, we described sex-based differences in gene expression patterns in the hippocampus (Schneider et al., 2011) and other effect modifiers (such as rearing environment, developmental window in which Pb exposure occurred, and the amount of Pb exposure) of Pb's influence on behavior and gene expression in the hippocampus and frontal cortex (Anderson et al., 2012a,b; Schneider et al., 2012b). The current findings add to this literature and demonstrate the influence that strain and genetic background play in further modifying the brain's response to developmental Pb exposure.
Genetic variation has long been discussed as an important variable in regard to susceptibility to metal toxicity (Gochfeld, 1997). Generally, factors influencing susceptibility to Pb toxicity have included variants and polymorphisms of genes related to uptake and absorption of Pb, the toxicokinetics of Pb, and the transport of Pb into the brain (Onalaja and Claudio, 2000). What has not been discussed is the role that genetic variability may play in the biological response of an individual brain to Pb. A variety of population studies of the neurobehavioral effects of Pb in children, and in particular, studies of Pb effects on IQ, have reported substantial variation in outcomes and have suggested that elevated BLLs in the sample population account for only a small amount of the explained variance (Koller et al., 2004). Although many of these studies attempt to assign greater importance to covariates such as maternal education, socioeconomic status, etc., the variance in these studies is at least in part attributable to genetic/phenotypic differences in the response to Pb between the individuals studied (Gochfeld, 1997). Epidemiological studies of the effects of lead on IQ have controlled for the effects of confounding variables on test performance (e.g., socioeconomic status, home environment) so that there is a very small probability that the association with decreased IQ test performance can be attributed to anything other than Pb exposure (Needleman and Bellinger, 2001). Although social and other influences are moderating effects on outcomes from developmental Pb exposure, individual genetic makeup as a moderator of the brain's response to Pb is generally not discussed. Although a number of studies have reported deficits in language development, reading ability, poor attention, and a variety of executive function deficits in Pb-exposed children, attempts to identify a neurobehavioral signature for children with elevated BLLs has been unsuccessful (Bellinger and Rappaport, 2002). Even with identical exposures, different children with unique genetic backgrounds will have brains that respond differently to that exposure. The current data showing the considerable differences between gene expression patterns in LE and SD rats, animals with almost identical brain Pb levels in all conditions, support this contention. We have also recently observed that in female rats with early postnatal Pb exposure, LE but not SD rats had significant deficits in short- and long-term retention of associative memory in a trace fear conditioning paradigm despite having identical blood Pb levels (Anderson et al., 2012). Thus, even if it were possible for all other factors to be equal (i.e., timing of exposure, duration of exposure, peak levels of exposure, dietary factors, etc.), we suggest that the way in which a particular child's brain will respond to Pb is a priori unpredictable due to individual genetic variability.
A variety of studies have previously reported strain differences in the response to Pb in regard to teratogenic effects of Pb (Gale, 1978) and development and maturation of physical features and reflexes (Mykkanen et al., 1980). However, little information exists on comparative effects of Pb on brain or behavior in different strains of rats or mice. In one study, the effects of acute (single) high level (50–200 mg/kg) exposure to Pb on motor behavior and brain catalase levels were explored in several inbred and outbred mouse strains. The effect of Pb on body weight was strain-dependent, with outbred Swiss mice showing greater resistance to effects on body weight compared to the other strains. There was also a significant increase in total brain catalase activity in Swiss mice compared to the other strains (Correa et al., 2004). Dearth et al. (2004) reported that the F344 strain was more sensitive to the detrimental effects of Pb, at least with regard to puberty related events, compared with SD rats. Fischer 344 female rats exposed perinatally to Pb, showed a decrease in puberty-related hormones and a subsequent delay in the onset of puberty. However, at the same dose, Pb had no detrimental effect on the acquisition of puberty in SD rats (Dearth et al., 2004). At all time points studied, from time of breeding through gestation, lactation, and weaning, F344 dams had higher blood Pb levels than SD dams despite the same dosing of the different strains. At 30 days of age, F344 offspring had significantly higher blood, brain, and liver Pb levels compared with SD offspring. Interestingly, doubling the dose of Pb given to the SD rats significantly increased their blood, brain, and liver Pb levels at least as high as reported in F344 animals that received the lower Pb exposure, yet there still were no puberty-related effects noted (Dearth et al., 2004). At the higher dose, SD dams and offspring retained more Pb than did the F344 dams yet outcomes were affected in the F344 strain but not in the SD strain.
In the present study, we also found that in several instances, in perinatal and postnatal exposures, 250 or 750 ppm dosing levels, and in males and females, F344 animals often had higher blood and brain Pb levels compared to the other strains. Despite this, LE animals were most broadly affected by Pb exposure across all conditions, with 978 transcripts differentially affected by Pb across all experimental groups compared to only 269 transcripts differentially expressed in F344 rats across all parameters. Even with almost identical blood and brain Pb levels in LE and SD rats across most conditions, a total of only 179 transcripts (vs. 978 transcripts in LE animals) were differentially expressed in SD rats across all parameters. As with the puberty-related events described earlier, strain-related differences in hippocampal gene expression profiles in response to Pb exposures cannot be explained simply by differences in toxicokinetics, or differential ability to store, metabolize, or excrete Pb. The strain-related differences observed in the response of the hippocampal transcritpome to Pb exposure seem rooted in fundamental interstrain differences in the response of the brain to Pb, determined by the unique genetic makeup of each strain studied. That is, intrinsic factors related to the genetic composition of the brains of these animals played a greater role in determining the degree of susceptibility or resistance to effects of Pb on hippocampal gene expression patterns than did potential influences of genetic diversity on Pb absorption and distribution to the brain.
The current study examined the response of the hippocampal transcriptome to developmental Pb exposure in one inbred strain (F344) and two outbred strains (LE and SD). In inbred strains in general, the underlying genetic variation has been deliberately narrowed and it has been suggested that highly inbred strains may not be appropriate models of susceptibility for human populations and may not even be comparable with outbred rodent strains (Gochfeld, 1997). The presumed advantage of using outbred strains is that there is more genetic diversity and thus they are potentially more clinically relevant models for toxicology, pharmacology, and behavioral research, and may more accurately reflect results that might be found in humans. Although the potential importance of multi-strain studies in toxicology, and in susceptibility studies in particular, have been discussed (Festing, 2010), our data highlight the importance of multi-strain studies for not only demonstrating differential sensitivities to Pb but for demonstrating different physiological/molecular outcomes based on genetic diversity.
We found no genes that were consistently differentially regulated in all experimental conditions. That is, there was no set of “Pb toxicity” genes that are a molecular signature for Pb neurotoxicity that transcends sex, exposure condition, and strain. In instances in which a gene was differentially regulated by Pb exposure in all three strains, the direction of change (i.e., upregulation or downregulation) varied by strain (ex., Arc (activity-regulated cytoskeleton-associated protein) was downregulated in LE 250 ppm perinatally exposed males, upregulated in comparably treated SD animals and not significantly altered in F344 animals). Early transcription factors Egr2 and Fos were the only genes differentially expressed in all three strains, but only in 250 ppm perinatally exposed males. Both of these genes were downregulated in LE and F344 animals but upregulated in SD rats. These data suggest that just as there appears to be no “neurobehavioral signature” to developmental Pb poisoning, there also does not appear to be a defining molecular signature, at least in terms of transcriptional regulation in the hippocampus.
In summary, perinatal or postnatal exposure to environmentally relevant levels of Pb produced significant changes in the expression of a variety of genes in the hippocampus and the number and type of genes differentially affected by Pb was dependent on the sex of than animals and more importantly, the strain or genetic background of the animals. The present results show that the response of the brain to a given Pb exposure is uniquely related to the strain of the animal and that differences in neurobehavioral outcomes from developmental Pb in different strains of animals is most likely related, in large part, to the moderating effect of genetic diversity on the effect of Pb on the transcriptome of hippocampus and likely other brain regions as well. These findings may have relevance for better understanding the molecular underpinnings of the lack of neurobehavioral signature in childhood Pb poisoning.
Supplementary Data
Supplementary data are available online at http://toxsci.oxfordjournals.org/.
Funding
National Institute of Environmental Health Sciences at the National Institutes of Health (RO1-ES015295).
Acknowledgments
The authors thank Dr R. Vadigepalli for help comments regarding the design of the study and the initial analysis of the data. The authors also thank D. Weston at the University of Rochester for performing the brain Pb analyses. This work is dedicated to the memories of Drs John F. Rosen and Vivian A. Cross.
References
- Advisory Committee on Childhood Lead Poisoning Prevention. Low Level Lead Exposure Harms Children: A Renewed Call for Primary Prevention. 2012. Available at: http://www.cdc.gov/nceh/lead/ACCLPP/Final_Document_030712.pdf. Accessed May 19, 2014. [Google Scholar]
- Anderson D. W., Mettil W., Kidd S. K., Schneider J. S. Effects of developmental lead exposure on associative learning and memory are modified by sex, developmental window of exposure and level of exposure. The Toxicologist. 2012b;126:131. (Abstract) [Google Scholar]
- Anderson D. W., Pothakos K., Schneider J. S. Sex and rearing condition modify the effects of perinatal lead exposure on learning and memory. Neurotoxicology. 2012a;33:985–995. doi: 10.1016/j.neuro.2012.04.016. [DOI] [PMC free article] [PubMed] [Google Scholar]
- Bellinger D., Rappaport L. Developmental assessment and interventions. In: Harvey B., editor. Managing Elevated Blood Lead Levels Among Young Children: Recommendations from the Advisory Committee on Childhood Lead Poisoning Prevention. US Department of Health and Human Services, PHS; 2002. pp. 77–95. [Google Scholar]
- Centers for Disease Control (US) Preventing lead poisoning in young children: A statement by the Centers for Disease Control. Atlanta: CDC; 1991. Available at: http://www.cdc.gov/nceh/lead/Publications/books/plpyc/contents.htm. Accessed May 19, 2014. [Google Scholar]
- Centers for Disease Control (US) Low Level Lead Exposure Harms Children: A Renewed Call of Primary Prevention. Atlanta: CDC; 2012. CDC Response to Advisory Committee on Childhood Lead Posioning Prevention Recommendations. Available at: http://www.cdc.gov/nceh/lead/ACCLPP/CDC_Response_Lead_Exposure_Recs.pdf. Accessed May 19, 2014. [Google Scholar]
- Chung E. K., Webb D., Clampet-Lundquist S., Campbell C. A comparison of elevated blood lead levels among children living in foster care, their siblings, and the general population. Pediatrics. 2001;107:E81. doi: 10.1542/peds.107.5.e81. [DOI] [PubMed] [Google Scholar]
- Correa M., Roig-Navarro A. F., Aragon C. M. Motor behavior and brain enzymatic changes after acute lead intoxication on different strains of mice. Life Sci. 2004;74:2009–2021. doi: 10.1016/j.lfs.2003.08.042. [DOI] [PubMed] [Google Scholar]
- Cory-Slechta D. A., Schaumberg H. H. Lead, Inorganic. In: Spencer P. S., Schaumberg H. H., Ludolf A. C., editors. Experimental and Clinical Neurotoxicology. 2. New York: Oxford University; 2000. pp. 708–720. [Google Scholar]
- Dearth R. K., Hiney J. K., Srivastava V., Les Dees W., Bratton G. R. Low level lead (Pb) exposure during gestation and lactation: Assessment of effects on pubertal development in Fischer 344 and Sprague-Dawley female rats. Life Sci. 2004;74:1139–1148. doi: 10.1016/j.lfs.2003.07.033. [DOI] [PubMed] [Google Scholar]
- Festing M. F. Inbred strains should replace outbred stocks in toxicology, safety testing, and drug development. Toxicol. Pathol. 2010;38:681–690. doi: 10.1177/0192623310373776. [DOI] [PubMed] [Google Scholar]
- Finkelstein Y., Markowitz M. E., Rosen J. F. Low-level lead-induced neurotoxicity in children: An update on central nervous system effects. Brain Res. Rev. 1998;27:168–176. doi: 10.1016/s0165-0173(98)00011-3. [DOI] [PubMed] [Google Scholar]
- Gale T. F. A variable embryotoxic response to lead in different strains of hamsters. Environ. Res. 1978;17:325–333. doi: 10.1016/0013-9351(78)90036-1. [DOI] [PubMed] [Google Scholar]
- Gellert G. A., Wagner G. A., Maxwell R. M., Moore D., Foster L. Lead poisoning among low-income children in Orange County, California. A need for regionally differentiated policy. JAMA. 1993;270:69–71. [PubMed] [Google Scholar]
- Gochfeld M. Factors influencing susceptibility to metals. Environ. Health Perspect. 1997;105(Suppl. 4):817–822. doi: 10.1289/ehp.97105s4817. [DOI] [PMC free article] [PubMed] [Google Scholar]
- Han S., Pfizenmaier D. H., Garcia E., Eguez M. L., Ling M., Kemp F. W., Bogden J. D. Effects of lead exposure before pregnancy and dietary calcium during pregnancy on fetal development and lead accumulation. Environ. Health Perspect. 2000;108:527–531. doi: 10.1289/ehp.00108527. [DOI] [PMC free article] [PubMed] [Google Scholar]
- Howe E., Holton K., Nair S., Schlauch D., Sinha R., Quankenbush J. MeV: MultiExperiment Viewer. In: Ochs M. F., Casagrande J. T., Davuluri R. V., editors. Biomedical Informatics for Cancer Research. New York, NY: Springer; 2010. pp. 267–277. [Google Scholar]
- Huang da W., Sherman B. T., Lempicki R. A. Systematic and integrative analysis of large gene lists using DAVID bioinformatics resources. Nat. Protoc. 2009;4:44–57. doi: 10.1038/nprot.2008.211. [DOI] [PubMed] [Google Scholar]
- Irizarry R. A., Hobbs B., Collin F., Beazer-Barclay Y. D., Antonellis K. J., Scherf U., Speed T. P. Exploration, normalization, and summaries of high density oligonucleotide array probe level data. Biostatistics. 2003;4:249–264. doi: 10.1093/biostatistics/4.2.249. [DOI] [PubMed] [Google Scholar]
- Koller K., Brown T., Spurgeon A., Levy L. Recent developments in low-level lead exposure and intellectual impairment in children. Environ. Health Perspect. 2004;112:987–994. doi: 10.1289/ehp.6941. [DOI] [PMC free article] [PubMed] [Google Scholar]
- Leggett R. W. An age-specific kinetic model of lead metabolism in humans. Environ. Health Perspect. 1993;101:598–616. doi: 10.1289/ehp.93101598. [DOI] [PMC free article] [PubMed] [Google Scholar]
- Levander O. A. Lead toxicity and nutritional deficiencies. Environ. Health Perspect. 1979;29:115–125. doi: 10.1289/ehp.7929115. [DOI] [PMC free article] [PubMed] [Google Scholar]
- Lidsky T. I., Schneider J. S. Lead neurotoxicity in children: Basic mechanisms and clinical correlates. Brain. 2003;126:5–19. doi: 10.1093/brain/awg014. [DOI] [PubMed] [Google Scholar]
- Lidsky T. I., Schneider J. S. Adverse effects of childhood lead poisoning: The clinical neuropsychological perspective. Environ. Res. 2006;100:284–293. doi: 10.1016/j.envres.2005.03.002. [DOI] [PubMed] [Google Scholar]
- Mahaffey K. R. Nutrition and lead: Strategies for public health. Environ. Health Perspect. 1995;103(Suppl. 6):191–196. doi: 10.1289/ehp.95103s6191. [DOI] [PMC free article] [PubMed] [Google Scholar]
- Mykkanen H. M., Dickerson J. W., Lancaster M. Strain differences in lead intoxication in rats. Toxicol. Appl. Pharmacol. 1980;52:414–421. doi: 10.1016/0041-008x(80)90336-1. [DOI] [PubMed] [Google Scholar]
- Needleman H. L., Bellinger D. Studies of lead exposure and the developing central nervous system: A reply to Kaufman. Arch. Clin. Neuropsychol. 2001;16:359–374. [PubMed] [Google Scholar]
- Onalaja A. O., Claudio L. Genetic susceptibility to lead poisoning. Environ. Health Perspect. 2000;108(Suppl. 1):23–28. doi: 10.1289/ehp.00108s123. [DOI] [PMC free article] [PubMed] [Google Scholar]
- Rabinowitz M. B., Kopple J. D., Wetherill G. W. Effect of food intake and fasting on gastrointestinal lead absorption in humans. Am. J. Clin. Nutr. 1980;33:1784–1788. doi: 10.1093/ajcn/33.8.1784. [DOI] [PubMed] [Google Scholar]
- Rabinowitz M., Wetherill G. W., Kopple J. D. Studies of human lead metabolism by use of stable isotope tracers. Environ. Health Perspect. 1974;7:145–153. doi: 10.1289/ehp.747145. [DOI] [PMC free article] [PubMed] [Google Scholar]
- Scheuplein R., Charnley G., Dourson M. Differential sensitivity of children and adults to chemical toxicity. I. Biological basis. Regul. Toxicol. Pharmacol. 2002;35:429–447. doi: 10.1006/rtph.2002.1558. [DOI] [PubMed] [Google Scholar]
- Schneider J. S., Anderson D. W., Sonnenahalli H., Vadigepalli R. Sex-based differences in gene expression in hippocampus following postnatal lead exposure. Toxicol. Appl. Pharmacol. 2011;256:179–190. doi: 10.1016/j.taap.2011.08.008. [DOI] [PMC free article] [PubMed] [Google Scholar]
- Schneider J. S., Anderson D. W., Talsania K., Mettil W., Vadigepalli R. Effects of developmental lead exposure on the hippocampal transcriptome: Influences of sex, developmental period, and lead exposure level. Toxicol. Sci. 2012a;129:108–125. doi: 10.1093/toxsci/kfs189. [DOI] [PMC free article] [PubMed] [Google Scholar]
- Schneider J. S., Mettil W., Anderson D. W. Differential effect of postnatal lead exposure on gene expression in the hippocampus and frontal cortex. J. Mol. Neurosci. 2012b;47:76–88. doi: 10.1007/s12031-011-9686-0. [DOI] [PMC free article] [PubMed] [Google Scholar]
- Schwartz B. S., Lee B. K., Lee G. S., Stewart W. F., Simon D., Kelsey K., Todd A. C. Associations of blood lead, dimercaptosuccinic acid-chelatable lead, and tibia lead with polymorphisms in the vitamin D receptor and [delta]-aminolevulinic acid dehydratase genes. Environ. Health Perspect. 2000a;108:949–954. doi: 10.1289/ehp.00108949. [DOI] [PMC free article] [PubMed] [Google Scholar]
- Schwartz B. S., Stewart W. F., Kelsey K. T., Simon D., Park S., Links J. M., Todd A. C. Associations of tibial lead levels with BsmI polymorphisms in the vitamin D receptor in former organolead manufacturing workers. Environ. Health Perspect. 2000b;108:199–203. doi: 10.1289/ehp.00108199. [DOI] [PMC free article] [PubMed] [Google Scholar]
- Stewart W. F., Schwartz B. S., Simon D., Kelsey K., Todd A. C. ApoE genotype, past adult lead exposure, and neurobehavioral function. Environ. Health Perspect. 2002;110:501–505. doi: 10.1289/ehp.02110501. [DOI] [PMC free article] [PubMed] [Google Scholar]
- Storey J. D., Tibshirani R. Statistical significance for genomewide studies. Proc. Natl. Acad. Sci. U.S.A. 2003;100:9440–9445. doi: 10.1073/pnas.1530509100. [DOI] [PMC free article] [PubMed] [Google Scholar]
- Wheeler W., Brown M. J. Blood Lead Levels in Children Aged 1–5 Years — United States, 1999–2010. Centers for Disease Control and Prevention; 2013. pp. 245–248. [Google Scholar]
- Wright R. O., Silverman E. K., Schwartz J., Tsaih S. W., Senter J., Sparrow D., Weiss S. T., Aro A., Hu H. Association between hemochromatosis genotype and lead exposure among elderly men: The normative aging study. Environ. Health Perspect. 2004;112:746–750. doi: 10.1289/ehp.6581. [DOI] [PMC free article] [PubMed] [Google Scholar]
- Ziegler E. E., Edwards B. B., Jensen R. L., Mahaffey K. R., Fomon S. J. Absorption and retention of lead by infants. Pediatr. Res. 1978;12:29–34. doi: 10.1203/00006450-197801000-00008. [DOI] [PubMed] [Google Scholar]