

Summary
This observational study of 5921 participants (3593 cases and 2328 controls) discovered a previously unidentified, highly statistically significant risk variant for colorectal cancer in Ashkenazi Jews and Europeans [rs35509282; OR per risk allele (T) = 1.53; P value = 8.2 × 10⁻⁹].
Abstract
Only a fraction of colorectal cancer heritability is explained by known risk-conferring genetic variation. This study was designed to identify novel risk alleles in Europeans. We conducted a genome-wide association study (GWAS) meta-analysis of colorectal cancer in participants from a population-based case–control study in Israel (n = 1616 cases, 1329 controls) and a consortium study from the Colon Cancer Family Registry (n = 1977 cases, 999 controls). We used a two-stage (discovery–replication) GWAS design, followed by a joint meta-analysis. A combined analysis identified a novel susceptibility locus that reached genome-wide significance on chromosome 4q32.2 [rs35509282, risk allele = A (minor allele frequency = 0.09); odds ratio (OR) per risk allele = 1.53; P value = 8.2 × 10⁻⁹; nearest gene = FSTL5]. The direction of the association was consistent across studies. In addition, we confirmed that 14 of 29 previously identified susceptibility variants were significantly associated with risk of colorectal cancer in this study. Genetic variation on chromosome 4q32.2 is significantly associated with risk of colorectal cancer in Ashkenazi Jews and Europeans in this study.
Introduction
Colorectal cancer (CRC) remains a major source of cancer morbidity and mortality worldwide. CRC ranks third with respect to age-adjusted incidence among all cancer sites and second in terms of age-adjusted mortality in the USA (1). Also, it is the fourth most common cause of cancer death worldwide (2). Nearly 60% of CRC cases occur in developed regions of the world, including high-risk groups such as individuals of Ashkenazi Jewish descent. Comparing population subgroups from Israel, age-standardized incidence among Ashkenazi (European or American born) Jews is 41.9 per 100 000, strikingly higher than Sephardi (Asian or African born) Jewish, Israel-born Jewish and Israeli non-Jewish rates (25.5, 32.8 and 10.1 per 100 000, respectively) (3).
In addition to the well-characterized epidemiologic risk factors for CRC, including age, ethnicity, heavy alcohol use, high-fat diet, physical inactivity and obesity (4), inherited susceptibility is a major contributor to CRC risk and may help to explain the high incidence experienced by founder populations such as Ashkenazi Jews. However, only 2–6% of all CRC cases occur as part of well-characterized familial cancer syndromes driven by rare, highly penetrant, germline mutations (5–7).
Traditional genome-wide association studies (GWAS) leverage linkage disequilibrium (LD) between haplotype-tagging and/or imputed single nucleotide polymorphisms (SNPs) and small insertions or deletions (indels) on a genotyping array with the goal of identifying associations between common genetic variants [minor allele frequency (MAF) ≥ 5%] and binary disease status or quantitative traits (8). Several GWAS of CRC risk have identified over 20 low-penetrance susceptibility variants (9–22). Some risk variants have been identified in genes encoding proteins active in pathways with existing links to CRC pathogenesis, such as the Wnt and transforming growth factor-beta (TGF-β) signaling pathways (23). However, these studies have also identified a number of variants in novel genetic regions. Although the functional significance and clinical relevance of most tagged loci remain largely undetermined, several critical genes and regulatory elements have been well defined (Supplementary Table 1, available at Carcinogenesis Online). Similar to GWAS results from other complex diseases, the variants identified thus far explain only a small proportion of CRC’s heritability and have limited utility for clinical risk prediction (24–27). Although some have argued that many rare variants with larger effects are the primary genetic drivers of complex diseases (28), it is probable that variants across the full ranges of frequency and effect size contribute to disease risk (8,24,29,30). Given the large number of risk variants successfully identified for breast and prostate cancer, we hypothesized that additional common, low penetrance susceptibility variants for CRC remain. Detecting these variants requires larger sample sizes or studies in specialized samples. Comprehensively characterizing this risk-conferring variation could offer new insights into the complex biology of CRC.
With the goal of identifying novel susceptibility variants, we conducted a GWAS meta-analysis of case–control studies of CRC in two samples: Ashkenazi Jews from the Molecular Epidemiology of Colorectal Cancer (MECC) study and non-Hispanic whites from the Colon Cancer Family Registry (CFR). Further, we replicated the strongest findings of genetic association from the meta-analysis in an independent set of Israeli MECC cases and controls. Finally, we conducted a combined meta-analysis of the three contributing sample sets to maximize our power for detecting associated genetic variants and to fine map a genome-wide significant finding.
Materials and methods
Study samples
The discovery meta-analysis was conducted using germline DNA from two separate case–control studies, the Molecular Epidemiology of CRC (MECC) study and the CFR. The replication dataset consisted of an independent set of MECC participants. Informed consent was obtained according to Institutional Review Board-approved protocols at Carmel Medical Center and the University of Southern California (HS-12-00324, HS-12-00672 and HS-08-00378). Demographic and clinical characteristics of participants with high-quality genotype data for both the discovery and replication study phases are summarized in Table I.
Table I.
Demographic and clinical characteristics of genotyped participants after QC from MECC (n discovery = 983; n replication = 1962) and CFR (n discovery = 2977) case–control studies
| Discovery meta-analysis | Replication | |||||
|---|---|---|---|---|---|---|
| MECC Illumina Omni2.5M | CFR—Illumina Human 1M, 1M-Duo, and Omni1-Quad | MECC Affymetrix Axiom 1.3M | ||||
| Cases (n = 485) | Controls (n = 498) | Cases (n = 1977) | Controls (n = 999) | Cases (n = 1131) | Controls (n = 831) | |
| Age [mean (SD)] | 72.0 (10.1) | 72.3 (10.2) | 52.7 (11.1) | 59.9 (11.0) | 71.3 (11.0) | 73.3 (11.1) |
| Sex (%) | ||||||
| Male | 265 (54.6) | 264 (53.0) | 983 (49.7) | 478 (47.8) | 563 (49.8) | 420 (50.5) |
| Female | 220 (45.4) | 234 (47.0) | 994 (50.3) | 521 (52.2) | 568 (50.2) | 411 (49.5) |
| Ethnicity (%) | ||||||
| Ashkenazi | 476 (98.1) | 496 (99.6) | 0 | 0 | 1129 (99.8) | 807 (97.1) |
| Sephardi | 0 | 0 | 0 | 0 | 0 | 9 (1.1) |
| Ashkenazi/non-Jewish | 0 | 0 | 0 | 0 | 0 | 1 (0.1) |
| Ashkenazi/Sephardi | 2 (0.4) | 2 (0.4) | 0 | 0 | 1 (0.1) | 11 (1.3) |
| Non-Jewish, Non-Arab | 6 (1.2) | 0 | 0 | 0 | 0 | 0 |
| Jewish, unknown | 1 (0.2) | 0 | 1 (0.1) | 3 (0.4) | ||
| Non-Hispanic white | 0 | 0 | 1977 (66.4) | 999 (33.6) | 0 | 0 |
| 1st degree relative with CRC (%) | ||||||
| Yes | 65 (13.4) | 41 (8.2) | — | — | 135 (11.9) | 71 (8.5) |
| No | 419 (86.4) | 457 (91.8) | — | — | 985 (87.1) | 757 (91.1) |
| Missing | 1 (0.2) | 0 | — | — | 11 (1.0) | 3 (0.4) |
| Cancer site (%) | ||||||
| Left colon | 273 (56.3) | — | 628 (31.8) | — | 408 (36.1) | — |
| Right colon | 178 (36.7) | — | 577 (29.2) | — | 340 (30.1) | — |
| Colon (not otherwise specified) | 5 (1.0) | — | 43 (2.2) | — | 45 (4.0) | |
| Rectum | 29 (6.0) | — | 729 (36.9) | — | 296 (26.2) | — |
| Other | 0 | — | 0 | — | 1 (0.1) | — |
| Stage at diagnosis (%) | ||||||
| I | 87 (17.9) | — | 442 (22.4) | — | 161 (14.2) | — |
| II | 184 (37.9) | — | 501 (25.3) | — | 223 (19.7) | — |
| III | 96 (19.8) | — | 689 (34.9) | — | 197 (17.4) | — |
| IV | 91 (18.8) | — | 166 (8,4) | — | 90 (8.0) | — |
| Missing | 27 (5.6) | — | 179 (9.1) | — | 470 (41.6) | — |
| MSI (%) | ||||||
| Stable | 393 (81.0) | — | 1541 (78.0) | — | 415 (36.7) | — |
| Low | 92 (19.0) | — | 178 (9.0) | — | 171 (15.1) | — |
| High | 0 | — | 14 (0.7) | — | 175 (15.5) | — |
| Missing | 0 | — | 244 (12.3) | — | 370 (32.7) | — |
Molecular Epidemiology of Colorectal Cancer Study
MECC is a population-based, case–control study of pathologically confirmed, incident cases of CRC recruited from a geographically defined region of northern Israel (31). Participant recruitment began in 1998 and remains ongoing. Individually-matched controls with no prior history of CRC are selected from the source population that gave rise to cases using the Clalit Health Services database. Matching factors include age, sex, Jewish ethnicity (Jew versus non-Jew) and primary clinic site. Subjects are interviewed to obtain demographic and clinical information, family history and dietary habits. Biospecimens including blood, paraffin blocks and snap-frozen tumors are also collected.
The discovery phase of this GWAS meta-analysis leverages data on 485 Ashkenazi Jewish (AJ) cases and 498 AJ controls from MECC. Cases were selected for genotyping according to a specific stage at diagnosis distribution for a separate GWAS study of stage and prognosis. Further, the selection was enriched for colon (as opposed to rectal) cancer and excluded participants with microsatellite instable (MSI-H) tumors. The replication stage utilizes MECC genotypes from 1131 AJ cases and 831 AJ controls. Replication stage cases were unselected for cancer site, stage or MSI (Table I).
Colon Cancer Family Registry
The Colon CFR is a consortium of six centers across North America and Australia, organized to create a comprehensive resource for clinical and epidemiologic studies of CRC (19,32). The six centers include the University of Southern California, Fred Hutchinson Cancer Research Center, Mayo Clinic, Cancer Care Ontario, University of Hawaii Cancer Center and the University of Melbourne. The registry contains family history clinical history, and risk factor data on ~37 000 subjects (including nearly 10 000 probands and 27 000 affected or unaffected relatives and unrelated controls) (32). Phase I (1998–2002) focused on recruitment of incident cases of CRC via population-based cancer registries or clinical centers as well as general population or proband-identified controls. Phase II recruitment (2002–2007) included incident probands with CRC diagnosed below 50 years of age and additional clinic-identified families. As described previously, those selected from Phase I for the study’s initial genome-wide scan (Set 1) were population-based cases and age- and sex-matched controls from the following three centers: Fred Hutchinson Cancer Research Center, Cancer Care Ontario, and Melbourne (33). Phase II participants selected for genotyping (Set 2) included population-based cases from all six study sites and same-generation family controls. Only Phase II cases are included in this analysis; family-based controls were excluded. Case selection for genotyping from both Sets 1 and 2 was enriched for age at onset before 50 years or a family history of CRC. All subjects self-reported as being non-Hispanic white, and this was verified using genotype data. Further, controls reported no family or personal CRC history. In total, the discovery GWAS meta-analysis uses 1977 population-based cases from Phases I (n = 1180) and II (n = 797) and 999 age- and sex-matched controls from Phase I (Table I).
Genotyping and quality control
Germline DNA was extracted from peripheral blood samples for both MECC and CFR participants. MECC DNA was genotyped in two batches using the Illumina HumanOmni 2.5–8 BeadChip, which measures nearly 2.4 million SNPs and indels. Batch 1 (414 cases and 155 controls) was run at Case Western Reserve University for the purpose of a GWAS study of stage and prognosis, and batch 2 (104 cases and 376 controls) was run at the University of Michigan to create a balanced design of cases and matched controls. Colon CFR samples were genotyped across three platforms based on chip availability: the Illumina Human1M or Human1M-Duo (CFR Set 1) and the Illumina HumanOmni1-Quad (CFR Set 2), each containing ~1.2 million SNPs and indels.
MECC genotype data were cleaned based on quality control (QC) metrics at the individual subject and SNP levels (Figure 1). Samples with >5% missing genotypes, sex mismatches (between self-reported and genotypic predicted sex), duplicate samples and those with excess homozygosity were identified and subsequently removed. SNPs with <95% call rate were excluded, and those inconsistent with Hardy–Weinberg equilibrium in controls were flagged for review but not removed. Principal components (PC) analysis was conducted on ~100 000 randomly selected markers (after LD-pruning) using the pcaMethods Bioconductor package (34) in R to identify ethnic outliers. These same principal components were retained to adjust for confounding due to population stratification. Pairwise plots of principal components 1–3 on the final analysis dataset are in Supplementary Figure 1, available at Carcinogenesis Online.
Fig. 1.

Quality control and filtering pipeline for MECC discovery samples before imputation.
CFR genotype data were cleaned using comparable parameters, and the methods applied for CFR Set 1 genotypes have been detailed elsewhere (33). Briefly, the QC criteria excluded samples based on call rate, sex mismatches, unintended duplicates, lack of concordance with previous genotype data and unanticipated genotype concordance or identity-by-descent with another sample. Principal components analysis based on a panel of ancestry information markers was conducted using Eigenstrat (35), followed by comparison with HapMap II CEU participants from Utah, to identify and exclude ethnic outliers. SNP-level exclusions were made for markers with more than two alleles, no ‘rs’ identification number, poor genotype concordance in the same individuals across platforms and low call rate (<90%). Pairwise plots of PCs 1–4 on the final analysis dataset are in Supplementary Figure 2, available at Carcinogenesis Online.
An independent set of MECC germline DNA samples were genotyped as part of the National Cancer Institute-sponsored Colorectal Transdisciplinary (CORECT) Study and served as the replication dataset for this study. These MECC participants had similar distributions of key demographic and clinical covariates to the discovery stage MECC subjects with the exception of cancer site and MSI (Table I). Genotyping was performed via hybridization to a custom Affymetrix genome-wide platform (the Axiom® CORECT Set) containing ~1.3 million SNPs and indels spread across two physical genotyping chips (pegs). The QC and filtering pipeline resulted in a final analysis dataset containing 1131 cases, 831 controls and 1 230 678 genetic markers (Figure 2). Principal components analysis was conducted using Eigenstrat (35) based on a set of 2,884 ancestry information markers derived from the literature and the Illumina Infinium HumanExome BeadChip and Affymetrix Axiom Exome Array. Pairwise plots of PCs 1 and 2 on the final analysis dataset are in Supplementary Figure 3, available at Carcinogenesis Online.
Fig. 2.

Quality control and filtering pipeline for MECC replication samples before imputation. PC, principal component.
Imputation
To analyze genotype data generated from four different platforms that measure different genetic variants and to increase the coverage of variation that is measurable across the genome, imputation of genotypes was performed for both autosomal and X chromosome markers. First, genotypes were prephased into best-guess haplotypes with SHAPEIT (SHAPEIT.v1.ESHG) to increase the computational efficiency of downstream steps (36). Then, IMPUTE v2.2.2 was used to impute missing genotypes for study samples based on the cosmopolitan panel of reference haplotypes from Phase I of the 1000 Genomes Project (1000GP; March 2012 release; n = 1092) (37,38). The release contains more than 39 million autosomal and X chromosome SNPs, indels and structural variants. Stringent imputation quality and accuracy filters were applied to genotypes resulting from the imputation (info ≥ 0.7, certainty ≥ 0.9 and concordance ≥ 0.9 between directly measured and imputed genotypes after masking input genotypes (for genotyped markers only). Further, our variant list was restricted to those with study-specific MAF ≥ 1%. Following imputation and QC, 9 009 669, 8 304 060 and 9 177 523 SNPs and indels were available for analysis in the MECC discovery, CFR discovery and MECC replication, respectively.
Statistical analysis—discovery GWAS meta-analysis
The discovery MECC and CFR datasets were first analyzed in a study-specific fashion, allowing adjustment for appropriate covariates. Then, study-specific results were combined using an inverse-variance-weighted, fixed-effects meta-analysis approach. In each study, to examine the association between each variant and CRC risk, we specified a log-additive genetic model, where each variant was coded as a dosage, or the expected number of effect alleles at that locus. We also considered an autosomal recessive model (Supplementary Table 3, available at Carcinogenesis Online). We calculated beta coefficients and corresponding OR, standard errors, 95% confidence intervals and P values using unconditional logistic regression. For MECC, models were adjusted for age, sex, three PCs and genotyping batch (in the event that differential genotyping errors occurred across the two genotyping centers). For CFR, we adjusted for age, sex, four PCs and recruitment site (in three groups). For both MECC and CFR, higher PCs were primarily driven by outliers, so adjusting for more PCs was deemed unnecessary. These models were used to examine the OR for CRC risk associated with each additional copy of the minor allele (or minor allele dosage) for a given SNP, after adjusting for all covariates in the model.
For markers with matching identification names and/or chromosome, base pair and alleles across the two studies, we conducted a meta-analysis of point estimates and standard errors using an inverse-variance-weighted, fixed-effects approach. This method, implemented in METAL, calculates a summary estimate of effect for each marker through summation of inverse-variance weighted betas across studies, divided by the summed weights (39). A quantile–quantile (Q-Q) plot was generated to examine the distribution of meta-analysis P values compared with the distribution under the null (Figure 3, Panel A). The genomic control lambda associated with the observed P-value distribution was calculated to identify evidence of P-value inflation, likely due to population stratification. A Manhattan plot showing P values sorted by chromosomal position was generated to provide a visual illustration of top association findings across the genome (Figure 3, Panel B). SNPs with genome-wide significant P values (P < 5 × 10− 8) in the discovery stage were selected for replication in the second phase of this study (n marker = 6). Further, to ensure that our genotyping and subsequent analysis was able to detect previously published risk variants, we examined association results for 29 available out of 30 total SNPs from 22 independent regions known to be associated with CRC from previous studies (Supplementary Table 1, available at Carcinogenesis Online).
Fig. 3.
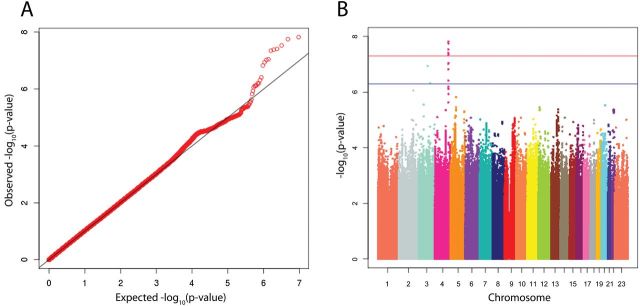
(A) Q-Q plot and (B) Manhattan plot of −log10(P values) derived from an inverse-variance-weighted, fixed-effects meta-analysis of adjusted logistic regression results run on MECC and CFR discovery samples. MECC analyses were adjusted for age, sex, batch and three principal components (PCs). CFR analyses were adjusted for age, sex, recruitment site and four PCs; 492866 markers had P < 0.05. In (B), each circle represents the −log10(P value) for one of 9516354 SNPs plotted against its chromosomal location on the x-axis. Blue line = suggestive level for genome-wide significance at 5×10⁻⁷. Red line = genome-wide significance threshold at 5×10⁻⁸.
Statistical analysis and plot generation were conducted using a combination of PLINK v1.07 (40), R v2.15.2 and METAL (39). The P value criteria for genome-wide statistical significance of SNP coefficients were: (i) Discovery stage: P < 5 × 10− 8; (ii) Replication: P < 0.05 and (iii) Combined: P < 5 × 10− 8 (41).
Replication in MECC and joint meta-analysis
To replicate our discovery meta-analysis findings, we used the same logistic regression analysis methods described earlier to examine the marginal association between each marker with P < 5 × 10− 8 from the MECC+CFR discovery meta-analysis and CRC status in an independent set of MECC samples. Models were adjusted for age, sex and two PCs. Higher PCs were outlier-driven, so additional adjustment beyond two PCs was not informative. Because it has been demonstrated that joint analysis of two-stage GWAS designs is more efficient than replication-based analysis (42), we also conducted a fixed-effects meta-analysis of SNPs with P < 5 × 10− 8 from the discovery MECC+CFR meta-analysis with the results from the MECC-based replication. Subsequently, for a region identified as a novel, genome-wide significant susceptibility locus, we removed the P < 5 × 10− 8 discovery filter to explore associations in the genetic vicinity in more depth through fine mapping. A regional plot of association results near the genome-wide significant finding were generated using LocusZoom with LD based on the 1000GP March 2012 release European samples (43).
Results
Discovery meta-analysis
A Q-Q plot of P values from the fixed-effects meta-analysis of study-specific, adjusted logistic regression model results shows the rank-ordered observed −log10(P value) plotted against the rank-ordered expected −log10(P value) (Figure 3, Panel A). The P values above the diagonal line in the upper-right quadrant of the plot demonstrate that there are a number of SNPs with associations more statistically significant than expected by chance alone, assuming a uniform distribution of P values. Further, the associated genomic control lambda value of 1.033 suggests that the selected covariates and PCs provide reasonable control for population stratification. The Manhattan plot displays summary results from the meta-analysis by chromosomal position and highlights a peak on chromosome 4 with six variants in tight LD (pairwise R 2 ≥ 0.975 for five SNPs in 1000GP June 2011 Europeans) reaching genome-wide significance at P < 5 × 10− 8 (Figure 3, Panel B).
Rs17042479 was the SNP with the most statistically significant P value on chromosome 4 (risk allele = G; OR per risk allele = 1.67; P value = 1.5 × 10− 8). The directions of effect for MECC and CFR were consistent, with CFR exhibiting a slightly attenuated effect (Table II). Study-specific estimates demonstrate that the result was not heavily driven by either MECC or CFR findings, and the average minor allele frequency across studies was ~9%. This SNP was directly measured in the MECC discovery samples, CFR Set1 and MECC replication samples (imputed only in CFR Set 2). The SNP is located ~240 kb upstream of the ~800kb gene FSTL5 (follistatin-like 5) and ~720kb downstream of NAF1 [nuclear assembly factor 1 homolog (Saccharomyces cerevisiae)]. The complete list of six discovery stage genome-wide significant association findings (P ≤ 5×10− 8) between effect allele dosage and CRC status, visually indicated by the inflated tail of observed −log10(P values) in the Q-Q plot (Figure 3, Panel A) and as SNPs above the blue line in the Manhattan plot (Figure 3, Panel B) are summarized in Table II. Further, we also demonstrated that 14 out of 29 previously identified CRC risk alleles that were imputed with high quality and analyzed in this meta-analysis had nominally significant associations with P < 0.05 (Supplementary Table 2, available at Carcinogenesis Online). Twenty six out of 29 known susceptibility markers had a consistent risk allele and direction of effect with the previously published result. The most statistically significant risk locus was located at chromosomal region 8q24, as described from the same source population (9).
Table II.
Summary of genetic variants with combined P < 5×10⁻⁸ in the combined discovery (MECC + CFR) + replication (MECC) meta-analysis
| SNP | Chromosome | Position | Average Freq | Effect allele | Alt allele | MECC discovery OR (SEa) | CFR discovery OR (SEa) |
Discovery OR (SEa) | Discovery P | Replication OR (SEa) | Replication P | Meta OR (SEa) | Meta P | I 2 statistic |
|---|---|---|---|---|---|---|---|---|---|---|---|---|---|---|
| rs17042479b | 4 | 163325411 | 0.09 | G | A | 2.08 (0.22) | 1.59 (0.10) | 1.67 (0.09) | 1.5E-08 | 1.25 (0.12) | 6.6E-02 | 1.52 (0.07) | 1.7E-08 | 57.5 |
| rs79783178c | 4 | 163325957 | 0.09 | C | CAT | 2.08 (0.22) | 1.59 (0.10) | 1.67 (0.09) | 1.8E-08 | 1.25 (0.12) | 6.8E-02 | 1.52 (0.07) | 2.0E-08 | 57.3 |
| rs35509282c | 4 | 163333405 | 0.09 | A | T | 1.89 (0.22) | 1.61 (0.10) | 1.67 (0.09) | 3.0E-08 | 1.32 (0.13) | 3.3E-02 | 1.53 (0.07) | 8.2E-09 | 12.2 |
| rs9998942 c | 4 | 163340404 | 0.09 | T | C | 1.82 (0.22) | 1.61 (0.10) | 1.64 (0.09) | 3.9E-08 | 1.32 (0.13) | 3.1E-02 | 1.53 (0.07) | 9.7E-09 | 0.7 |
| rs57336275 c | 4 | 163341215 | 0.09 | C | T | 1.82 (0.21) | 1.61 (0.10) | 1.64 (0.09) | 4.2E-08 | 1.32 (0.13) | 3.5E-02 | 1.54 (0.07) | 1.9E-08 | 3.2 |
| rs11736440 c | 4 | 163336693 | 0.09 | A | G | 1.85 (0.22) | 1.61 (0.10) | 1.65 (0.09) | 4.5E-08 | 1.33 (0.13) | 2.5E-02 | 1.53 (0.07) | 8.3E-09 | 0.0 |
All variants fall upstream of FSTL5 and represent a newly identified genetic susceptibility locus for colorectal cancer.
aSE, standard error of the beta estimate.
bDirectly genotyped in the MECC discovery samples, CFR Set1, and MECC replication samples (imputed only in CFR Set 2 with info = 0.975).
cImputed with imputation quality info score ≥ 0.976 in all sample sets.
Replication and joint meta-analysis
The six genetic markers from the MECC+CFR discovery meta-analysis with P < 5 × 10− 8 were carried forward into this stage. Four out of six variants replicated in the independent set of MECC samples with P < 0.05 (Table II). Further, the combined meta-analysis of MECC discovery and CFR discovery samples together with MECC replication samples demonstrated that the region on chromosome 4q32.2 remains statistically significant at a genome-wide threshold. In the combined analysis, rs35509282 was the most strongly associated meta-analysis finding (risk allele = A; OR per risk allele = 1.53; P value = 8.2 × 10− 9), with the MECC replication-specific result consistent in direction with a P value of 0.033 (Table II). All findings with P < 5 × 10− 8 were located within this same region on chromosome 4, and the OR estimates and average allele frequencies indicate strong LD among all top SNPs. Because several chromosome 4 associated SNPs reached genome-wide significance upon replication and combined meta-analysis, we removed the discovery P-value filter of <5 × 10− 8 and examined the combined three-study meta-analysis results in this chromosomal location. A regional LocusZoom plot summarizes the fine mapping that is accomplishable via 1000GP imputation. The association finding at 4q32.2 localizes to an ~250kb region upstream of FSTL5 (Figure 4).
Fig. 4.

LocusZoom plot of regional association results for the novel 4q32.2 genome-wide significant locus (rs17042479±1Mb). The x-axis represents chromosomal position, and the y-axis shows the −log10(P value) from the meta-analysis of MECC discovery + CFR discovery + MECC replication. Each circle represents one SNP’s association with CRC. Purple = index SNP. Correlation (r 2) between the index SNP and each other SNP was calculated based on 1000GP Phase I March 2012 European samples.
We also conducted colon- and rectum-specific analyses for our top findings. The combined discovery-replication meta-analysis effect sizes were comparable with the overall CRC ORs for both colon and rectum (data not shown). However, the sample sizes for rectal cancers were quite limited (MECC discovery: 456 colon, 29 rectum; CFR discovery: 1248 colon, 729 rectum; MECC replication: 793 colon, 296 rectum).
Discussion
This GWAS meta-analysis with independent replication was designed to identify novel, low-penetrance susceptibility variants among populations with European and Ashkenazi Jewish ancestries. In the discovery meta-analysis, we identified a novel, genome-wide significant CRC susceptibility locus on 4q32.2 with an MAF of ~9%. To date, no other genome-wide significant (P < 5 × 10⁻⁸) CRC susceptibility variants have been identified on this region of chromosome 4. However, prior publications have identified two marginally significant loci associated with risk of CRC at 4q13.2 and 4q22.2 (20,44). This finding was replicated in an independent set of MECC cases and controls with a consistent direction of effect and P value less than 0.05. Evidence that known CRC risk SNPs were also identifiable with our study design (combining Ashkenazi Jews and non-Hispanic whites) increased our confidence in the validity of this novel finding. Twenty six of twenty nine previously published variants replicated with a consistent direction of effect. For those with inconsistent direction of effect or for those not statistically significantly associated at P < 0.05, the results might be attributed to modest sample size or to differences in LD structure between our sample and other participants studied in other GWAS.
The 4q32.2 region localized based on the LocusZoom plot falls ~240kb upstream of the FSTL5 gene and 720kb downstream of the NAF1 gene. The frequencies of the most statistically significantly associated SNPs matched closely with their reported MAFs for Europeans from HapMap (CEU) according to the dbSNP database. Interestingly, this SNP has a MAF close to 50% for those of Asian and African descent in HapMap. Preliminary bioinformatic analysis based on ENCODE (45) data in the UCSC Genome Browser (http://genome.ucsc.edu/cgi-bin/hgGateway) reveals that the broader region around the lead discovery SNP (rs17042479) may overlap with an H3K27Ac histone mark (a feature often located near active regulatory elements), a DNaseI hypersensitivity region (a chromatin accessibility feature common to cis-regulatory sequences), and/or a transcription factor binding site. Although we do not yet have experimental evidence to confirm a functional role of genetic variation in this region, it is possible that an intergenic SNP or the genetic element that it tags exerts a regulatory effect on one of the nearest genes, FSTL5 or NAF1. FSTL5 encodes an extracellular matrix protein that interacts with metalloproteases and may be structurally similar to some collagen-degrading matrix metalloproteinases and matrix metalloproteinase inhibitor TIMP1 that are critical for normal physiology (46). Little is known about the gene’s function, but some evidence suggests potential links to known etiologic pathways involved in CRC development. In general, follistatins bind activins, regulate cellular differentiation and neutralize TGF-β superfamily members (http://www.nlm.nih.gov/cgi/mesh/2011/MB_cgi?mode=&term=Follistatin). The TGF-β signaling pathway’s role in CRC development has been well characterized (47–49). NAF1 encodes a protein important for assembly of H/ACA human telomerase RNA (50). This chaperone protein is important for telomerase activity, and a previous report identified a SNP in this same region (4q32.2) that was associated with mean telomere length (51). Given the importance of telomerase and telomeres in the development and maintenance of cancer, this gene deserves attention in future functional studies as a potential regulatory target of our novel CRC susceptibility locus (52).
We have previously published an analysis of gene expression patterns in colon and rectal cancer in the MECC study. In our analysis of 460 colon cancers and 100 rectal cancers, microsatellite-stable colorectal cancers did not show major transcriptomic differences for tumors arising in the colon or rectum. The small but consistent differences observed were largely driven by the HOX genes (53). However, colon and rectal cancers do have different clinical behaviors, and other studies have shown differences in expression between colon and rectal cancers as well as right and left colon cancers (54–56).
Our study with a modest sample size reveals only this single locus that reaches the genome-wide significance threshold; however, it has not been observed as a susceptibility locus in previously published studies. Given the selection for cases with a family history of CRC within the CFR study, it is possible that this genome wide-signal is driven by a combination of a low penetrance susceptibility allele in the Ashkenazi Jews (MECC) and a higher penetrance, rarer effect among family history-positive and young age at onset non-Hispanic whites (CFR). Further, potential selection bias resulting from CFR case enrichment for younger age at onset and family history may have led to overestimates of effect, enabling the novel chromosome 4 locus’s detection here but not in previous GWAS. A similar phenomenon occurred when the penetrance of BRCA1 and BRCA2 mutations for breast cancer were initially overestimated in studies of high-risk families (57). False-positive findings also remain a threat to the interpretation of this result, even when setting a stringent threshold for genome-wide significance. Additional replication studies will help to clarify this possibility.
While this study has multiple strengths, it is also limited by some of the same considerations common to most GWAS studies. First, the sample size limited our power to detect an effect, and particularly, the power to examine the effects of rarer variants either directly measured on the arrays or imputed (MAF < 1%). However, it is clear that the combination of Ashkenazi Jewish individuals and non-Hispanic whites enriched for family history comprised a unique study sample for detection of a novel result. Second, the choice of the non-Ashkenazi Jewish Colon CFR as our second study sample for discovery may decrease the ability to detect significant variants that may be specific to the Ashkenazi Jewish founder population. Third, it is possible that observed findings could be a result of the winner’s curse. We observed a larger effect size in our discovery phase as compared with the replication.
Furthermore, multiple levels of control influence the development of CRC, including but not limited to known epidemiologic risk factors, sequence variation, transcriptional regulation, gene expression, protein expression, DNA methylation and chromatin modifications. Here, we only focus on germline genetic variation, while environmental factors, gene–gene interaction, and gene-by-environment interactions are known to play roles in the development of CRC as well. Interactions were not the focus here because of the prohibitively large samples sizes needed for their study. In addition, we are unable to explicitly determine functionality of SNPs identified to be associated with disease from the GWAS meta-analysis itself.
In summary, we provided evidence that genetic variation on chromosome 4q32.2 is significantly associated with risk of CRC in Ashkenazi Jews and other Europeans. Future directions will focus on determining the biological relevance of the identified variant and its surrounding genetic context. Fine-mapping and screening of coding regions for mutations using standard methods offer an advantage to localize the most strongly associated SNPs in the area (58). Association studies with cis gene expression will also be critical to glean initial insights into the function of the genetic variation in relation to CRC development. If justified by fine mapping exercises and more extensive searches of ENCODE and other publicly available data, experimental studies on the regulatory impact of the surrounding region will ensue. Identification of this locus has the potential to provide unique insights into the underlying biology of CRC.
Supplementary material
Supplementary Tables 1–3 and Figures 1–3 can be found at http://carcin.oxfordjournals.org/
Funding
The work of the Molecular Epidemiology of Colorectal Cancer (MECC) Study was supported by the National Cancer Institute at the National Institutes of Health [R01 CA81488, U19 CA148107, and P30 CA014089]; the National Human Genome Research Institute at the National Institutes of Health [T32 HG000040]; the National Institute of Environmental Health Sciences at the National Institutes of Health [T32 ES013678]; and the Rackham Graduate School at the University of Michigan [Rackham Predoctoral Fellowship]. This work of the Colon Cancer Family Registry (CFR) was supported by the National Cancer Institute, National Institutes of Health [CA-95-011] and through cooperative agreements with members of the Colon CFR and Principal Investigators. Collaborating centers include the Australasian Colorectal Cancer Family Registry[(U01 CA097735]; the Familial Colorectal Neoplasia Collaborative Group [U01 CA074799]; the Mayo Clinic Cooperative Family Registry for Colon Cancer Studies [U01 CA074800]; the Ontario Registry for Studies of Familial Colorectal Cancer [U01 CA074783]; the Seattle Colorectal Cancer Family Registry [U01 CA074794]; and University of Hawaii Colorectal Cancer Family Registry [U01 CA074806]. The Colon CFR GWAS and post-GWAS work was supported by the National Cancer Institute, National Institutes of Health [U01CA122839 and R01 CA143237].
Conflict of Interest Statement: None declared.
Supplementary Material
Glossary
Abbreviations:
- 1000GP
1000 Genomes Project
- AJ
Ashkenazi Jewish
- CFR
Colon Cancer Family Registry
- CRC
colorectal cancer
- GWAS
genome-wide association study
- LD
linkage disequilibrium
- MAF
minor allele frequency
- MECC
Molecular Epidemiology of CRC
- MSI
microsatellite instable
- OR
odds ratio
- PC
principal components
- QC
quality control
- Q-Q
quantile–quantile
- SNP
single nucleotide polymorphisms.
References
- 1. Howlader N.N.A, et al. (eds) (2012). SEER Cancer Statistics Review, 1975–2009 (Vintage 2009 Populations), Based on November 2011 SEER Data Submission. http://seer.cancer.gov/csr/1975_2009_pops09/ (21 May 2014, date last accessed).
- 2. Ferlay J.S.H., et al. (2010). GLOBOCAN 2008 v1.2, Cancer Incidence and Mortality Worldwide: IARC CancerBase No. 10. http://globocan.iarc.fr http://globocan.iarc.fr (21 May 2014, date last accessed).
- 3. Fireman Z., et al. (2001). Ethnic differences in colorectal cancer among Arab and Jewish neighbors in Israel. Am. J. Gastroenterol., 96, 204–207. [DOI] [PubMed] [Google Scholar]
- 4. Haggar F.A., et al. (2009). Colorectal cancer epidemiology: incidence, mortality, survival, and risk factors. Clin. Colon Rectal Surg., 22, 191–197. [DOI] [PMC free article] [PubMed] [Google Scholar]
- 5. Kemp Z., et al. (2004). An update on the genetics of colorectal cancer. Hum. Mol. Genet., 13 (Spec No 2), R177–R185. [DOI] [PubMed] [Google Scholar]
- 6. Burt R. (2007). Inheritance of colorectal cancer. Drug Discov. Today Dis. Mech., 4, 293–300. [DOI] [PMC free article] [PubMed] [Google Scholar]
- 7. Fearon E.R. (2011). Molecular genetics of colorectal cancer. Annu. Rev. Pathol., 6, 479–507. [DOI] [PubMed] [Google Scholar]
- 8. Visscher P.M., et al. (2012). Five years of GWAS discovery. Am. J. Hum. Genet., 90, 7–24. [DOI] [PMC free article] [PubMed] [Google Scholar]
- 9. Gruber S.B., et al. (2007). Genetic variation in 8q24 associated with risk of colorectal cancer. Cancer Biol. Ther., 6, 1143–1147. [DOI] [PubMed] [Google Scholar]
- 10. Jaeger E., et al. (2008). Common genetic variants at the CRAC1 (HMPS) locus on chromosome 15q13.3 influence colorectal cancer risk. Nat. Genet., 40, 26–28. [DOI] [PubMed] [Google Scholar]
- 11. Zanke B.W., et al. (2007). Genome-wide association scan identifies a colorectal cancer susceptibility locus on chromosome 8q24. Nat. Genet., 39, 989–994. [DOI] [PubMed] [Google Scholar]
- 12. Broderick P., et al. (2007). A genome-wide association study shows that common alleles of SMAD7 influence colorectal cancer risk. Nat. Genet., 39, 1315–1317. [DOI] [PubMed] [Google Scholar]
- 13. Tomlinson I., et al. (2007). A genome-wide association scan of tag SNPs identifies a susceptibility variant for colorectal cancer at 8q24.21. Nat. Genet., 39, 984–998. [DOI] [PubMed] [Google Scholar]
- 14. Houlston R.S., et al. (2008). Meta-analysis of genome-wide association data identifies four new susceptibility loci for colorectal cancer. Nat. Genet., 40, 1426–1435. [DOI] [PMC free article] [PubMed] [Google Scholar]
- 15. Neklason D.W., et al. (2008). Common familial colorectal cancer linked to chromosome 7q31: a genome-wide analysis. Cancer Res., 68, 8993–8997. [DOI] [PMC free article] [PubMed] [Google Scholar]
- 16. Tomlinson I.P., et al. (2008). A genome-wide association study identifies colorectal cancer susceptibility loci on chromosomes 10p14 and 8q23.3. Nat. Genet., 40:623–630. [DOI] [PubMed] [Google Scholar]
- 17. Tenesa A., et al. (2008). Genome-wide association scan identifies a colorectal cancer susceptibility locus on 11q23 and replicates risk loci at 8q24 and 18q21. Nat. Genet., 40, 631–637. [DOI] [PMC free article] [PubMed] [Google Scholar]
- 18. Houlston R.S., et al. (2010). Meta-analysis of three genome-wide association studies identifies susceptibility loci for colorectal cancer at 1q41, 3q26.2, 12q13.13 and 20q13.33. Nat. Genet., 42, 973–977. [DOI] [PMC free article] [PubMed] [Google Scholar]
- 19. Peters U., et al. (2012). Meta-analysis of new genome-wide association studies of colorectal cancer risk. Hum. Genet., 131, 217–234. [DOI] [PMC free article] [PubMed] [Google Scholar]
- 20. Peters U., et al. (2013). Identification of genetic susceptibility loci for colorectal tumors in a genome-wide meta-analysis. Gastroenterology, 144, 799–807. [DOI] [PMC free article] [PubMed] [Google Scholar]
- 21. Dunlop M.G., et al. (2012). Common variation near CDKN1A, POLD3 and SHROOM2 influences colorectal cancer risk. Nat. Genet., 44, 770–776. [DOI] [PMC free article] [PubMed] [Google Scholar]
- 22. Tomlinson I.P., et al. (2011). Multiple common susceptibility variants near BMP pathway loci GREM1, BMP4, and BMP2 explain part of the missing heritability of colorectal cancer. PLoS Genet., 7, e1002105. [DOI] [PMC free article] [PubMed] [Google Scholar]
- 23. Tenesa A., et al. (2009). New insights into the aetiology of colorectal cancer from genome-wide association studies. Nat. Rev. Genet., 10, 353–358. [DOI] [PubMed] [Google Scholar]
- 24. Manolio T.A., et al. (2009). Finding the missing heritability of complex diseases. Nature, 461, 747–753. [DOI] [PMC free article] [PubMed] [Google Scholar]
- 25. Chung C.C., et al. (2011). Current status of genome-wide association studies in cancer. Hum. Genet., 130, 59–78. [DOI] [PubMed] [Google Scholar]
- 26. Kraft P., et al. (2009). Genetic risk prediction—are we there yet? N. Engl. J. Med., 360, 1701–1703. [DOI] [PubMed] [Google Scholar]
- 27. Jo J., et al. (2012). Prediction of colorectal cancer risk using a genetic risk score: The Korean Cancer Prevention Study-II (KCPS-II). Genomics Inform., 10, 175–183. [DOI] [PMC free article] [PubMed] [Google Scholar]
- 28. Goldstein D.B. (2009). Common genetic variation and human traits. N. Engl. J. Med., 360, 1696–1698. [DOI] [PubMed] [Google Scholar]
- 29. Gibson G. (2011). Rare and common variants: twenty arguments. Nat. Rev. Genet., 13, 135–145. [DOI] [PMC free article] [PubMed] [Google Scholar]
- 30. Bodmer W., et al. (2008). Common and rare variants in multifactorial susceptibility to common diseases. Nat. Genet., 40, 695–701. [DOI] [PMC free article] [PubMed] [Google Scholar]
- 31. Poynter J.N., et al. (2005). Statins and the risk of colorectal cancer. N. Engl. J. Med., 352, 2184–2192. [DOI] [PubMed] [Google Scholar]
- 32. Newcomb P.A., et al. (2007). Colon Cancer Family Registry: an international resource for studies of the genetic epidemiology of colon cancer. Cancer Epidemiol. Biomarkers Prev., 16:2331–2343. [DOI] [PubMed] [Google Scholar]
- 33. Figueiredo J.C., et al. (2011). Genotype-environment interactions in microsatellite stable/microsatellite instability-low colorectal cancer: results from a genome-wide association study. Cancer Epidemiol. Biomarkers Prev., 20, 758–766. [DOI] [PMC free article] [PubMed] [Google Scholar]
- 34. Stacklies W., et al. (2007). pcaMethods—a bioconductor package providing PCA methods for incomplete data. Bioinformatics, 23, 1164–1167. [DOI] [PubMed] [Google Scholar]
- 35. Price A.L., et al. (2006). Principal components analysis corrects for stratification in genome-wide association studies. Nat. Genet., 38, 904–909. [DOI] [PubMed] [Google Scholar]
- 36. Delaneau O., et al. (2012). A linear complexity phasing method for thousands of genomes. Nat. Methods, 9, 179–181. [DOI] [PubMed] [Google Scholar]
- 37. Howie B., et al. (2012). Fast and accurate genotype imputation in genome-wide association studies through pre-phasing. Nat. Genet., 44, 955–959. [DOI] [PMC free article] [PubMed] [Google Scholar]
- 38. Abecasis G.R., et al. (2010). A map of human genome variation from population-scale sequencing. Nature, 467, 1061–1073. [DOI] [PMC free article] [PubMed] [Google Scholar]
- 39. Willer C.J., et al. (2010). METAL: fast and efficient meta-analysis of genomewide association scans. Bioinformatics, 26, 2190–2191. [DOI] [PMC free article] [PubMed] [Google Scholar]
- 40. Purcell S., et al. (2007). PLINK: a tool set for whole-genome association and population-based linkage analyses. Am. J. Hum. Genet., 81, 559–575. [DOI] [PMC free article] [PubMed] [Google Scholar]
- 41. Dudbridge F., et al. (2008). Estimation of significance thresholds for genomewide association scans. Genet. Epidemiol., 32, 227–234. [DOI] [PMC free article] [PubMed] [Google Scholar]
- 42. Skol A.D., et al. (2006). Joint analysis is more efficient than replication-based analysis for two-stage genome-wide association studies. Nat. Genet., 38, 209–213. [DOI] [PubMed] [Google Scholar]
- 43. Pruim R.J., et al. (2010). LocusZoom: regional visualization of genome-wide association scan results. Bioinformatics, 26, 2336–2337. [DOI] [PMC free article] [PubMed] [Google Scholar]
- 44. Jiao S., et al. (2012). Genome-wide search for gene–gene interactions in colorectal cancer. PLoS One, 7, e52535. [DOI] [PMC free article] [PubMed] [Google Scholar]
- 45. Dunham I., et al. (2012). An integrated encyclopedia of DNA elements in the human genome. Nature, 489, 57–74. [DOI] [PMC free article] [PubMed] [Google Scholar]
- 46. Zabala W., et al. (2013). New genetic associations in thiopurine-related bone marrow toxicity among inflammatory bowel disease patients. Pharmacogenomics, 14, 631–640. [DOI] [PubMed] [Google Scholar]
- 47. Massagué J., et al. (2000). TGFbeta signaling in growth control, cancer, and heritable disorders. Cell, 103, 295–309. [DOI] [PubMed] [Google Scholar]
- 48. Xu Y., et al. (2007). TGF-beta signaling alterations and susceptibility to colorectal cancer. Hum. Mol. Genet., 16 (Spec No 1), R14–R20. [DOI] [PMC free article] [PubMed] [Google Scholar]
- 49. Bellam N., et al. (2010). Tgf-beta signaling alterations and colon cancer. Cancer Treat. Res., 155, 85–103. [DOI] [PubMed] [Google Scholar]
- 50. Egan E.D., et al. (2012). An enhanced H/ACA RNP assembly mechanism for human telomerase RNA. Mol. Cell Biol., 32, 2428–2439. [DOI] [PMC free article] [PubMed] [Google Scholar]
- 51. Codd V., et al. (2013). Identification of seven loci affecting mean telomere length and their association with disease. Nat. Genet., 45, 422–427, 427e1. [DOI] [PMC free article] [PubMed] [Google Scholar]
- 52. Blasco M.A. (2005). Telomeres and human disease: ageing, cancer and beyond. Nat. Rev. Genet., 6, 611–622. [DOI] [PubMed] [Google Scholar]
- 53. Sanz-Pamplona R., et al. (2011). Gene expression differences between colon and rectum tumors. Clin. Cancer Res., 17, 7303–7312. [DOI] [PMC free article] [PubMed] [Google Scholar]
- 54. Bertucci F., et al. (2004). Gene expression profiling of colon cancer by DNA microarrays and correlation with histoclinical parameters. Oncogene, 23, 1377–1391. [DOI] [PubMed] [Google Scholar]
- 55. Birkenkamp-Demtroder K., et al. (2005). Differential gene expression in colon cancer of the caecum versus the sigmoid and rectosigmoid. Gut, 54, 374–384. [DOI] [PMC free article] [PubMed] [Google Scholar]
- 56. Mequid R.A., et al. (2008). Is there a difference in survival between right- and left-sided colon cancers? Ann. Surg. Oncol., 15, 2388–2394. [DOI] [PMC free article] [PubMed] [Google Scholar]
- 57. Mavaddat N., et al. (2013). Cancer risks for BRCA1 and BRCA2 mutation carriers: results from prospective analysis of EMBRACE. J. Natl. Cancer Inst., 105, 812–822. [DOI] [PubMed] [Google Scholar]
- 58. Pittman A.M., et al. (2008). Refinement of the basis and impact of common 11q23.1 variation to the risk of developing colorectal cancer. Hum. Mol. Genet., 17, 3720–3727. [DOI] [PubMed] [Google Scholar]
Associated Data
This section collects any data citations, data availability statements, or supplementary materials included in this article.