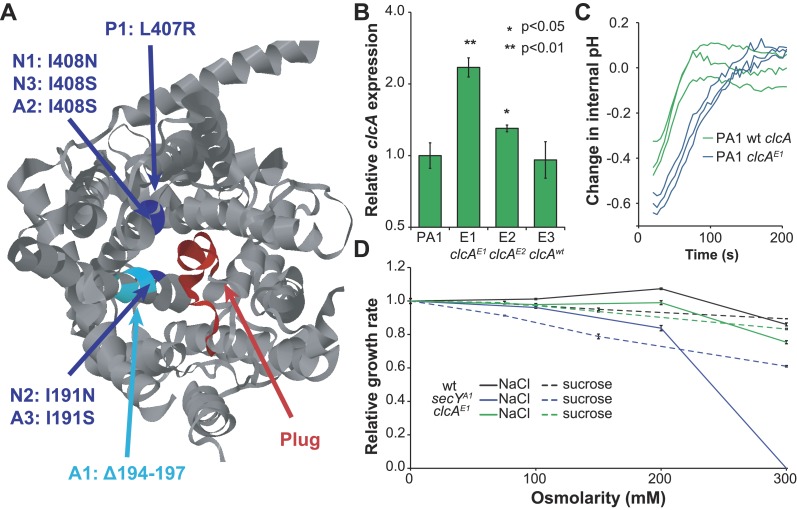
Figure 4. Mutations in secY and clcA are predicted to increase chloride export.
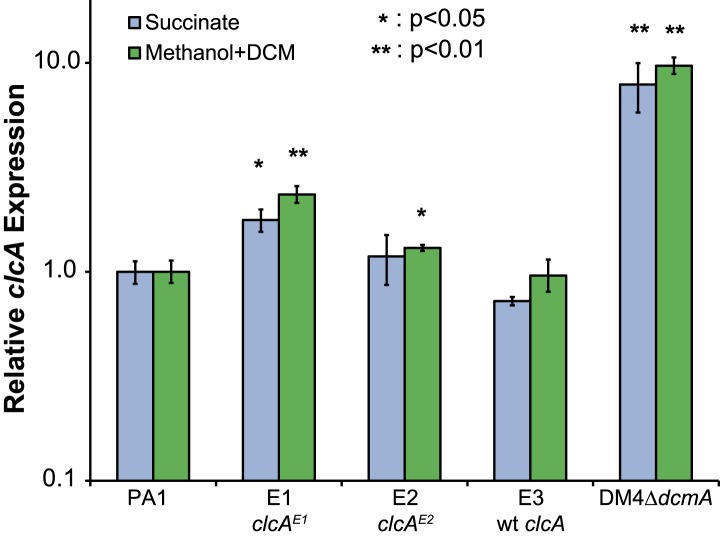
(A) When mapped to the crystal structure of SecY from Methanocaldococcus jannaschii (Van den Berg et al., 2004), the seven mutations to secY cluster in a small region of the protein structure (blue and cyan) at the interface between the channel and plug (red) that is associated with leakage of small anions. (B) Mutations to the clcA promoter in isolates E1 and E2 lead to significantly increased transcription of clcA, as measured by qRT-PCR (one tailed Welch's t-test with two degrees of freedom). Error bars show ±1 standard deviation, calculated from three biological replicates. (C) Adding DCM to strains that overexpress clcA leads to a larger decrease in internal pH. Strains contain pJM40, expressing both dcmA and a fluorescent pH biosensor. The strain with a mutated clcA promoter (blue) overexpresses ClcA relative to the wild type strain (green). At t = 0, DCM was added to a final concentration of 10 mM. After an approximate delay of 20 s, the culture was continuously sampled with a flow cytometer to determine the dynamics of the internal pH. Both strains showed a transient decrease in pH, but the decrease is larger for the clcA overexpression strain (p = 0.036, one-tailed Welch's t-test with two degrees of freedom). (D) Mutations to secY, but not to clcA, increase chloride sensitivity. Growth rates of three PA1 strains (wild type, secYA1, and clcAE1) were measured using an automated assay system. The osmolarity of the medium was varied through the addition of sucrose or sodium chloride. The secYA1 mutant did not grow at the highest chloride concentration.


