

Background: Depletion of NAD is a novel therapeutic strategy in oncology.
Results: NAD depletion leads to loss of ATP and plasma membrane homeostasis.
Conclusion: Although cells display evidence of apoptosis and autophagy, they predominantly die by oncosis caused by loss of ATP.
Significance: We have identified a common pathway leading to cell death in response to NAD depletion.
Keywords: Apoptosis, ATP, Cell Death, Cell Metabolism, Nicotinamide Adenine Dinucleotide (NAD), GNE-617, NAMPT, Oncosis
Abstract
Depletion of the central metabolite NAD in cells results in broad metabolic defects leading to cell death and is a proposed novel therapeutic strategy in oncology. There is, however, a limited understanding of the underlying mechanisms that connect disruption of this central metabolite with cell death. Here we utilize GNE-617, a small molecule inhibitor of NAMPT, a rate-limiting enzyme required for NAD generation, to probe the pathways leading to cell death following NAD depletion. In all cell lines examined, NAD was rapidly depleted (average t½ of 8.1 h) following NAMPT inhibition. Concurrent with NAD depletion, there was a decrease in both cell proliferation and motility, which we attribute to reduced activity of NAD-dependent deacetylases because cells fail to deacetylate α-tubulin-K40 and histone H3-K9. Following depletion of NAD by >95%, cells lose the ability to regenerate ATP. Cell lines with a slower rate of ATP depletion (average t½ of 45 h) activate caspase-3 and show evidence of apoptosis and autophagy, whereas cell lines with rapid depletion ATP (average t½ of 32 h) do not activate caspase-3 or show signs of apoptosis or autophagy. However, the predominant form of cell death in all lines is oncosis, which is driven by the loss of plasma membrane homeostasis once ATP levels are depleted by >20-fold. Thus, our work illustrates the sequence of events that occurs in cells following depletion of a key metabolite and reveals that cell death caused by a loss of NAD is primarily driven by the inability of cells to regenerate ATP.
Introduction
Cells contain central metabolites, such as NAD, that are integral to a wide array of enzymatic reactions in which they participate as a substrate, cofactor, or by-product. There are two main pathways used to generate NAD: the de novo pathway (also known as the kynurenine pathway) that converts tryptophan to NAD and the salvage pathway that recycles nicotinamide to NAD (1). The rate-limiting enzyme in the latter pathway is nicotinamide phosphoribosyl transferase (NAMPT),2 which catalyzes the addition of a ribose group to nicotinamide to generate nicotinamide mononucleotide, an immediate precursor of NAD. Small molecule inhibitors directed against NAMPT have been described and shown to deplete NAD in cancer cells and induce cell death (2–6), thus emphasizing the importance of NAD in cancer cell survival.
Because NAD is required as both a substrate and cofactor for a large number of metabolic enzymes, its depletion can impact flux through pathways that are dependent on these enzymes. As such, a range of metabolic perturbances likely contributes to an observed loss of cellular ATP following NAD depletion (2, 3, 5, 7). For example, depletion of NAD with the small molecule inhibitor FK-866 or GNE-618 results in the attenuation of glycolysis (5, 7). This is attributed to reduced activity of the NAD utilizing enzyme glyceraldehyde-3-phosphate dehydrogenase, which converts glyceraldehyde-3-phosphate to 1,3-bisphosphoglycerate, thus decreasing carbon flow into the TCA cycle. NAD and its phosphorylated derivative NADP are also critical for oxidative/reduction reactions involved in both de novo lipid synthesis (8) and catabolism of fatty acids during beta oxidation (9). Moreover, NADH, the reduced form of NAD generated during cellular metabolism, is utilized to transfer the reductive potential captured from catabolic reactions into NADH:ubiquinone oxidoreductase (complex I) that generates the membrane potential for ATP regeneration (10).
Outside its role in central metabolic pathways and redox balance, NAD is important for a number of cell signaling pathways. For example, NAD functions as a substrate for the DNA damage repair enzyme poly-ADP-ribose polymerase (PARP), which catalyzes the formation of negatively charged poly-ADP-ribose chains and releases free nicotinamide as a reaction by-product (11). It has been shown that high levels of DNA damage stimulate PARP activity, which results in depletion of cellular NAD and reduction of ATP levels, whereas inhibition of PARP activity prevents NAD and ATP depletion (12–14). NAD is also a substrate for the Sirtuin (SIRT) family of enzymes, which are protein deacetylases that remove the N-acetyl group from a variety of protein substrates (15). Depleting SIRT1 and SIRT2 in cells increases the level of acetylation of α-tubulin and p53 and induces cell death (16), and the hyperacetylation of one of its key substrates, Lys9/Lys14 of histone H3, is observed in SIRT1−/− mouse embryonic fibroblasts (17). Thus, deregulation of SIRT activity through depletion of NAD could result in hyperacetylation of SIRT target proteins.
There are a large number of different death processes that cells can undergo in response to different types of cellular insults (18). Some examples include apoptosis (loss of mitochondrial potential and cell blebbing), autophagy (cytoplasmic vacuolization), and oncosis (cellular swelling and rapid decrease in ATP), all of which can culminate in necrosis, which is characterized by the appearance of disrupted nuclei and membranes. Given the diverse roles and functions for NAD, it is not surprising that depletion of NAD results in cell death (2–6). Although there are reports that inhibition of NAMPT can increase cellular ROS levels (19) and promote apoptosis (19, 20), it has also been reported that NAMPT inhibition can induce autophagy (21, 22). Although depletion of NAD in tumors is considered an attractive therapeutic strategy in oncology, there remains a limited understanding of the pathways and mechanisms that link NAD depletion and cell death. Given this, we undertook to explore the pathways connecting NAD depletion and cell death and to determine whether cells utilized multiple or a single common mechanism to drive cell death. Our results show that although some cell lines activate caspase-3 and show signs of apoptosis and autophagy, others do not. Surprisingly, however, in all cell lines examined, depletion of NAD rapidly leads to a reduction in ATP levels. Once ATP levels decrease by >20-fold, plasma membrane integrity is lost, leading to oncosis-mediated cell death.
EXPERIMENTAL PROCEDURES
Chemicals and Reagents
GNE-617 was synthesized in-house at Genentech (6). All other reagents used in this study were purchased from the following sources: VX680 (T-2304; LC Laboratories), taxol (1097; Tocris Bioscience), trichostatin A (T8552; Sigma), ouabain (03125; Sigma), propidium iodide (P4864; Sigma), staurosporin (569396; Calbiochem), temozolomide (420-044; Enzo), Oliparib (O-9201; LC Laboratories), Fluo-4-AM (F-1420; Invitrogen), and CyQUANT Direct Cell Proliferation Assay (Invitrogen).
Cell Lines
All cell lines were obtained from our in-house tissue culture cell bank (original source was ATCC). Lines were authenticated by short tandem repeat and genotyped upon re-expansion. Cells were grown in RPMI 1640 supplemented with penicillin/streptomycin and GlutaMAX (15070-063 and 35050-061; Invitrogen) plus 10% HyClone qualified NAD free fetal bovine serum (SH30071.03; ThermoScientific).
NAD, ATP, and Cell Viability Measurements
ATP levels were assessed using Cell-titer Glo readout (G7570; Promega) and a Wallac Envision multilabel plate reader (PerkinElmer Life Sciences). Cell viability was measured by CyQUANT direct cell proliferation assay (Invitrogen) using a Wallac Envision multilabel plate reader (PerkinElmer Life Sciences). Dose responses were graphed and EC50 values determined using Prism 6 (GraphPad Software Inc.). For NAD determination, the cells were plated in 24-well plates and treated with 200 nm GNE-617. The cells were washed with PBS and NAD quantified as previously described (5). Kinetic time response graphs with t½ and t95% values were calculated using Prism 6 (GraphPad Software Inc.).
Live Cell Imaging
One thousand cells per well were plated on 96-well flat-bottomed plates (3904; Corning) 24 h prior to treatment. The cells were tracked using an Essen IncuCyte Zoom, and bright field images were captured every hour for the duration of the experiment. For yoyo-1 assays, bright field and fluorescent images were captured every 1.5 h after the addition of 2 μm yoyo-1 (Y3601; Invitrogen). Motility of individual cells was measured using the change in distance per hour of the central nuclear location (x/y) coordinates. Cell division timing was determined by tracking the time of cell division on a frame per frame TIFF stack analysis by ImageJ64 software using the MTrackJ plugin application (23) (National Institutes of Health open access). Cell division, withdrawal, blister formation events, and response to ouabain was tracked by manual analysis of stacked TIFF images.
Western Analysis
Acetylated tubulin was detected using anti-acetyl-K40-α-tubulin (611B-1) (ab24610; Abcam) and donkey anti-mouse 800cw secondary (926-32212; LiCor). PVDF membranes were stripped and reprobed with anti-total α-tubulin (11H10) (2125; Cell Signaling Technologies), and donkey anti-rabbit 800cw secondary (926-32213; Li-Cor). Membranes were imaged and quantified using an Odyssey IR fluorescence imaging system (LiCor).
Intracellular Multiparameter Flow Cytometry
Trypsinized cells were fixed for 2 h in 0.5% paraformaldehyde (30J25-89-4; Alfa Aesar), washed, permeabilized, and antibody-stained in permeabilization wash buffer (554723; BD Biosciences); intracellular flow cytometry was performed with either anti-phospho-histone H3 (Ser10)-AF488 (D2C8LiCor3465; Cell Signaling Technologies) and anti-active caspase-3-V450 (C92-605) (560627; BD Horizon) or with anti-acetyl-histone-H3K9-AF488 (C5B11) (9683; Cell Signaling Technologies) as previously described (49). Data were collected using a LSRII flow cytometer (BD Biosciences) and analyzed with FlowJo (TreeStar Inc.).
Mitochondrial Membrane Potential Assays
Mitochondrial JC-1 (M34152; Invitrogen) assay was performed according to the manufacturer's protocol using a final concentration of 2 μm JC-1 or 10 μm CM-H2DCFDA stained for 30 min. Fluorescence signal for each assay was detected using a Wallac Envision multilabel plate reader (PerkinElmer Life Sciences).
Transfections and Vector Construct
Cells were transfected with a Gateway® pDEST47 vector (12281-010; Life Technologies Inc.) expressing either eGFP-BCL2 or a green fluorescent VENUS protein (gift from Mary Ludlam and Dan Anderson; Genentech) using Lipofectamine 2000 (11668-030; Invitrogen). Cells were allowed to recover for 48 h prior to treatment.
Transmission Electron Microscopy
Adherent cells grown in 6-well plates were fixed in 1/2 Karnovsky's fixative, washed, and postfixed in 1% osmium textroxide. Samples were dehydrated by ethanol washes followed by a propylene oxide wash and Eponate 12 embedding (18005; Ted Pella Inc.). Semi-thin sections (300 nm) cut by Leica Ultracut UCT were stained with toluidine blue for light level (LM) examination. Thin sections (80 nm) stained with uranyl acetate and lead citrate were examined by transmission electron microscopy (JEOL JEM-1400).
Ratiometric Intracellular Calcium Measurements
Calcium measurements were performed according to the manufacturer's protocol, using a ratiometric calcium assay (644243; BD Biosciences), and measurements were taken using a Spectramax M5 microplate reader (Molecular Devices).
RESULTS
GNE-617 Depletes NAD and Induces Cell Death
GNE-617 (Fig. 1A) inhibits human NAMPT in a biochemical assay with an IC50 of 5 nm (6) and reduces NAD levels across a panel of six diverse cancer cell lines with a t½ of NAD reduction ranging from 6.5 to 12.5 h (Fig. 1B). NAD depletion results in cell death (Table 1), with an observed increase in a sub2N population (Fig. 1C).
FIGURE 1.

GNE-617 rapidly reduces NAD and induces cell death across multiple cell lines. A, structure of GNE-617 and its associated IC50 for purified human NAMPT. B, cells were exposed to 200 nm GNE-617 for the indicated times, and NAD levels were quantified by LC-MS/MS (average ± S.D., n = 3). The mean half-time (t½) and time to 95% depletion (t95%) for NAD depletion are shown in the inset (average ± S.D.). C and D, cell death (C, percentage of cells with sub-2N DNA content) and caspase-3 activation (D, percentage of cells staining positive for active caspase-3) were assessed by intracellular flow cytometry staining (average ± S.D., n = 3) after treatment of cells with 200 nm GNE-617 for 24, 48, or 72 h. E, all cell lines have the ability to activate caspase-3. Shown is the percentage of cells staining positive for intracellular active caspase-3 by intracellular flow cytometry assessed after treatment with 0.1 or 1 μm staurosporin for 12 h (average ± S.D., n = 3). F, cells were incubated either with GNE-617 (166 nm), olaparib (1.25 μm), or both for 96 h, and cell viability was assessed using a CyQuant assay. The resulting viability for each cell line is show relative to its DMSO control (average ± S.D., n = 3). G, the PARP inhibitor olaparib enhances the activity of temozolomide (TMZ) in the indicated cell lines. The cells were incubated either with olaparib (1.25 μm), temozolomide (250 μm), or both for 96 h, and cell viability was assessed using a CyQuant assay. The resulting viability for each cell line is shown relative to its DMSO control (average ± S.D., n = 3).
TABLE 1.
EC50 values for cellular NAD depletion and loss of viability (average ± S.D., n = 3)
| EC50 |
||
|---|---|---|
| NAD | Viability (CyQuant) | |
| nm | ||
| A549 | 2.02 ± 0.1 | 6.2 ± 1.7 |
| Colo205 | 0.54 ± 0.01 | 5.46 ± 2.46 |
| HCT116 | 1.03 ± 0.1 | 1.83 ± 0.35 |
| Calu6 | 2.0 ± 0.03 | 5.23 ± 0.75 |
| HT1080 | 1.05 ± 0.1 | 2.31 ± 0.6 |
| PC3 | 1.05 ± 0.28 | 2.27 ± 0.3 |
Because previous reports indicated that NAMPT inhibition induced apoptosis (19, 20), we initially examined whether caspase-3 was activated in response to NAD depletion. Although significant levels of cell death are found in all six cell lines, activation of caspase-3 is detectable only in A549, Colo205, and HCT116 cells (Fig. 1D), even though all lines are capable of activating caspase-3 in response to staurosporine (Fig. 1E). Moreover, we note that cells with detectable activation of caspase-3 display an increase in cell death over time, whereas cell lines that do not activate caspase-3 show higher levels of a sub-2N population at earlier times (Fig. 1C).
Because PARP is responsible for up to 75% of NAD consumption in a normal resting cell (24), we examined whether inhibition of PARP in these cells could reduce cell death. Inhibition of PARP with the specific inhibitor olaparib (25) did not reduce cell death when combined with GNE-617 (Fig. 1F). In contrast, olaparib could enhance the activity of temozolomide (a DNA alkylating agent) in these cell lines, indicating that this compound inhibits PARP in a functionally relevant assay. Thus, cell death in response to NAMPT inhibition is not influenced by PARP activity.
Rapid Loss of Cell Division and Motility Correlates with Depletion of NAD
We examined the timing of cell growth inhibition of A549, Calu6, HCT116, and PC-3 cells following depletion of NAD. In all cases, cell growth was attenuated within 32–40 h (Fig. 2A and supplemental Movies S1–S4). Moreover, prior to cell growth inhibition, there is a modest but reproducible trend toward elevated cellular confluence that can be attributed to an increase in the cell surface area rather than an increase in cell number (see first 40 h of supplemental Movies S1–S4). To measure cell motility, the change in location for 100 individual cells was tracked hourly for 102 h following exposure to GNE-617. Control A549 and Calu6 cells displayed an average motility of 15.1 ± 1.7 and 10.2 ± 1.1 μm per hour, respectively, whereas cells exposed to GNE-617 show a decrease in motility starting as early as ∼21 h (Fig. 2B), which corresponds to when NAD levels have decreased by >95% (Fig. 1A).
FIGURE 2.

NAD depletion results in broad defects in cell motility and division. A, the indicated cell lines were grown for 138 h ± GNE-617 (200 nm), and cell growth (average confluence) was tracked by live cell imaging (average ± S.D., n = 36 fields of view). The indicated time is the time until maximum confluence for each cell line treated with GNE-617. B, cell motility for A549 and Calu6 cells was measured by tracking the movement of 100 cells over 102 h after treatment with either DMSO or 200 nm GNE-617 using ImageJ/MTrackJ tracking software (average ± S.E., n = 100). C, A549 or Calu6 cells exposed to GNE-617 (200 nm) for various times increased acetylation of α-tubulin-K40 as measured by immunoblot analysis (upper panels show quantification of the bands in the lower immunoblots). The addition of 10 μm NAD at 24 h attenuates this increase in acetylation. D, A549 or Calu6 cells were exposed to DMSO or GNE-617 (200 nm) for 72 h, and in each case 200 cells were tracked over time, and the percentage of cells undergoing cell division is shown. E, each cell line was exposed to DMSO or GNE-617 (200 nm) for 36 h, and the mitotic index was determined by intracellular flow staining to detect phosphorylated histone H3 (Ser10)-positive cells (average ± S.D., n = 3). F, the level of acetyl-histone H3-K9 or DNA (propidium iodide) in HCT116 cells was assessed by intracellular staining after 36 h of exposure to DMSO or 200 nm GNE-617 or after 12 h with either 1 μm VX680, 1 μm trichostatin A (TSA), or 10 μm taxol. G, the level of deacetylated histone H3-K9 and 4 n DNA content (as gated in F) in cells was quantified at various times after the addition of GNE-617 (200 nm) (average ± S.D., n = 3) and after the addition of 10 μm NAD at 24 h.
It has been reported that if cells fail to deacetylate α-tubulin, tubulin dynamics decrease resulting in a corresponding decrease in cell motility and an increase in cell adhesion (26). It was therefore possible that the decreased cell motility caused by NAD depletion could be attributed to the inability of cells to appropriately deacetylate α-tubulin. There was a time-dependent increase in the level of acetylated α-tubulin K-40 in both A549 and Calu6 cells (Fig. 2C), which coincides with a loss of cell motility. The increase in levels of acetylation of α-tubulin K-40 was attenuated by the addition of NAD to cells even after 24 h of incubation with GNE-617 (Fig. 2C), indicating that this effect is driven by reduced NAD levels. Thus, decreased deacetylation of α-tubulin may contribute to the motility defects that are observed as NAD levels are reduced.
The rate of cell division determined by individual cell tracking rapidly decreased within ∼25–28 h for both cell lines (Fig. 2D). Further analysis of all cell lines using flow cytometry to examine cell cycle effects showed a significant decrease in the percentage of mitotic cells (cells positive for phosphorylated histone H3-Ser10) at 36 h following exposure to GNE-617 (Fig. 2E). This correlates with the timing of reduced cell division observed by live cell imaging (Fig. 2D) and also correlates with the timing of significant NAD depletion (Fig. 1A).
Cell progression into mitosis is associated with a reduction in acetylation of histone H3-K9 and a corresponding increase in phosphorylation of the adjacent serine (Ser10) residue (27), suggesting that deacetylation of H3-K9 is required prior to phosphorylation of H3-Ser10. Consistent with this, the mitotic inhibitor taxol (28) dramatically increased the percentage of cells in mitosis with low levels of acetylated H3-K9 (Fig. 2F), whereas trichostatin A, a nonspecific histone deacetylase inhibitor (29), results in hyperacetylation of histone H3-K9. Cells depleted of NAD fail to deacetylate histone H3-K9 and also fail to enter mitosis (Fig. 2, F and G). Interestingly, both SIRT1 and SIRT6 are reported to be NAD-dependent histone H3-K9 deacetylases (30–32), suggesting a link between NAD depletion and reduced entry into mitosis. The addition of NAD to cells even after 24 h of exposure to GNE-617 completely rescued the ability of cells to deacetylate histone H3-K9 (Fig. 2G) and restored mitotic entry (data not shown). Thus, although we observe clear defects in the ability of cells to appropriately deacetylate histone H3-K9 and enter mitosis, we cannot exclude the possibility that a loss of mitotic entry may be driven by other NAD-dependent mechanisms.
NAD Depletion Leads to Loss of ATP and Oncosis
Transmission electron microscopy was used to probe the morphology of cells as they undergo cell death in response to NAD depletion. Cells were exposed to GNE-617 for 72 h and then imaged by transmission electron microscopy. A common phenotype found in the four cell lines examined was the presence of large cell blisters, which are devoid of major organelles (Fig. 3). Cell blisters resemble a morphological feature similar to that seen during oncosis-mediated cell death (33, 34). Moreover, all four cell lines show features consistent with necrosis, which is likely a consequence of cell death caused by oncosis; these morphological features include a translucent cytoplasm with disintegrated plasma membrane and swollen nuclear and endoplasmic reticulum membranes.
FIGURE 3.
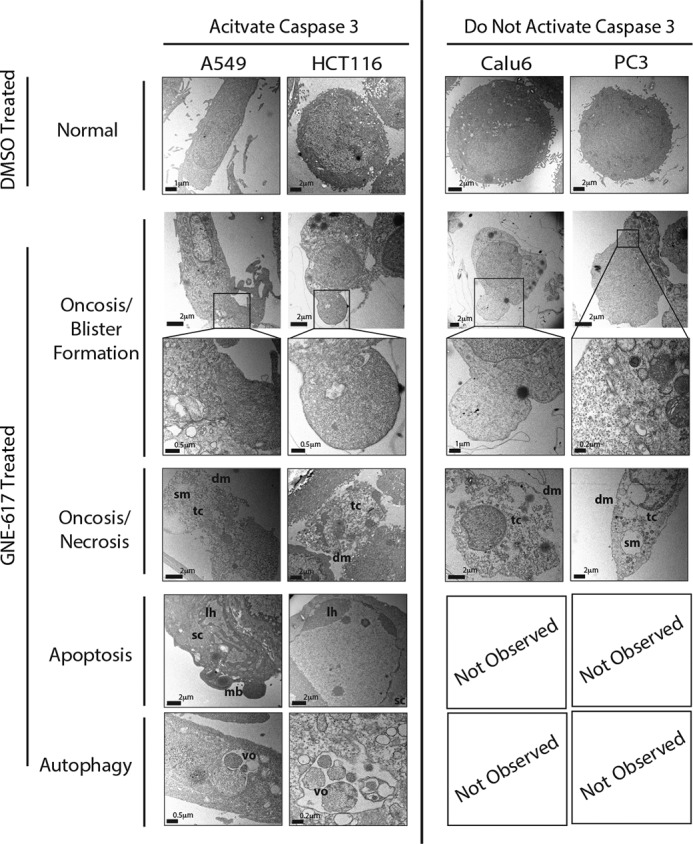
Transmission electron microscopy detects multiple morphological changes associated with NAD depletion. Caspase-3-positive (A549 and HCT116) and capase-3-negative (Calu6 and PC3) cell lines show evidence of oncosis (cell blisters) and necrotic features (translucent cytoplasm (tc), disintegrated plasma membrane (dm), and swollen nuclear/endoplasmic reticulum membranes (sm)) after exposure to GNE617 (200 nm) for 72 h. Apoptotic (smooth dense cytoplasm (sc), lateralized heterochromatin (lh), and membrane budding (mb)) and autophagic (vacuole encapsulated organelles (vo)) phenotypes were seen only in caspase-3-positive lines (A549 and HCT116).
Cell lines that activate caspase-3 in response to NAD depletion (A549 and HCT116) show features consistent with apoptosis (smooth and dense cytoplasm, condensed lateralized heterochromatin, and plasma membrane budding), and these same lines also generate cells with features of autophagy (vacuole encapsulated organelles) (Fig. 3). In contrast, cell lines that do not activate caspase-3 (Calu-6 and PC3) showed no signs of autophagy or apoptosis, but only evidence of necrosis (Fig. 3). Thus, signs of both apoptosis and autophagy were exclusive to cell lines that activate caspase-3.
Live Cell Tracking of Cell Death
To further explore the kinetics of cell death, we tracked cells by live cell imaging for extended periods of time following exposure to GNE-617. This analysis revealed that the majority of cells initially retract membrane extensions, followed rapidly by the appearance of large cell membrane blisters (Fig. 4A and supplemental Movies S5 and S6). To quantify the timing of these morphological changes, single-cell tracking was performed for each cell line (A549, Calu6, HCT116, and PC3) over 102 h following treatment with GNE-617 (Fig. 4B and supplemental Movies S7–S10). The percentage of cells that formed blisters was greater in the two cell lines that do not activate caspase-3 (86 and 97% for Calu6 and PC3, respectively) compared with cell lines that activate caspase-3 (64% for both A549 and HCT116 cell lines) (Fig. 4B). Thus, cell lines that do not activate caspase-3 die predominantly by oncosis after NAD depletion. In contrast, whereas cell lines that activate caspase-3 predominantly die by oncosis, some cells do not show blisters within 102 h (Fig. 4B), suggesting that they form blisters at later times or that they may die by either apoptosis and/or autophagy.
FIGURE 4.

Timing of cell death following NAD depletion. A, representative images of Calu6 cells following treatment with GNE-617 (200 nm) at the indicated times. The withdrawal of membrane extensions (white arrows) is followed by the formation of cell blisters (black arrows). B, for each cell line, 100 individual cells were tracked hourly for 102 h, and the timing of withdrawal of membrane protrusions and formation of blisters are indicated on the graphs. C, cells were exposed to GNE-617 (200 nm) for the indicated times, and ATP levels were determined by CelltiterGlo (average ± S.D., n = 3). D, the average time to depletion of 50% or 95% ATP for cell lines that activate caspase-3 (A549, Colo205, and HCT116) and cell lines that do not activate caspase-3 (Calu6, HT1080 and PC3) was determined. *, p value of <0.025; **, p value of <0.005. E, the average time for cells to display 95% ATP depletion (average ± S.D., n = 3), withdrawal of membrane extensions, and formation of cell blisters are indicated (average ± S.D., n = 100).
Because oncosis is a known consequence of ATP depletion in cells (34, 35), we next examined ATP levels in these cell lines at various times following exposure to GNE-617 to determine the relationship between the timing of ATP depletion and cell death. ATP was reduced significantly later in cell lines that activate caspase-3 compared with cell lines that do not activate caspase-3 (Fig. 4C). The time to 50 and 95% depletion of ATP (t½ and t95%) was significantly different for the two groups of cell lines, with a slower reduction of ATP observed in cell lines that activate caspase-3 (Fig. 4D). In all cell lines, a noticeable drop in ATP levels (>10%) was not observed until NAD had been depleted >95%, suggesting that significant depletion of NAD was required prior to ATP depletion. Moreover, the first morphological change in cells following loss of proliferation is the withdrawal of membrane extensions, which is rapidly followed (an average of 5.3 h later) by the appearance of cell blisters (Fig. 4E). Both of these events occur very rapidly following >95% ATP depletion in each cell line examined.
Cell Death Is Not Dependent on Caspase Activity
Both caspase-3-positive and -negative cell lines displayed a similar decrease in mitochondrial membrane potential over time, although mitochondrial membrane potential was better maintained in caspase-3-positive cell lines at 48 h compared with caspase-3-negative cell lines (Fig. 5A). The timing of the loss of mitochondrial membrane potential correlates with the timing of cell death, because caspase-3 positive cells are slower to lose membrane potential.
FIGURE 5.

Cell death following NAD depletion is not driven by apoptosis. A, the fold change in mitochondrial membrane potential for the indicated cell lines is shown following various treatments. Cells were treated with either GNE-617 (200 nm) for 24, 48, or 72 h; 10 μm rotenone for 3 h; or 50 μm carbonyl cyanide m-chlorophenylhydrazone (CCCP) at the end of the assay (average ± S.D., n = 3). B, HCT116 or PC3 cells were exposed to either DMSO for 72 h; GNE-617 (200 nm) for 24, 48, or 72 h; or 100 nm staurosporin for 12 h (average ± S.D., n = 3). The graph indicates the percentage of BCL2-GFP-positive cells, GFP-negative cells (in the same well), or control vector (VENUS-green) expressing cells that are propidium iodide-positive. *, p value < 0.05.
We next examined whether caspase-3-positive cells were dependent on apoptosis for cell death. Overexpressing the anti-apoptotic BCL-2 protein (36) as a GFP fusion in HCT116 cells (caspase-3-positive) reduced cell death in response to NAD depletion at 48 h compared with nontransfected cells in the same well (GFP-negative) and to control VENUS-green expressing cells in a separate well (Fig. 5B). By 72 h, however, BCL-2 overexpression did not afford any additional protection against cell death. In contrast, BCL-2 overexpression in a caspase-3-negative cell line (PC-3) did not reduce cell death, even at early times. In both cell lines, BCL-2 overexpression attenuated cell death in response to staurosporine. Thus, induction of apoptosis does not appear to drive significant levels of cell death caused by NAD depletion.
Loss of Plasma Membrane Integrity Leads to Cell Blistering
Because cells significantly depleted of cellular ATP (<10% remaining) can form blisters (37), we examined the connection between blister formation and ATP-dependent maintenance of plasma membrane homeostasis. Ouabain, a cardiac glycoside that inhibits the ATP-dependent sodium potassium Na+/K−-ATPase ion exchanger (38), can induce cell blistering (39). When A549 and Calu-6 cells were incubated with ouabain or GNE-617, we found that both compounds induce similar cell blisters (Fig. 6A), suggesting that loss of plasma membrane ion homeostasis may be directly responsible for cell death following NAD depletion. Moreover, the loss of plasma membrane integrity is associated with an increase in intracellular Ca2+ levels (37), and consistent with this, we also determined that intracellular Ca2+ levels increased in all four cell lines following NAD depletion (Fig. 6, B and C).
FIGURE 6.
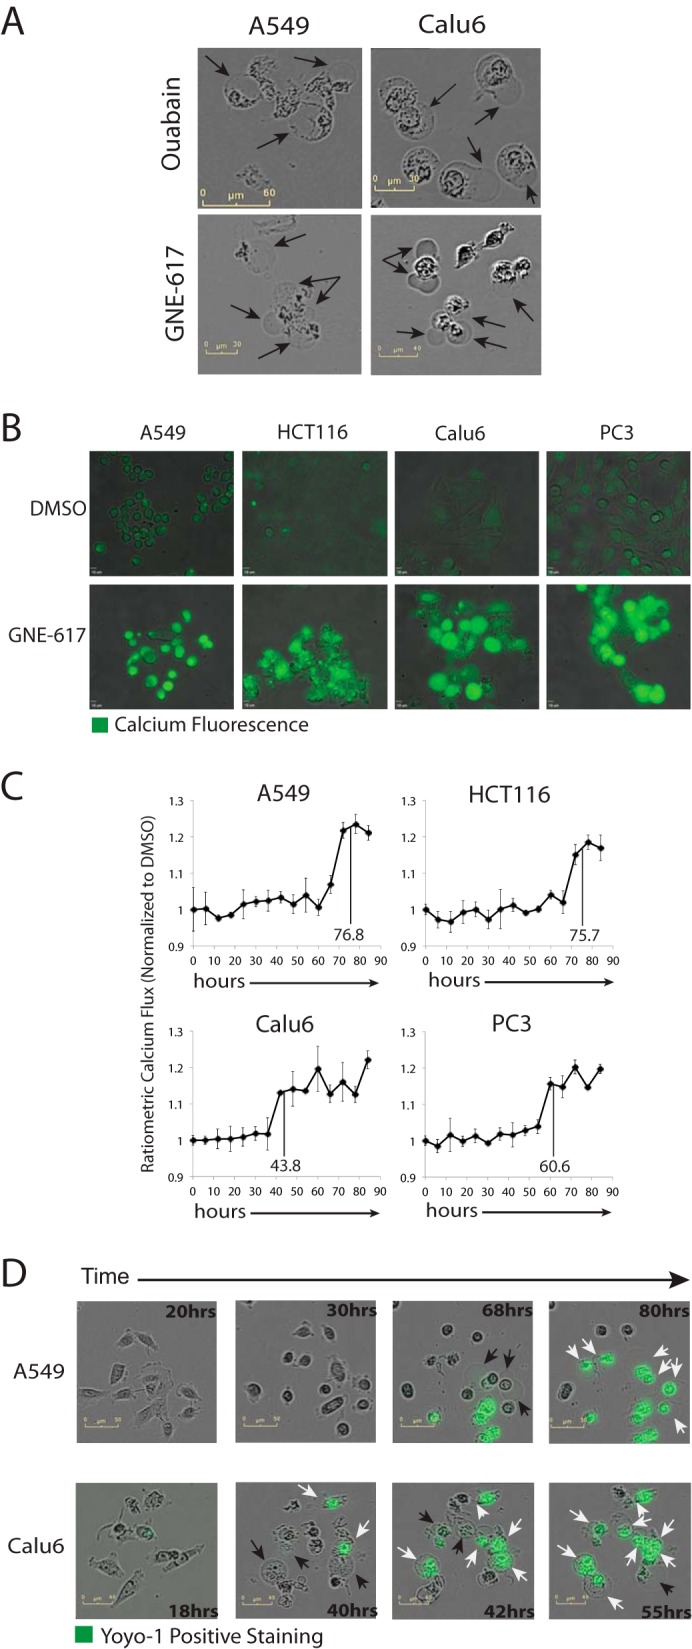
Cell death coincides with loss of Ca2+ homeostasis and plasma membrane integrity. A, disruption of plasma membrane homeostasis with the Na+/K+-ATPase inhibitor ouabain (10 μm for 8 h) induces similar cell blisters (black arrows) as observed following a 72-h exposure to GNE-617. B, representative images of the indicated cell lines stained with Fluo-4 am after treatment with either DMSO or 200 nm GNE-617 for 72 h. C, time-dependent changes in intracellular calcium levels in the indicated cell lines after treatment with GNE-617 (200 nm) relative to control cells (average ± S.D., n = 3). Vertical lines show the average time to the appearance of cell blisters (see Fig. 4E). D, representative images of A549 and Calu6 cells at the indicated times following treatment with GNE-617 (200 nm) in the presence of the green fluorescence yoyo-1 stain. Cells with blisters that are yoyo-1-negative are indicated with black arrows, whereas cells with blisters that are yoyo-1-positive are indicated with white arrows.
To determine whether cell blister formation correlates with a loss of cell membrane integrity, yoyo-1 was utilized as a cell-impermeable agent that fluoresces upon DNA binding. During live cell imaging in the presence of yoyo-1, cells only stained yoyo-1-positive after they formed blisters (Fig. 6D and supplemental Movies S11 and S12), indicating that blister formation precedes loss of plasma membrane integrity. Interestingly, in A549 cells, which can activate caspase-3, a minor population of yoyo-1-positive cells without blisters is observed, suggesting that these cells may undergo cell death either by apoptosis or autophagy.
DISCUSSION
Inhibition of NAMPT leads to rapid depletion of cellular NAD levels, induces cell death, and is an attractive and novel therapeutic strategy in oncology. Even though there are many reports documenting that NAMPT inhibition leads to apoptosis and autophagy, it is not clear whether these pathways are activated in a cell type-specific manner or whether they significantly contribute to cell death. Here we provide a comprehensive analysis of the effects of NAD depletion in cells, and our data reveal a complex series of events leading to cell death (Fig. 7). Surprisingly, even though we identify cell lines that display signs of apoptosis and autophagy in response to NAD depletion, the primary mechanism of cell death in all solid tumor cell lines examined is oncosis caused by ATP depletion.
FIGURE 7.
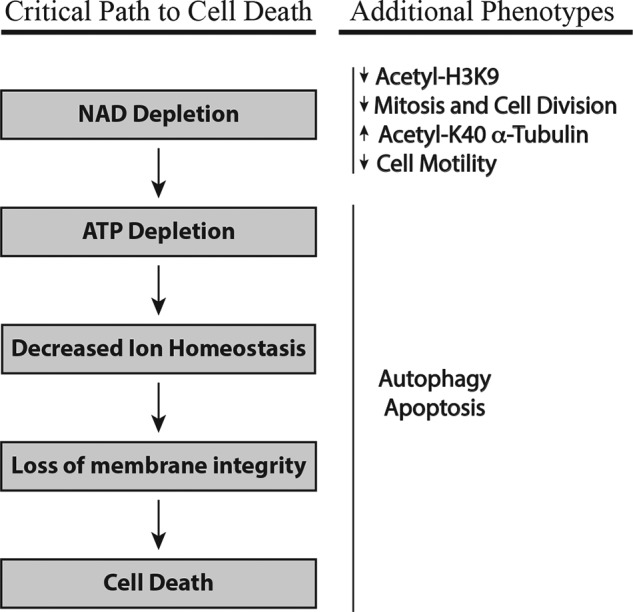
Sequence of events lead to cell death following NAD depletion. Shown are the critical events that directly lead to cell death and the additional phenotypes that are observed during this process. See text for details.
No significant effect on cell proliferation was observed until NAD levels were significantly depleted by ∼>95%, at which time there is a rapid reduction in cell motility. This observation is consistent with previous reports implicating NAMPT in modulating cell motility. For example, inhibition of NAMPT reduced migration of U251 cells in barrier migration assays (40), and in an independent study NAMPT localized to lamellipodia of smooth vascular muscle cells and was required for directional migration and lamellipodium anchoring (41). The acetylation of α-tubulin as a key component of the cell microtubule network restricts tubulin depolymerization and therefore decreases both tubulin dynamics and cell motility (26). NAD is implicated in the regulation of cell motility via SIRT2, an NAD utilizing α-tubulin deacetylating enzyme (42), which colocalizes with the histone deacetylase 6, which was also shown to deacetylate α-tubulin (26). Depletion of cellular NAD levels in our study resulted in hyperacetylation of α-tubulin in A549 and Calu6 cells, which occurred with similar kinetics as observed for the loss of cell motility. Thus, reduction of cell motility may in part be due to the inability of cells to appropriately deacetylate α-tubulin.
A reduced mitotic index is also linked with the inability of cells to deacetylate histone H3-K9, and there is evidence indicating that acetylation of histone H3-K9 is mutually exclusive with phosphorylation of histone H3-Ser10 (27), a marker of mitosis. Both SIRT1 and SIRT6 can deacetylate histone H3-K9 (30, 32), although recent data suggest that the primary function of SIRT6 may be directed toward fatty acid deacetylation (43). Thus, although it is intriguing to speculate that lack of deacetylation of histone H3-K9 caused by NAD depletion may directly contribute to the inability of cells to progress into mitosis, it is also plausible that this site remains highly acetylated because of a G2/M cell cycle blockade induced by other effects of NAD depletion.
The observation that caspase-3 activation only occurred in some cell lines suggested that these cell lines might undergo cell death primarily mediated by apoptosis. Multiple lines of evidence suggest this is not the case. First, live cell tracking of HCT116 and A549 cells (both of which activate caspase-3) revealed that the majority of cells showed evidence of oncosis (64%). Thus, whereas apoptosis is clearly not the dominant pathway leading to cell death in these cells, some cells may still utilize apoptosis. Second, overexpression of BCL-2, an anti-apoptotic protein (36), reduced cell death at early, but not at later times in the caspase-3-activating HCT116 cell line. Third, the pan-caspase inhibitor Z-VAD-fmk did not reduce cell death (data not shown). Thus, whereas apoptosis is clearly not a dominant pathway leading to cell death in these cells, some cells may utilize this pathway because cells with signs of apoptosis were observed by electron microscopy.
The timing of loss of membrane potential correlates with loss of cellular ATP. NAD depletion in cell lines that did not result in caspase-3 activation had a more rapid and dramatic reduction of ATP levels and mitochondrial integrity, because mitochondrial membrane potential decreased more rapidly in these cell lines. Thus, decreased ATP levels may drive a loss of mitochondrial membrane integrity.
ATP is a critical component for the execution of apoptosis (44, 45), and it has been shown that low ATP levels can switch cells from undergoing apoptosis to necrosis (46). Thus, it is possible that a rapid loss of ATP following NAD depletion may reduce the ability of cells to promote apoptosis. Consistent with this, cell lines that do not activate caspase-3 in response to NAD depletion (Calu6 and PC3) deplete cellular ATP levels significantly faster than cells that activate caspase-3 (A549 and HCT116). Cell lines that are slower to deplete ATP levels (A549 and HCT116) also display elevated growth rates (as measured by the rate of confluency; Fig. 2A). Thus, these cell lines may have a requirement for elevated energy generation that is necessary to meet the increased energy demands associated with faster growth. Cell lines that are slower to deplete ATP also display signs of the energy recycling system of autophagy, which may contribute, in part, to a delay in ATP depletion. ATP is critical for the execution of apoptosis (44, 45), and once ATP levels are depleted, the cells can switch from undergoing apoptosis to necrosis (46). Thus, it is possible that a more rapid loss of ATP following NAD depletion in Calu-6 and PC3 cell lines reduces the ability of these cell lines to maintain ATP levels at sufficient levels to drive caspase-3 activation and apoptosis.
In all cell lines, a noticeable drop in ATP levels (>10%) was not observed until NAD had been depleted >90%, suggesting that cells do not require significant levels of NAD to sustain ATP production. However, once NAD levels are depleted below a threshold of ∼>90%, ATP levels start to decrease, and this is likely due to reduced carbon flux through the key energy-generating metabolic pathways (5, 7). A previous study showed that cells can survive with a little as 3% of their normal NAD levels, emphasizing that low levels of NAD are sufficient to sustain cell viability (47), and a similar observation was recently made in a xenograft tumor model, which showed that ∼10% of normal NAD levels are sufficient to drive robust tumor growth (48). As ATP levels decrease, cells lose the ability to appropriately modulate plasma membrane ion balance and undergo oncosis mediated cell death. Although yoyo-1-positive cells predominantly showed evidence of cell blisters, cell lines that activate caspase-3 (A549 and HCT116) contained ∼36% of cells that did not form blisters, which suggests that these cells may utilize additional cell death pathway(s), such as apoptosis or autophagy. Alternatively, they may undergo oncosis at later times (>102 h).
Thus, our data demonstrate that NAD depletion leads to both an early and a late cellular response. A drop in NAD, which drives the loss of cell proliferation and motility, characterizes the early phase response; at this stage, there is no obvious reduction in cell viability. The late phase response correlates with the loss of ATP, which leads to the inability of cells to maintain membrane homeostasis caused by defects in regulation of ion pumps and directly results in oncosis-mediated cell death.
Supplementary Material
Acknowledgments
We thank Xiaorong Liang and Min (Mindy) Gao for assistance with mass spectrometry analysis; the Genentech gCell group (Richard Neve, Suresh Selvaraj, and Mamie Yu) for cell line maintenance; Mary Ludlam and Dan Anderson for the BCL2-GFP expressing plasmid; and Sohiel Memarsadeghi of Essen Bioscience for assistance in identifying the accessible mobility tracking ImageJ64 software with MTrackJ plugin application.
All authors are or were full-time employees of Genentech.

This article contains supplemental Movies S1–S12.
- NAMPT
- nicotinamide phosphoribosyl transferase
- PARP
- poly-ADP-ribose polymerase.
REFERENCES
- 1. Bogan K. L., Brenner C. (2008) Nicotinic acid nicotinamide and nicotinamide riboside: a molecular evaluation of NAD+ precursor vitamins in human nutrition. Annu. Rev. Nutr. 28, 115–130 [DOI] [PubMed] [Google Scholar]
- 2. Hasmann M., Schemainda I. (2003) FK866, a highly specific noncompetitive inhibitor of nicotinamide phosphoribosyltransferase, represents a novel mechanism for induction of tumor cell apoptosis. Cancer Res. 63, 7436–7442 [PubMed] [Google Scholar]
- 3. Olesen U. H., Christensen M. K., Björkling F., Jäättelä M., Jensen P. B., Sehested M., Nielsen S. J. (2008) Anticancer agent CHS-828 inhibits cellular synthesis of NAD. Biochem. Biophys. Res. Commun. 367, 799–804 [DOI] [PubMed] [Google Scholar]
- 4. Watson M., Roulston A., Bélec L., Billot X., Marcellus R., Bédard D., Bernier C., Branchaud S., Chan H., Dairi K., Gilbert K., Goulet D., Gratton M. O., Isakau H., Jang A., Khadir A., Koch E., Lavoie M., Lawless M., Nguyen M., Paquette D., Turcotte E., Berger A., Mitchell M., Shore G. C., Beauparlant P. (2009) The small molecule GMX1778 is a potent inhibitor of NAD+ biosynthesis: strategy for enhanced therapy in nicotinic acid phosphoribosyltransferase 1-deficient tumors. Mol. Cell. Biol. 29, 5872–5888 [DOI] [PMC free article] [PubMed] [Google Scholar]
- 5. Xiao Y., Elkins K., Durieux J. K., Lee L., Oeh J., Yang L. X., Liang X., DelNagro C., Tremayne J., Kwong M., Liederer B. M., Jackson P. K., Belmont L. D., Sampath D., O'Brien T. (2013) Dependence of tumor cell lines and patient derived tumors on the NAD salvage pathway renders them sensitive to NAMPT inhibition with GNE-618. Neoplasia 15, 1151–1160 [DOI] [PMC free article] [PubMed] [Google Scholar]
- 6. Zheng X., Bauer P., Baumeister T., Buckmelter A. J., Caligiuri M., Clodfelter K. H., Han B., Ho Y. C., Kley N., Lin J., Reynolds D. J., Sharma G., Smith C. C., Wang Z., Dragovich P. S., Gunzner-Toste J., Liederer B. M., Ly J., O'Brien T., Oh A., Wang L., Wang W., Xiao Y., Zak M., Zhao G., Yuen P. W., Bair K. W. (2013) Structure-based discovery of novel nicotinamide phosphoribosyltransferase (Nampt) inhibitors. J. Med. Chem. 56, 6413–6433 [DOI] [PubMed] [Google Scholar]
- 7. Tan B., Young D. A., Lu Z. H., Wang T., Meier T. I., Shepard R. L., Roth K., Zhai Y., Huss K., Kuo M. S., Gillig J., Parthasarathy S., Burkholder T. P., Smith M. C., Geeganage S., Zhao G. (2013) Pharmacological inhibition of nicotinamide phosphoribosyltransferase (NAMPT), an enzyme essential for NAD+ biosynthesis, in human cancer cells: metabolic basis and potential clinical implications. J. Biol. Chem. 288, 3500–3511 [DOI] [PMC free article] [PubMed] [Google Scholar]
- 8. Bowlby S. C., Thomas M. J., D'Agostino R. B., Jr., Kridel S. J. (2012) Nicotinamide phosphoribosyl transferase (Nampt) is required for de novo lipogenesis in tumor cells. PLoS One 7, e40195. [DOI] [PMC free article] [PubMed] [Google Scholar]
- 9. Ying W. (2008) NAD+/NADH and NADP+/NADPH in cellular functions and cell death: regulation and biological consequences. Antioxid. Redox Signal. 10, 179–206 [DOI] [PubMed] [Google Scholar]
- 10. Hirst J. (2010) Towards the molecular mechanism of respiratory complex I. Biochem. J. 425, 327–339 [DOI] [PubMed] [Google Scholar]
- 11. Luo X., Kraus W. L. (2012) On PAR with PARP: cellular stress signaling through poly(ADP-ribose) and PARP-1. Genes Dev. 26, 417–432 [DOI] [PMC free article] [PubMed] [Google Scholar]
- 12. Berger N. A., Berger S. J. (1986) Metabolic consequences of DNA damage: the role of poly(ADP-ribose) polymerase as mediator of the suicide response. Basic Life Sci. 38, 357–363 [DOI] [PubMed] [Google Scholar]
- 13. Berger N. A. (1985) Poly(ADP-ribose) in the cellular response to DNA damage. Radiat. Res. 101, 4–15 [PubMed] [Google Scholar]
- 14. Berger N. A., Sims J. L., Catino D. M., Berger S. J. (1983) Poly(ADP-ribose) polymerase mediates the suicide response to massive DNA damage: studies in normal and DNA-repair defective cells. Princess Takamatsu Symp. 13, 219–226 [PubMed] [Google Scholar]
- 15. Knight J. R., Milner J. (2012) SIRT1, metabolism and cancer. Curr. Opin. Oncol. 24, 68–75 [DOI] [PubMed] [Google Scholar]
- 16. Peck B., Chen C. Y., Ho K. K., Di Fruscia P., Myatt S. S., Coombes R. C., Fuchter M. J., Hsiao C. D., Lam E. W. (2010) SIRT inhibitors induce cell death and p53 acetylation through targeting both SIRT1 and SIRT2. Mol. Cancer Ther. 9, 844–855 [DOI] [PubMed] [Google Scholar]
- 17. Nakahata Y., Kaluzova M., Grimaldi B., Sahar S., Hirayama J., Chen D., Guarente L. P., Sassone-Corsi P. (2008) The NAD+-dependent deacetylase SIRT1 modulates CLOCK-mediated chromatin remodeling and circadian control. Cell 134, 329–340 [DOI] [PMC free article] [PubMed] [Google Scholar]
- 18. Galluzzi L., Vitale I., Abrams J. M., Alnemri E. S., Baehrecke E. H., Blagosklonny M. V., Dawson T. M., Dawson V. L., El-Deiry W. S., Fulda S., Gottlieb E., Green D. R., Hengartner M. O., Kepp O., Knight R. A., Kumar S., Lipton S. A., Lu X., Madeo F., Malorni W., Mehlen P., Nuñez G., Peter M. E., Piacentini M., Rubinsztein D. C., Shi Y., Simon H. U., Vandenabeele P., White E., Yuan J., Zhivotovsky B., Melino G., Kroemer G. (2012) Molecular definitions of cell death subroutines: recommendations of the Nomenclature Committee on Cell Death 2012. Cell Death Differ. 19, 107–120 [DOI] [PMC free article] [PubMed] [Google Scholar]
- 19. Cerna D., Li H., Flaherty S., Takebe N., Coleman C. N., Yoo SS. (2012) Inhibition of nicotinamide phosphoribosyltransferase (NAMPT) activity by small molecule GMX1778 regulates reactive oxygen species (ROS)-mediated cytotoxicity in a p53- and nicotinic acid phosphoribosyltransferase1 (NAPRT1)-dependent manner. J. Biol. Chem. 287, 22408–22417 [DOI] [PMC free article] [PubMed] [Google Scholar]
- 20. Bi T. Q., Che X. M., Liao X. H., Zhang D. J., Long H. L., Li H. J., Zhao W. (2011) Overexpression of Nampt in gastric cancer and chemopotentiating effects of the Nampt inhibitor FK866 in combination with fluorouracil. Oncol. Rep. 26, 1251–1257 [DOI] [PubMed] [Google Scholar]
- 21. Billington R. A., Travelli C., Ercolano E., Galli U., Roman C. B., Grolla A. A., Canonico P. L., Condorelli F., Genazzani AA. (2008) Characterization of NAD uptake in mammalian cells. J. Biol. Chem. 283, 6367–6374 [DOI] [PubMed] [Google Scholar]
- 22. Cea M., Cagnetta A., Fulciniti M., Tai Y. T., Hideshima T., Chauhan D., Roccaro A., Sacco A., Calimeri T., Cottini F., Jakubikova J., Kong S. Y., Patrone F., Nencioni A., Gobbi M., Richardson P., Munshi N., Anderson KC. (2012) Targeting NAD+ salvage pathway induces autophagy in multiple myeloma cells via mTORC1 and extracellular signal-regulated kinase (ERK1/2) inhibition. Blood 120, 3519–3529 [DOI] [PMC free article] [PubMed] [Google Scholar]
- 23. Pollard S. M., Yoshikawa K., Clarke I. D., Danovi D., Stricker S., Russell R., Bayani J., Head R., Lee M., Bernstein M., Squire J. A., Smith A., Dirks P. (2009) Glioma stem cell lines expanded in adherent culture have tumor-specific phenotypes and are suitable for chemical and genetic screens. Cell Stem Cell 4, 568–580 [DOI] [PubMed] [Google Scholar]
- 24. Carson D. A., Seto S., Wasson D. B. (1987) Pyridine nucleotide cycling and poly(ADP-ribose) synthesis in resting human lymphocytes. J. Immunol. 138, 1904–1907 [PubMed] [Google Scholar]
- 25. Menear K. A., Adcock C., Boulter R., Cockcroft X. L., Copsey L., Cranston A., Dillon K. J., Drzewiecki J., Garman S., Gomez S., Javaid H., Kerrigan F., Knights C., Lau A., Loh VM, Jr, Matthews I. T., Moore S., O'Connor M. J., Smith G. C., Martin NM. (2008) 4-[3-(4-cyclopropanecarbonylpiperazine-1-carbonyl)-4-fluorobenzyl]-2H-phthalazin-1-one: a novel bioavailable inhibitor of poly(ADP-ribose) polymerase-1. J. Med. Chem. 51, 6581–6591 [DOI] [PubMed] [Google Scholar]
- 26. Tran A. D., Marmo T. P., Salam A. A., Che S., Finkelstein E., Kabarriti R., Xenias H. S., Mazitschek R., Hubbert C., Kawaguchi Y., Sheetz M. P., Yao T. P., Bulinski JC. (2007) HDAC6 deacetylation of tubulin modulates dynamics of cellular adhesions. J. Cell Sci. 120, 1469–1479 [DOI] [PubMed] [Google Scholar]
- 27. Jeong Y. S., Cho S., Park J. S., Ko Y., Kang Y. K. (2010) Phosphorylation of serine-10 of histone H3 shields modified lysine-9 selectively during mitosis. Genes Cells 15, 181–192 [DOI] [PubMed] [Google Scholar]
- 28. Jordan M. A., Wilson L. (2004) Microtubules as a target for anticancer drugs. Nat. Rev. Cancer 4, 253–265 [DOI] [PubMed] [Google Scholar]
- 29. Yoshida M., Horinouchi S., Beppu T. (1995) Trichostatin A and trapoxin: novel chemical probes for the role of histone acetylation in chromatin structure and function. BioEssays 17, 423–430 [DOI] [PubMed] [Google Scholar]
- 30. Kawahara T. L., Michishita E., Adler A. S., Damian M., Berber E., Lin M., McCord R. A., Ongaigui K. C., Boxer L. D., Chang H. Y., Chua KF. (2009) SIRT6 links histone H3 lysine 9 deacetylation to NF-κB-dependent gene expression and organismal life span. Cell 136, 62–74 [DOI] [PMC free article] [PubMed] [Google Scholar]
- 31. Michishita E., McCord R. A., Berber E., Kioi M., Padilla-Nash H., Damian M., Cheung P., Kusumoto R., Kawahara T. L., Barrett J. C., Chang H. Y., Bohr V. A., Ried T., Gozani O., Chua KF. (2008) SIRT6 is a histone H3 lysine 9 deacetylase that modulates telomeric chromatin. Nature 452, 492–496 [DOI] [PMC free article] [PubMed] [Google Scholar]
- 32. Vaquero A., Scher M., Lee D., Erdjument-Bromage H., Tempst P., Reinberg D. (2004) Human SirT1 interacts with histone H1 and promotes formation of facultative heterochromatin. Mol. Cell 16, 93–105 [DOI] [PubMed] [Google Scholar]
- 33. Majno G., Joris I. (1995) Apoptosis, oncosis, and necrosis: an overview of cell death. Am. J. Pathol. 146, 3–15 [PMC free article] [PubMed] [Google Scholar]
- 34. Weerasinghe P., Buja L. M. (2012) Oncosis: an important non-apoptotic mode of cell death. Exp. Mol. Pathol. 93, 302–308 [DOI] [PubMed] [Google Scholar]
- 35. Trump B. F., Berezesky I. K., Chang S. H., Phelps P. C. (1997) The pathways of cell death: oncosis, apoptosis, and necrosis. Toxicol. Pathol. 25, 82–88 [DOI] [PubMed] [Google Scholar]
- 36. García-Sáez A. J. (2012) The secrets of the Bcl-2 family. Cell Death Differ. 19, 1733–1740 [DOI] [PMC free article] [PubMed] [Google Scholar]
- 37. Jurkowitz-Alexander M. S., Altschuld R. A., Hohl C. M., Johnson J. D., McDonald J. S., Simmons T. D., Horrocks LA. (1992) Cell swelling, blebbing, and death are dependent on ATP depletion and independent of calcium during chemical hypoxia in a glial cell line (ROC-1). J. Neurochem. 59, 344–352 [DOI] [PubMed] [Google Scholar]
- 38. Nesher M., Shpolansky U., Rosen H., Lichtstein D. (2007) The digitalis-like steroid hormones: new mechanisms of action and biological significance. Life Sci. 80, 2093–2107 [DOI] [PubMed] [Google Scholar]
- 39. Orlov S. N., Hamet P. (2004) Apoptosis vs. oncosis: role of cell volume and intracellular monovalent cations. Adv. Exp. Med. Biol. 559, 219–233 [DOI] [PubMed] [Google Scholar]
- 40. van Horssen R., Willemse M., Haeger A., Attanasio F., Güneri T., Schwab A., Stock C. M., Buccione R., Fransen J. A., Wieringa B. (2013) Intracellular NAD(H) levels control motility and invasion of glioma cells. Cell. Mol. Life Sci. 70, 2175–2190 [DOI] [PMC free article] [PubMed] [Google Scholar]
- 41. Yin H., van der Veer E., Frontini M. J., Thibert V., O'Neil C., Watson A., Szasz P., Chu M. W., Pickering JG. (2012) Intrinsic directionality of migrating vascular smooth muscle cells is regulated by NAD+ biosynthesis. J. Cell Sci. 125, 5770–5780 [DOI] [PubMed] [Google Scholar]
- 42. North B. J., Marshall B. L., Borra M. T., Denu J. M., Verdin E. (2003) The human Sir2 ortholog, SIRT2, is an NAD+-dependent tubulin deacetylase. Mol. Cell 11, 437–444 [DOI] [PubMed] [Google Scholar]
- 43. Jiang H., Khan S., Wang Y., Charron G., He B., Sebastian C., Du J., Kim R., Ge E., Mostoslavsky R., Hang H. C., Hao Q., Lin H. (2013) SIRT6 regulates TNF-α secretion through hydrolysis of long-chain fatty acyl lysine. Nature 496, 110–113 [DOI] [PMC free article] [PubMed] [Google Scholar]
- 44. Chiarugi A. (2005) Simple but not simpler: toward a unified picture of energy requirements in cell death. FASEB J. 19, 1783–1788 [DOI] [PubMed] [Google Scholar]
- 45. Nicotera P., Melino G. (2004) Regulation of the apoptosis-necrosis switch. Oncogene 23, 2757–2765 [DOI] [PubMed] [Google Scholar]
- 46. Leist M., Single B., Castoldi A. F., Kühnle S., Nicotera P. (1997) Intracellular adenosine triphosphate (ATP) concentration: a switch in the decision between apoptosis and necrosis. J. Exp. Med. 185, 1481–1486 [DOI] [PMC free article] [PubMed] [Google Scholar]
- 47. Chatterjee S., Hirschler N. V., Petzold S. J., Berger S. J., Berger N. A. (1989) Mutant cells defective in poly(ADP-ribose) synthesis due to stable alterations in enzyme activity or substrate availability. Exp. Cell Res. 184, 1–15 [DOI] [PubMed] [Google Scholar]
- 48. O'Brien T., Oeh J., Xiao Y., Liang X., Vanderbilt A., Qin A., Yang L., Lee L. B., Ly J., Cosino E., LaCap J. A., Ogasawara A., Williams S., Nannini M., Liederer B. M., Jackson P., Dragovich P. S., Sampath D. (2013) Supplementation of nicotinic acid with NAMPT inhibitors resutls in loss of in vivo efficacy in NAPRT1-deficient tumor models. Neoplasia 15, 1314–1329 [DOI] [PMC free article] [PubMed] [Google Scholar]
Associated Data
This section collects any data citations, data availability statements, or supplementary materials included in this article.