

ABSTRACT
The vertebrate intestine is home to microbial ecosystems that play key roles in host development and health. Little is known about the spatial and temporal dynamics of these microbial communities, limiting our understanding of fundamental properties, such as their mechanisms of growth, propagation, and persistence. To address this, we inoculated initially germ-free zebrafish larvae with fluorescently labeled strains of an Aeromonas species, representing an abundant genus in the zebrafish gut. Using light sheet fluorescence microscopy to obtain three-dimensional images spanning the gut, we quantified the entire bacterial load, as founding populations grew from tens to tens of thousands of cells over several hours. The data yield the first ever measurements of the growth kinetics of a microbial species inside a live vertebrate intestine and show dynamics that robustly fit a logistic growth model. Intriguingly, bacteria were nonuniformly distributed throughout the gut, and bacterial aggregates showed considerably higher growth rates than did discrete individuals. The form of aggregate growth indicates intrinsically higher division rates for clustered bacteria, rather than surface-mediated agglomeration onto clusters. Thus, the spatial organization of gut bacteria both relative to the host and to each other impacts overall growth kinetics, suggesting that spatial characterizations will be an important input to predictive models of host-associated microbial community assembly.
IMPORTANCE
Our intestines are home to vast numbers of microbes that influence many aspects of health and disease. Though we now know a great deal about the constituents of the gut microbiota, we understand very little about their spatial structure and temporal dynamics in humans or in any animal: how microbial populations establish themselves, grow, fluctuate, and persist. To address this, we made use of a model organism, the zebrafish, and a new optical imaging technique, light sheet fluorescence microscopy, to visualize for the first time the colonization of a live, vertebrate gut by specific bacteria with sufficient resolution to quantify the population over a range from a few individuals to tens of thousands of bacterial cells. Our results provide unprecedented measures of bacterial growth kinetics and also show the influence of spatial structure on bacterial populations, which can be revealed only by direct imaging.
INTRODUCTION
Recent studies of the microbiota associated with humans and other animals have transformed our understanding of development (1–3), complex diseases (4–7), and a wide range of physiological functions (8–13). These new insights, however, bring with them perplexing questions about the establishment of microbial communities. What drives the large variation in community composition observed between individuals (12, 14)? Are the population dynamics of a commensal species intrinsic to the species or contingent on its spatial structure, the presence of other species, or its colonization history? More broadly, how can we model gut ecosystems? An understanding of microbial growth kinetics and growth modes is a necessary ingredient for predictive models of host-microbe systems. Such dynamics, however, are largely opaque to conventional approaches, which rely on high-throughput sequencing to characterize the makeup of commensal communities. While such metagenomic lenses are powerful, they provide coarse spatial and temporal information. Little is known about how microbial populations grow and distribute themselves, especially over time scales commensurate with dynamic processes such as microbial cell division and migration.
To begin to understand the dynamics of the microbiome, we make use of larval zebrafish, raised germ-free (15) and subsequently exposed to the bacterium Aeromonas veronii. Like humans and other animals, zebrafish are home to a numerous and diverse intestinal microbial community (16), whose presence influences immune function (17), epithelial cell differentiation (3, 18), and other processes (19). The optical transparency of larval zebrafish and the ability to engineer gut microbiota expressing fluorescent proteins make possible controlled experiments that involve live imaging of intestinal communities (20). In other gnotobiotic model organisms, such as mice, interrogation of gut contents can be done only by dissection, which yields single-time-point data, or fecal samples, which only approximate the actual gut contents. Zebrafish, in contrast, offer a system in which one can monitor the spatial and temporal characteristics of the microbes of the gastrointestinal tract in a living organism. Aeromonas veronii is a well-characterized (21) microbe of a genus naturally found in the zebrafish gut and a phylum that numerically dominates the zebrafish intestinal community (16). A. veronii was isolated from leech (22) and serves as a model Aeromonas species due to its genetic tractability. In addition to robustly colonizing the zebrafish intestine, mono-association of zebrafish with A. veronii is sufficient to restore multiple traits of conventional animals in initially germfree fish (3, 17).
The several-hundred-micron extent of the larval zebrafish gut, the high speed of bacterial motility, the frequency of peristaltic motions, and the many-hour duration of microbial colonization present challenges to live imaging. We overcome these issues using light sheet fluorescence microscopy (23) (also known as selective plane illumination microscopy [SPIM]), whose speed per three-dimensional (3D) image, large field of view, and low phototoxicity have enabled systems-level imaging of a wide variety of biological targets in recent years (24–31). Using SPIM, we are able to quantify the bacterial population of the zebrafish intestine during early colonization over a range spanning single microbes to tens of thousands, while also mapping its spatial distribution. Furthermore, we are able to distinguish both discrete individual bacteria and multicellular clusters, and also measure the growth dynamics of these two subpopulations.
We find that during its initial colonization of the zebrafish intestine, A. veronii exhibits a robust population increase characteristic of resource-limited growth, but with clusters of bacteria showing a considerably higher growth rate than individual bacteria. The functional form of the subpopulations reveal that the enhanced cluster growth is not surface mediated but rather is likely driven by an intrinsically higher division rate for clustered microbes. We further observe that microbes are not randomly distributed in the gut but rather are preferentially localized to particular regions. These findings demonstrate the existence of heterogeneity in both growth modes and growth locations that can serve as inputs to future models of gut communities and also lay the foundations for spatially resolved studies of interspecies interactions.
RESULTS
Bacterial growth kinetics.
To explore the dynamics of early microbial colonization of the zebrafish gut (Fig. 1A), we inoculated germ-free larval zebrafish at 5 days post-fertilization (dpf) with enhanced green fluorescent protein (EGFP)-expressing A. veronii by introducing the bacteria to flasks containing free-swimming larvae (see Materials and Methods). Beginning approximately 1 h (50 to 75 min) after the start of inoculation, zebrafish were imaged (n = 5 fish) using light sheet fluorescence microscopy at 25-minute intervals for up to 16 h.
FIG 1 .
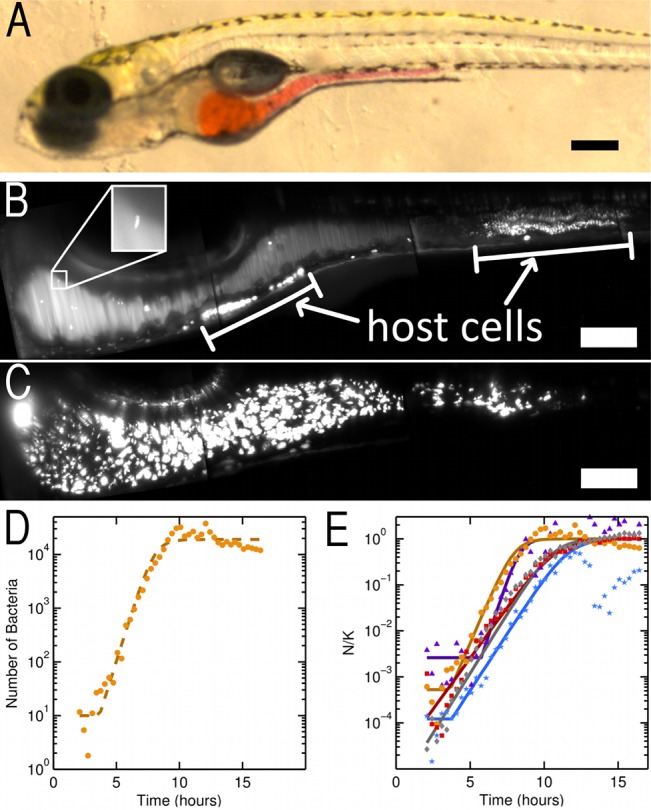
(A) Image of a larval zebrafish at 5 days post-fertilization, with the extent of the intestine shown by a microgavage (56) of phenol red dye. Scale bar, 250 µm. (B) Maximum intensity projection (MIP) at 1.6 h post-inoculation with Aeromonas veronii. Several individual bacteria are visible, and the inset shows a magnified view of a single bacterium (inset width, 22 µm). White bars indicate autofluorescent sources from the zebrafish host. Scale bar, 100 µm. (C) MIP at 9.1 h post-inoculation (same fish as that shown in panel B), showing a large bacterial population. Scale bar, 100 µm. (A to C) Orientation of the images is anterior to the left and dorsal to the top of the panel. (D) Quantification of bacterial load over time in an individual fish (same fish as shown in panels B and C). The dashed line shows a best fit to a logistic growth model. (E) Quantification of bacterial load for all fish imaged from this clutch of siblings (n = 5 fish). The vertical axis gives the population (N) rescaled by the fitted carrying capacity (K). Time is measured from the moment of inoculation. Solid curves show the best fit of each sample to a logistic growth model. (B and C) Images are composites of multiple fields of view.
Bacterial populations were quantified from fluorescence images as detailed in Materials and Methods. In principle, bacteria detected by fluorescence need not be living, viable cells (32, 33). In separate fish, we therefore directly compared estimates of the intestinal bacterial population from our fluorescence imaging-based approach with plating-based measurements of colony forming units (CFU) from larval intestines dissected shortly after imaging. The latter method will report only viable cells. The two population estimates give similar values and show a roughly linear relationship with each other, with a proportionality close to 1, indicating that fluorescence microscopy is predominantly capturing signals from live bacteria (see Fig. S1 in the supplemental material). An extended discussion is provided in the text in the supplemental material.
The rapid start and long duration of imaging post-inoculation allowed quantification of intestinal bacterial populations that initiated with a few founding bacteria (Fig. 1B) and grew to many thousands (Fig. 1C; see also Video S1 in the supplemental material). The bacterial populations robustly exhibit dynamics typical of resource-limited growth (34), with a lag phase of 1.6 ± 1.7 h (mean ± standard deviation [SD]) followed by an exponential phase and an apparent stationary phase when carrying capacity is reached (Fig. 1D and E). The stability of the population during lag phase suggests that there is negligible further bacterial influx into the intestine from the mouth or esophagus during the imaging period while the fish were mounted in agar, allowing population growth during imaging to be attributed to division of the initial colonizers and not immigration of new individuals. We find that the bacterial number (N) as a function of time (t) is well fit by a simple logistic growth model:
where r is the intrinsic growth rate and K is the carrying capacity of the gut. The measured growth rate is r = 1.5 ± 0.5 h−1 (mean ± SD), corresponding to a doubling time of 28 ± 9 min (mean ± SD). The carrying capacity is highly variable among fish, ranging from K = 1.9 × 10⁴ to 2.4 × 10⁵ in the specimens examined. However, rescaling the population size by K collapses the data measured in different zebrafish hosts onto similar curves (Fig. 1E), indicating robust growth kinetics. We note that the bacterial population sometimes initially overshoots the carrying capacity (Fig. 1E), indicating a time lag in bacterial response to their environment, as has been observed and studied in other ecological (35) and microbial contexts (36, 37). The bacterial population at carrying capacity does not correlate in any meaningful way with the volume of the intestine (see Fig. S2 in the supplemental material and Materials and Methods), and it would be an interesting topic for future research to determine what aspects of the intestinal environment set the carrying capacity.
Growth dynamics of clusters and individuals.
Imaging the bacterial population in the gut reveals a high degree of heterogeneity in both the form and the spatial distribution of bacterial communities (Fig. 1B and C; see also Video S1 in the supplemental material). Throughout the observation period, individual bacteria as well as dense clusters are evident. Computational analysis (Fig. 2A) enables quantification of the number of bacteria identified as discrete individuals (Ni) and the number found in clusters (Nc), the latter inferred from the total cluster fluorescence intensity relative to that of individuals (see Materials and Methods). We stress that Nc refers to the total number of bacteria found in clusters, not the number of clusters. While both subpopulations grow with time (Fig. 2B), the growth rate of Nc is considerably higher than that of Ni. Note that this higher growth rate could be driven by either an intrinsically higher division rate among clustered bacteria or a net migration of individual bacteria to clusters. In Fig. 2B, we plot the subpopulations in a representative zebrafish. Fitting to a logistic growth model gives a growth rate for clusters that is more than twice as large as that of individuals (r = 1.53 ± 0.04 h−1 and 0.69 ± 0.26 h−1, respectively). This feature is robust: in Fig. 2C, we plot the instantaneous growth rate of clusters (dNc/dt) against individuals (dNi/dt) for five zebrafish, each inoculated with a single exposure to A. veronii, excluding late times at which the populations have reached the carrying capacity. The data lie well above the dashed line of slope 1 that corresponds to identical growth rates for clusters and individuals, and the best-fit proportionality gives dNc/dt = (1.43 ± 0.04) dNi/dt.
FIG 2 .
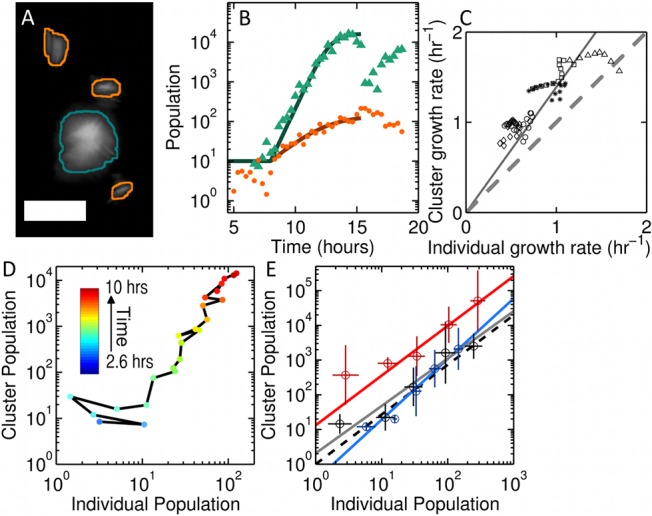
(A) MIP of identified discrete individuals and clusters of bacteria outlined in orange and green, respectively. Image intensity has been logarithmically scaled to display both types in the same image. Scale bar, 25 µm. (B) Quantification of bacterial load over time for individual bacteria (Ni, orange) and clusters of bacteria (Nc, green). The solid curves show the best fit to a logistic growth model for times less than 15 h post-inoculation. (C) Instantaneous individual growth rate versus cluster growth rate in five replicate fish (indicated by different symbols). An equal instantaneous growth rate for individuals and clusters is shown as a dashed line. The solid line is a linear fit to all of the growth rate values. (D) The trajectory of Nc versus Ni during the growth phase for bacterial populations shown in panel B. Time points for which the cluster population is zero have been excluded. (E) Nc versus Ni from all zebrafish inoculated once with A. veronii (gray) and from fish with two 3-h offset inoculations (red, first group; blue, second group). The data have been logarithmically binned for clarity, and data points for which the cluster or individual population is equal to zero have been excluded. The error bars indicate the standard deviations of the logarithm of the population in that bin. The dashed line gives the predicted slope of individual versus cluster population from panel C. Solid lines indicate the best-fit linear relationship between log(Nc) and log(Ni).
An illustrative visualization of growth dynamics is obtained by plotting the number of clustered bacteria (Nc) against the number of individuals (Ni) at each point in time; each bacterial community follows a particular trajectory through this parameter space as it grows. The points in Fig. 2D represent the data from a single fish, the same considered in Fig. 2B, in this fashion. For exponentially growing clustered and individual populations with growth rates rc and ri, respectively, one would expect that log(Nc) should be proportional to log(Ni) with slope rc/ri (Fig. 2E). We find a proportionality, with a logarithmic slope of 1.36 ± 0.15, consistent with the expectation from Fig. 2C of rc/ri = 1.43 ± 0.04. More stringent tests of growth models are described below.
Importantly, the experimental control provided by gnotobiotic zebrafish allows investigation of whether bacterial growth dynamics are affected by colonization history. We inoculated germfree zebrafish with A. veronii expressing dTomato and then 3 h later performed a second inoculation with EGFP-expressing A. veronii, starting imaging shortly after the second inoculation (see Materials and Methods). If growth kinetics are altered by the existence of early colonizers, for example, if clusters of the first group seed clustering of the bacteria of the second, we would expect the two to follow different trajectories in parameter space. We find that the logarithmic slopes for the trajectories of the first and second groups (Fig. 2E), 1.43 ± 0.10 and 1.74 ± 0.17, respectively, are similar but not identical within uncertainties (n = 4 fish). The ratio of the second value to the first is greater than 1 (1.21 ± 0.15), suggesting a slight enhancement of clustering due to the presence of prior colonizers of the gut. In contrast, measuring A. veronii growth rates in vitro in a shaking-flask culture, in which one would expect little bacterial aggregation, with a 3-h delay between the addition of GFP-expressing and dTomato-expressing A. veronii (see Materials and Methods), yields growth rates of r = 1.04 ± 0.28 h−1 and 1.10 ± 0.14 h−1, respectively, and therefore a ratio of growth rates of 0.95 ± 0.28 (see Fig. S3 in the supplemental material). The higher growth rate of A. veronii in the intestine than in batch culture further indicates that the zebrafish intestinal environment provides favorable growth conditions for these bacteria.
Models of cluster growth.
The consistently greater growth rate of bacterial clusters than individuals suggests a robust mechanism for enhanced cluster growth, raising the question of what processes can give rise to the observed characteristics. Two possible models are (i) that cluster growth is surface mediated, due, for example, to nutrient availability being maximal at the cluster boundary and decreasing deeper into the aggregate (38), or due to cluster growth being driven by adhesion of free individuals at the cluster boundary, and (ii) that the bacterial division rate inside clusters is intrinsically higher than the division rate of free individuals, independent of geometry, perhaps due to bacterial quorum sensing of the enhanced local density (39, 40).
Surface-mediated growth implies that the growth rate should be proportional to the surface area of the cluster. Since surface area scales as volume2/3:
Integrating this yields Nc ∝ t3, giving the prediction that a log-log plot of Nc versus time will have a slope of 3. In Fig. 3A, we show Nc versus time for specimens inoculated with single bacterial groups. The dashed line indicates the predicted slope for this surface-mediated growth model, which agrees very poorly with the data. This scaling behavior will apply to any isometrically growing three-dimensional object. A flattened object, a biofilm for example, could grow by thickening or spreading. These would result in scaling forms of Nc ∝ t for thickening (since the growth rate is given by the constant area of the film) and Nc ∝ t2 for spreading (perimeter-mediated growth), which would give an even poorer fit to the data. Moreover, for the bacteria examined, we do not find any evidence of biofilm-like morphology but rather three-dimensional “blobs.” More sophisticated models of adhesion-driven aggregation also exist, falling into the general categories of diffusion- or reaction-limited colloidal aggregation (41); these also predict power-law forms for Nc(t) and hence do not agree with our observations.
FIG 3 .
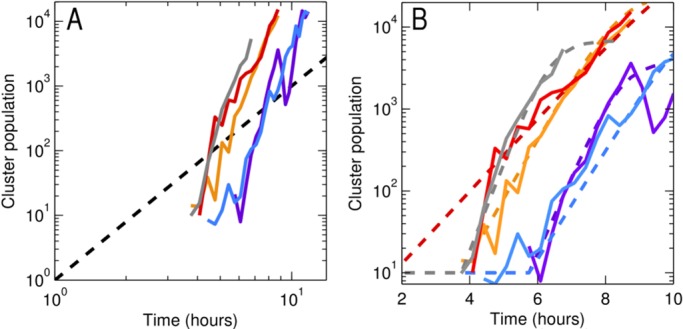
(A) The number of clustered bacteria (Nc) versus time. The dashed line corresponds to Nc scaling as t3, indicative of surface-mediated growth of clusters. (B) The same data as that shown in panel A, on a semilogarthmic plot. The dashed lines give the best fits to a logistic growth model.
In contrast, a geometry-independent model implies that the cluster growth rate is simply proportional to the cluster population:
giving exponential growth, and further yielding the well-known logistic growth model upon the inclusion of a finite carrying capacity. The cluster population data are well fit by logistic growth curves (Fig. 3B).
We also note that the total number of clusters present in the intestine remains relatively small over the entire period examined, in the range of 10 to 50 for all specimens (see Fig. S4 in the supplemental material). In other words, the clustered population Nc is distributed mainly among a small number of large clusters. The growth of Nc is not, therefore, driven by many individuals dividing to form many small clusters.
Spatial distribution of bacteria.
Image-derived spatial information allows us to determine whether colonization is homogeneous throughout the gut and whether any heterogeneity is time dependent. We first note from experiments with two time-offset inoculations, described above, that considerable spatial overlap exists between successive groups of A. veronii (Fig. 4A and B; see also Video S2 in the supplemental material).
FIG 4 .
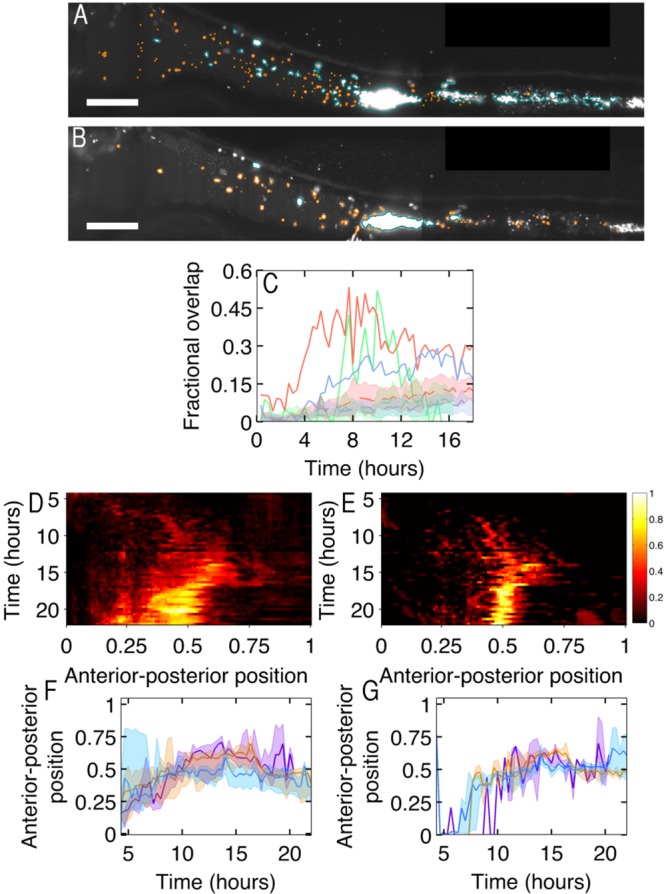
(A) MIP at 15.6 h post-inoculation with dTomato-labeled A. veronii. Scale bar, 100 µm. (B) MIP from the same time point as that in panel A, 12.6 h post-inoculation with EGFP-labeled A. veronii. (A and B) Clusters and individual bacteria are outlined in orange and blue, respectively. Scale bar, 100 µm. Orientation of the images is anterior to the left and dorsal to the top of the panel. (C) Fractional overlap in clusters of the two groups of A. veronii. The dashed lines and shaded regions indicate the predicted spatial overlap between simulated uncorrelated clusters occupying the same volume fraction as the observed bacteria. Different colored lines indicate fractional overlap for different zebrafish. (D) Heat map showing the averaged anterior-posterior location in the zebrafish intestine of clusters of A. veronii from the first of the group in twice-inoculated zebrafish. The location in the intestine has been normalized for each fish, with zero being the beginning of the intestine and 1 being the end of host autofluorescent intestinal cells, excluding bacteria located by the vent. (E) Anterior-posterior population density as in panel D, but for the second group in the twice-inoculated zebrafish. (F) Mean location in the intestine A. veronii from the first of the twice-inoculated zebrafish. Shaded bars indicate the first to third quartile of the bacterial population. Different colors indicate mean location for different zebrafish. (G) Anterior-posterior location as in panel F, but for the second group of the twice-inoculated zebrafish. Different colors indicate mean location for different zebrafish, with the same colors being used for each fish as in panel F. Images are composites of multiple fields of view.
To quantify this colocalization, we calculate the fractional overlap between clusters of the first and second groups (see Materials and Methods). A value of 1 indicates perfect overlap between the two groups. Because the acquisition of a 3D image of each of the two groups is offset in time by about 1 min and the clusters can be moved by peristalsis, we do not expect to find a perfect overlap between the populations even if they are in fact completely colocalized. The solid curves in Fig. 4C show the overlap for three twice-inoculated fish. (Data from one fish in which bacteria from the second inoculation showed no appreciable clustering, thereby prohibiting overlap analysis, are omitted.) The dotted curves and shaded areas show the means and standard deviations of the overlap calculated from simulations of two randomly distributed populations of the same overall density as the observed groups (see Materials and Methods). After the first few hours, we find a larger overlap than we would expect from chance, indicating that the two bacterial groups are considerably colocalized.
The large degree of colocalization between temporally offset colonizers could imply either that cluster growth is mediated by adhesion of bacteria to the surface of existing clusters or that, throughout the duration of early colonization, bacteria are preferentially colonizing particular locations in the gut. The former scenario is contradicted by the cluster growth analysis shown above (Fig. 3). The latter is confirmed by our data. (While bacterial adhesion to existing clusters is not the main driver of cluster growth, individual bacteria may still be preferentially adhering to the surface of clusters.) We integrate the bacterial cluster population along cross sections of the gut perpendicular to the midline, yielding a one-dimensional population density along the anterior-posterior axis. In Fig. 4D and E, we plot this population density, averaged over all twice-inoculated fish, as a function of time since the initial inoculation. In all cases, the spatial distributions of bacteria are highly nonuniform, with bacteria preferentially occupying the middle and anterior regions of the intestine. While there are differences in the distributions of the two bacterial groups, they are coarsely similar. In Fig. 4F and G, we show the means and the first-to-third-quartile range of the population density, again highlighting that growth occurs largely in a restricted subset of the total available space.
DISCUSSION
The measurement of microbial growth kinetics in vitro has a long and well-established history (34, 42). However, inside animals, the behavior of bacteria remains largely unknown, and the complexity of the living environment as well as the well-known variability of microbiome composition (12, 14) render it unclear a priori whether robust growth patterns for any gut microbes exist. Our imaging-based study provides the first detailed quantification of bacterial population dynamics inside a living vertebrate host. We find robust properties of colonization, namely, consistent growth rates of A. veronii between zebrafish hosts and growth kinetics that are well characterized by a simple logistic model.
More intriguingly, the spatial and temporal information provided by imaging uncovers two types of heterogeneity in gut bacterial populations: growth does not occur homogeneously throughout the gut but is rather preferentially localized in particular regions, and the growth rate of bacteria in aggregates is considerably larger than that of independent bacteria. The observed spatial inhomogeneity of bacteria may be an indicator of spatial inhomogeneity in the host environment, perhaps correlated with availability of glycans or other nutrients that could be mapped by biochemical assays (43). The dominance of clusters in the observed population dynamics and the inconsistency of cluster growth with surface-mediated aggregation models suggest that bacteria in aggregates may sense the enhanced local population density to trigger a higher division rate (40). As in in vitro bacterial biofilms (44), aggregation may provide benefits to bacteria with respect to protection from chemical and biological threats in the gut environment (45).
Of course, these data describe only the growth dynamics of a gut consisting of a single species rather than the many-species environments of natural digestive tracts. Notably, experiments examining few-species colonization of animals such as leeches (46) and mice (47) indicate nontrivial symbiont-symbiont interactions (46) as well as species-specific colonization factors that regulate sequential occupancy of the gut (47). In vitro, work on interacting bacteria species shows intriguing relationships between spatial structure and population dynamics (48–50).
Our observations should serve as a foundation for informative spatially and temporally resolved multispecies studies using gnotobiotic zebrafish. By quantifying growth rates, spatial distributions, and characteristics of aggregate or dispersed groups, and contrasting microbial species’ behavior in isolation with that observed in combination with others, the phenomenology of interspecies interactions can be mapped and parameterized onto predictive models of gut microbial systems.
MATERIALS AND METHODS
All experiments involving zebrafish were performed according to protocols approved by the University of Oregon Institutional Animal Care and Use Committee.
Fluorescent bacteria.
We constructed Aeromonas veronii HM21, expressing either enhanced green fluorescent protein (EGFP) or dTomato genes under the tac promoter. Each fluorescent protein sequence was inserted into a pTn7 plasmid (51), which utilizes the Tn7 transposon insertion sites for targeted insertion of the gene of interest. The plasmids were transformed into Escherichia coli, which was conjugated with A. veronii as previously described (21, 22), resulting in chromosomal insertion of the fluorescent protein gene. The strain used was isolated from the medicinal leech Hirudo verbana.
Gnotobiotic zebrafish.
Zebrafish embryos were derived germ-free (GF) as previously described (15, 52). Twenty to thirty GF embryos were housed in sterile tissue culture flasks containing 50 ml of embryo medium. At 5 days post-fertilization (dpf), the fish were inoculated with A. veronii expressing EGFP. The inoculums were prepared from liquid cultures and added directly to the embryo medium to a final concentration of 106 CFU/ml. All manipulations to the GF flasks were done under a class II A/B3 biological safety cabinet. The flasks were kept at 28°C until bacterial colonization of individual larvae was analyzed.
In vitro bacterial growth rate measurement.
The in vitro growth rate of A. veronii was measured by adding, at equal concentrations but with a 3-h delay in the time of inoculation, dTomato-expressing and EGFP-expressing A. veronii to the same test tube containing 10 ml of Luria broth (LB). The experiment was done in triplicate. The concentration of the bacterial cultures was monitored throughout the experiment through spectrophotometry and plating on medium with selective antibiotics in order to quantify the CFU of each strain separately. A 50-µl sample of the culture was taken every 30 or 60 min for these purposes. The number of CFU was determined for each strain separately by plating several dilutions of each culture sample onto LB agarose plates containing either 10 mg/ml of gentamycin to quantify HM21 dTomato or 100 mg/ml of trimethoprim to quantify HM21 EGFP. These plates were incubated overnight at 30°C, and plates with single-colony numbers between 30 and 200 were used for calculating the CFU of each strain at each time point.
Light sheet fluorescence microscopy.
Our home-built light sheet fluorescence microscope closely follows the design of Keller et al. (24); see also reference 23. Sheet illumination was provided by rapidly scanning the beams of a 488-nm (50-mW) and a 561-nm (20-mW) Coherent sapphire CW laser (Coherent, Santa Clara, CA) to excite EGFP and dTomato, respectively. Detection was performed using a Zeiss W Plan-Apochromat 40×/1.0 differential inference contrast (DIC) objective lens and a pco.edge scientific CMOS camera (PCO, Kelheim, Germany). The emission filters used for EGFP and dTomato imaging are 525/50 nm and 620/60 nm (wavelength/bandwidth), respectively (Chroma, Bellows Falls, VT).
Our setup can image the entire larval zebrafish gut, with an approximate volume of 1,200 by 300 by 150 µm, in two colors with 1-μm steps between planes, in roughly 90 s, a speed that allows us to make out individual motile bacteria in the gut and also to image faster than peristalsis-induced blurring. The exposure time for each plane in all image stacks was 30 ms, with 1-μm steps between planes.
We wrote all microscope control and image acquisition software in MATLAB and C++.
Specimen mounting and imaging protocols.
Individual larval zebrafish were pulled into small glass capillaries containing a 0.5% agarose gel, using a metal plunger that was coated with a thin layer of methyl cellulose in order to limit sample drift during mounting and imaging. After the gel set, the fish were slightly extruded from the capillary and immersed in our sample chamber. Our microscope design allows imaging of multiple samples in series, via the mounting of six capillaries along a line diagonal to the light sheet plane. The microscope specimen chamber contains embryo medium, held at 28°C. Fish are imaged at 5 dpf at intervals of 20 to 25 min, for durations of up to 18 h.
Because the gut, with a length of approximately 1,200 µm, is larger than the field of view of our microscope, we imaged the gut in 4 subregions and then registered the images later via custom software.
Quantifying bacterial population in the zebrafish gut.
In order to quantify the number of bacteria inside the zebrafish intestine, we are faced with a variety of image processing challenges. The large size of the data sets, both in the number of time points sampled and the number of images in the full 3D volume of the gut, makes it prohibitively difficult to manually count the number of bacteria present in the gut. We therefore developed a semiautomated analysis pipeline, written in MatLab, to robustly estimate bacterial abundance.
(i) Preprocessing images.
Using the maximum intensity projection (MIP) of the gut, we manually outline both the approximate extent of the gut and the center of the gut for all time points (see Fig. S5A in the supplemental material). We exclude from our analyses bacteria found posterior of a zone of autofluorescent host cells near the posterior of the gut, i.e., close to the vent, to avoid counting bacteria located outside the intestine.
(ii) Single bacteria detection.
When the gut is relatively empty of bacteria, clusters are rare, and bacteria appear as punctate objects. Simple techniques for spot extraction, such as using a global intensity threshold, fail, because both background and object signals can vary in intensity over space and time. We therefore use a wavelet-based algorithm (53) that is less sensitive to variable backgrounds. We locate all detected regions in the 3D volume above an intensity and size threshold, giving a list of potential bacteria, for each of which we note the location, intensity, area, and aspect ratio. This list includes both bacterial cells and false positives, such as host cells and mucus in the gut lumen. To distinguish these, we use a machine learning approach, using a support vector machine classifier (54). We manually construct a training set containing both bacteria and other sources (such as host cells), which we use to build a classifier for our data. We tune our classifier such that the number of false negatives is considerably larger than the number of false positives and then manually inspect our images to remove these false positives. This manual pruning of the data is important early in the time series, when there are very few bacteria relative to the autofluorescent host cells. Spot detection software was adapted from code made available by the lab of Gaudenz Danuser.
(iii) Cluster identification.
To identify clusters of bacteria, we first apply image segmentation methods to the MIP images. We estimate the predicted intensity of the background autofluorescent signal at given points in the gut by calculating the histogram of pixel intensity in 5-μm boxes perpendicular to the gut axis (see Fig. S5B in the supplemental material) and finding peaks in this histogram. We then consider regions for which the intensity is above the mean predicted background intensity at that location in the gut. In each of these regions, we then apply an intensity-based threshold to define a marker for each of the clusters and then segment the image with a graph cut segmentation algorithm (55). We add to this mask all bacteria found from our spot detection algorithm that do not meet the intensity threshold for clusters. The resulting mask defines all the regions in the MIP that contain bacteria. To identify statistical features of each of these, we apply an intensity threshold on the full 3D volume for each of the regions with a cutoff given by the mean intensity at the edge of the found region in the MIP and then calculate the total integrated fluorescence intensity. An alternative method to quantify the population of bacteria is to find the volume above our intensity cutoff occupied by each cluster. We show in Fig. S6 in the supplemental material the volume of segmented clusters versus total integrated intensity for a representative fish, which scales with an exponent of 1.103 ± 0.004. This scaling is close to linear scaling of cluster volume with integrated intensity, indicating that these approaches are nearly equivalent.
(iv) Cluster and individual discrimination.
While the above-given approach identifies discrete individual bacteria as well as clusters, additional manual input improves the robust discrimination of the two types. For each color channel, we manually determine an intensity cutoff that distinguishes clusters from individuals in a subset of scans. We then normalize the total integrated intensity of each region containing bacteria by the average intensity of all regions identified as individuals to determine the number of bacteria in each cluster.
Model fitting.
Nonlinear least-squares minimization was used to fit the population data to a logistic growth model. The residuals were weighted by the standard deviation of local population values within a 40- to 50-minute window. As necessary, the end of lag phase and the time range over which we fit the data are fixed manually.
Spatial overlap.
To simulate the approximate fractional overlap that would occur if no spatial correlation existed between the two bacterial groups, we first calculated, for both groups and all time points, the area of all clusters in the MIP. For each of these clusters, we randomly placed a circle with the same area in a plane of total area equal to that of the MIP of the outlined gut. The fractional overlap between circles of the two groups of clusters was then calculated for 100 trials to determine the mean and distribution of the overlap fraction.
Intestinal volume estimation.
To estimate the volume of the intestine, we manually outlined the intestine for all imaged planes for a representative scan toward the end of each time series. We used the autofluorescent signal from the intestinal wall as an edge marker.
SUPPLEMENTAL MATERIAL
Bacterial populations derived from plating and colony counting (CFU) versus population values derived from fluorescence imaging and image analysis. Gray circles, total fluorescence-derived values; crosses, fluorescence-derived populations of only isolated individual bacteria, excluding clusters; line, best fit to a power-law relationship between the plating- and fluorescence-based values. Download
Approximate gut volume versus bacterial populations for representative scans near the end of the time series for each fish. Download
In vitro growth rate of dTomato-labeled (red) and EGFP-labeled (green) A. veronii, with a 3-h time delay in which these derivatives were, respectively, added to the medium. Error bars give standard deviations over three replicates. Download
Number of clusters versus time for a single fish. Download
(A) Maximum intensity projection (MIP) of larval zebrafish intestine showing both the manually drawn outline and the center of the gut. Scale bar, 100 µm. (B) MIP of a larval zebrafish intestine showing boxes created to bin microbial population data along the long axis of the intestine. Download
Total fluorescence intensity versus volume for all clusters identified, for the same fish shown in Fig. S4. The line indicates the best-fit power-law to the data, which gives a scaling exponent of 1.103 ± 0.004. Download
Extended discussion of methods and results for measuring bacterial populations using plating and colony counting (CFU) and using population values derived from fluorescence imaging and image analysis. Download
MIP of colonization of the zebrafish intestine by EGFP-labeled A. veronii. Time is measured from the start of inoculation. Scale bar, 100 µm. Download
Bacterial population for a subregion of the scan shown in Fig. 4A, showing clusters and individuals of dTomato-labeled and EGFP-labeled A. veronii (red and green, respectively). Scale bar, 100 µm. Rendering was done using FluoRender (software funded by the NIH; Fluorender: An Imaging Tool for Visualization and Analysis of Confocal Data as Applied to Zebrafish Research, R01-GM098151-01). Download
ACKNOWLEDGMENTS
We thank Judith Eisen, Travis Wiles, and Brendan Bohannan for fruitful discussions. We further thank Travis Wiles for careful reading of the manuscript and Ryan Baker and Savannah Logan for assistance with experiments.
This material is based upon work supported by the National Science Foundation under grant no. 0922951. Research reported in this publication was also supported by the National Institute of General Medical Sciences of the National Institutes of Health under award number 1P50GM098911.
The content is solely the responsibility of the authors and does not necessarily represent the official views of the National Institutes of Health.
Footnotes
Citation Jemielita M, Taormina MJ, Burns AR, Hampton JS, Rolig AS, Guillemin K, Parthasarathy R. 2014. Spatial and temporal features of the growth of a bacterial species colonizing the zebrafish gut. mBio 5(6):e01751-14. doi:10.1128/mBio.01751-14.
REFERENCES
- 1. McFall-Ngai MJ. 2002. Unseen forces: the influence of bacteria on animal development. Dev. Biol. 242:1-14. 10.1006/dbio.2001.0522. [DOI] [PubMed] [Google Scholar]
- 2. Hooper LV. 2004. Bacterial contributions to mammalian gut development. Trends Microbiol. 12:129–134. 10.1016/j.tim.2004.01.001. [DOI] [PubMed] [Google Scholar]
- 3. Cheesman SE, Neal JT, Mittge E, Seredick BM, Guillemin K. 2011. Epithelial cell proliferation in the developing zebrafish intestine is regulated by the Wnt pathway and microbial signaling via Myd88. Proc. Natl. Acad. Sci. U. S. A. 108(Suppl 1):4570–4577. 10.1073/pnas.1000072107. [DOI] [PMC free article] [PubMed] [Google Scholar]
- 4. Frank DN, St. Amand AL, Feldman RA, Boedeker EC, Harpaz N, Pace NR. 2007. Molecular-phylogenetic characterization of microbial community imbalances in human inflammatory bowel diseases. Proc. Natl. Acad. Sci. U. S. A. 104:13780–13785. 10.1073/pnas.0706625104. [DOI] [PMC free article] [PubMed] [Google Scholar]
- 5. Boleij A, Tjalsma H. 2012. Gut bacteria in health and disease: a survey on the interface between intestinal microbiology and colorectal cancer. Biol. Rev. Camb. Philos. Soc. 87:701–730. 10.1111/j.1469-185X.2012.00218.x. [DOI] [PubMed] [Google Scholar]
- 6. Larsen N, Vogensen FK, van den Berg FW, Nielsen DS, Andreasen AS, Pedersen BK, Al-Soud WA, Sørensen SJ, Hansen LH, Jakobsen M. 2010. Gut microbiota in human adults with type 2 diabetes differs from non-diabetic adults. PLoS One 5:e9085. 10.1371/journal.pone.0009085. [DOI] [PMC free article] [PubMed] [Google Scholar]
- 7. Ridaura VK, Faith JJ, Rey FE, Cheng J, Duncan AE, Kau AL, Griffin NW, Lombard V, Henrissat B, Bain JR, Muehlbauer MJ, Ilkayeva O, Semenkovich CF, Funai K, Hayashi DK, Lyle BJ, Martini MC, Ursell LK, Clemente JC, Van Treuren W, Walters WA, Knight R, Newgard CB, Heath AC, Gordon JI. 2013. Gut microbiota from twins discordant for obesity modulate metabolism in mice. Science 341:1241214. 10.1126/science.1241214. [DOI] [PMC free article] [PubMed] [Google Scholar]
- 8. Gordon JI. 2012. Honor thy gut symbionts redux. Science 336:1251–1253. 10.1126/science.1224686. [DOI] [PubMed] [Google Scholar]
- 9. Hooper LV, Littman DR, Macpherson AJ. 2012. Interactions between the microbiota and the immune system. Science 336:1268–1273. 10.1126/science.1223490. [DOI] [PMC free article] [PubMed] [Google Scholar]
- 10. Nicholson JK, Holmes E, Kinross J, Burcelin R, Gibson G, Jia W, Pettersson S. 2012. Host-gut microbiota metabolic interactions. Science 336:1262–1267. 10.1126/science.1223813. [DOI] [PubMed] [Google Scholar]
- 11. Stappenbeck TS, Hooper LV, Gordon JI. 2002. Developmental regulation of intestinal angiogenesis by indigenous microbes via Paneth cells. Proc. Natl. Acad. Sci. U. S. A. 99:15451–15455. 10.1073/pnas.202604299. [DOI] [PMC free article] [PubMed] [Google Scholar]
- 12. Microbiome Human, Project Consortium 2012. Structure, function and diversity of the healthy human microbiome. Nature 486:207–214. 10.1038/nature11234. [DOI] [PMC free article] [PubMed] [Google Scholar]
- 13. Chen GY, Núñez G. 2009. Gut immunity: a NOD to the commensals. Curr. Biol. 19:R171–R174. 10.1016/j.cub.2008.12.027. [DOI] [PubMed] [Google Scholar]
- 14. Ley RE, Turnbaugh PJ, Klein S, Gordon JI. 2006. Microbial ecology: human gut microbes associated with obesity. Nature 444:1022–1023. 10.1038/4441022a. [DOI] [PubMed] [Google Scholar]
- 15. Milligan-Myhre K, Charette JR, Phennicie RT, Stephens WZ, Rawls JF, Guillemin K, Kim CH. 2011. Study of host-microbe interactions in zebrafish. Methods Cell Biol. 105:87–116. 10.1016/B978-0-12-381320-6.00004-7. [DOI] [PMC free article] [PubMed] [Google Scholar]
- 16. Roeselers G, Mittge EK, Stephens WZ, Parichy DM, Cavanaugh CM, Guillemin K, Rawls JF. 2011. Evidence for a core gut microbiota in the zebrafish. ISME J. 5:1595–1608. 10.1038/ismej.2011.38. [DOI] [PMC free article] [PubMed] [Google Scholar]
- 17. Bates JM, Akerlund J, Mittge E, Guillemin K. 2007. Intestinal alkaline phosphatase detoxifies lipopolysaccharide and prevents inflammation in zebrafish in response to the gut microbiota. Cell Host Microbe 2:371–382. 10.1016/j.chom.2007.10.010. [DOI] [PMC free article] [PubMed] [Google Scholar]
- 18. Broderick NA, Buchon N, Lemaitre B. 2014. Microbiota-induced changes in Drosophila melanogaster host gene expression and gut morphology. mBio 5(3):e01117-14. 10.1128/mBio.01117-14. [DOI] [PMC free article] [PubMed] [Google Scholar]
- 19. Semova I, Carten JD, Stombaugh J, Mackey LC, Knight R, Farber SA, Rawls JF. 2012. Microbiota regulate intestinal absorption and metabolism of fatty acids in the zebrafish. Cell Host Microbe 12:277–288. 10.1016/j.chom.2012.08.003. [DOI] [PMC free article] [PubMed] [Google Scholar]
- 20. Rawls JF, Mahowald MA, Goodman AL, Trent CM, Gordon JI. 2007. In vivo imaging and genetic analysis link bacterial motility and symbiosis in the zebrafish gut. Proc. Natl. Acad. Sci. U. S. A. 104:7622–7627. 10.1073/pnas.0702386104. [DOI] [PMC free article] [PubMed] [Google Scholar]
- 21. Bomar L, Stephens WZ, Nelson MC, Velle K, Guillemin K, Graf J. 2013. Draft genome sequence of Aeromonas veronii Hm21, a symbiotic isolate from the medicinal leech digestive tract. Genome Announc. 1:e00800-13. 10.1128/genomeA.00800-13. [DOI] [PMC free article] [PubMed] [Google Scholar]
- 22. Graf J. 1999. Symbiosis of Aeromonas veronii biovar sobria and Hirudo medicinalis, the medicinal leech: a novel model for digestive tract associations. Infect. Immun. 67:1–7. [DOI] [PMC free article] [PubMed] [Google Scholar]
- 23. Taormina MJ, Jemielita M, Stephens WZ, Burns AR, Troll JV, Parthasarathy R, Guillemin K. 2012. Investigating bacterial-animal symbioses with light sheet microscopy. Biol. Bull. 223:7–20. [DOI] [PMC free article] [PubMed] [Google Scholar]
- 24. Keller PJ, Schmidt AD, Wittbrodt J, Stelzer EH. 2008. Reconstruction of zebrafish early embryonic development by scanned light sheet microscopy. Science 322:1065–1069. 10.1126/science.1162493. [DOI] [PubMed] [Google Scholar]
- 25. Huisken J, Swoger J, Del Bene F, Wittbrodt J, Stelzer EH. 2004. Optical sectioning deep inside live embryos by selective plane illumination microscopy. Science 305:1007–1009. 10.1126/science.1100035. [DOI] [PubMed] [Google Scholar]
- 26. Weber M, Huisken J. 2011. Light sheet microscopy for real-time developmental biology. Curr. Opin. Genet. Dev. 21:566–572. 10.1016/j.gde.2011.09.009. [DOI] [PubMed] [Google Scholar]
- 27. Santi PA. 2011. Light sheet fluorescence microscopy: a review. J. Histochem. Cytochem. 59:129–138. 10.1369/0022155410394857. [DOI] [PMC free article] [PubMed] [Google Scholar]
- 28. Huisken J. 2012. Slicing embryos gently with laser light sheets. Bioessays 34:406–411. 10.1002/bies.201100120. [DOI] [PubMed] [Google Scholar]
- 29. Ahrens MB, Orger MB, Robson DN, Li JM, Keller PJ. 2013. Whole-brain functional imaging at cellular resolution using light-sheet microscopy. Nat. Methods 10:413–420. 10.1038/nmeth.2434. [DOI] [PubMed] [Google Scholar]
- 30. Liebling M, Forouhar AS, Wolleschensky R, Zimmermann B, Ankerhold R, Fraser SE, Gharib M, Dickinson ME. 2006. Rapid three-dimensional imaging and analysis of the beating embryonic heart reveals functional changes during development. Dev. Dyn. 235:2940–2948. 10.1002/dvdy.20926. [DOI] [PubMed] [Google Scholar]
- 31. Lucas M, Kenobi K, von Wangenheim D, Voβ U, Swarup K, De Smet I, Van Damme D, Lawrence T, Péret B, Moscardi E, Barbeau D, Godin C, Salt D, Guyomarc’h S, Stelzer EH, Maizel A, Laplaze L, Bennett MJ. 2013. Lateral root morphogenesis is dependent on the mechanical properties of the overlaying tissues. Proc. Natl. Acad. Sci. U. S. A. 110:5229–5234. 10.1073/pnas.1210807110. [DOI] [PMC free article] [PubMed] [Google Scholar]
- 32. Hsiao JY, Chen CY, Yang MJ, Ho HC. 2013. Live and dead GFP-tagged bacteria showed indistinguishable fluorescence in Caenorhabditis elegans gut. J. Microbiol. 51:367–372. 10.1007/s12275-013-2589-8. [DOI] [PubMed] [Google Scholar]
- 33. Banning N, Toze S, Mee BJ. 2002. Escherichia coli survival in groundwater and effluent measured using a combination of propidium iodide and the green fluorescent protein. J. Appl. Microbiol. 93:69–76. 10.1046/j.1365-2672.2002.01670.x. [DOI] [PubMed] [Google Scholar]
- 34. Monod J. 1949. The growth of bacterial cultures. Annu. Rev. Microbiol. 3:371–394. 10.1146/annurev.mi.03.100149.002103. [DOI] [Google Scholar]
- 35. May R. 1975. Stability and complexity of model ecosystems, 2nd ed. Princeton University Press, Princeton, NJ. [Google Scholar]
- 36. Vadasz AS, Vadasz P, Abashar ME, Gupthar AS. 2001. Recovery of an oscillatory mode of batch yeast growth in water for a pure culture. Int. J. Food Microbiol. 71:219–234. 10.1016/S0168-1605(01)00618-3. [DOI] [PubMed] [Google Scholar]
- 37. Caperon J. 1969. Time lag in population growth response of Isochrysis galbana to a variable nitrate environment. Ecology 50:188–192. 10.2307/1934845. [DOI] [Google Scholar]
- 38. Stewart PS. 2003. Diffusion in biofilms. J. Bacteriol. 185:1485–1491. 10.1128/JB.185.5.1485-1491.2003. [DOI] [PMC free article] [PubMed] [Google Scholar]
- 39. Miller MB, Bassler BL. 2001. Quorum sensing in bacteria. Annu. Rev. Microbiol. 55:165–199. 10.1146/annurev.micro.55.1.165. [DOI] [PubMed] [Google Scholar]
- 40. Darch SE, West SA, Winzer K, Diggle SP. 2012. Density-dependent fitness benefits in quorum-sensing bacterial populations. Proc. Natl. Acad. Sci. U. S. A. 109:8259–8263. 10.1073/pnas.1118131109. [DOI] [PMC free article] [PubMed] [Google Scholar]
- 41. Lin MY, Lindsay HM, Weitz DA, Ball RC, Klein R, Meakin P. 1989. Universality in colloid aggregation. Nature 339:360–362. 10.1038/339360a0. [DOI] [Google Scholar]
- 42. Novick A. 1955. Growth of bacteria. Annu. Rev. Microbiol. 9:97–110. 10.1146/annurev.mi.09.100155.000525. [DOI] [PubMed] [Google Scholar]
- 43. Baskin JM, Dehnert KW, Laughlin ST, Amacher SL, Bertozzi CR. 2010. Visualizing enveloping layer glycans during zebrafish early embryogenesis. Proc. Natl. Acad. Sci. U. S. A. 107:10360–10365. 10.1073/pnas.0912081107. [DOI] [PMC free article] [PubMed] [Google Scholar]
- 44. Stewart PS, Costerton JW. 2001. Antibiotic resistance of bacteria in biofilms. Lancet 358:135–138. 10.1016/S0140-6736(01)05321-1. [DOI] [PubMed] [Google Scholar]
- 45. Sonnenburg JL, Angenent LT, Gordon JI. 2004. Getting a grip on things: how do communities of bacterial symbionts become established in our intestine? Nat. Immunol. 5:569–573. 10.1038/ni1079. [DOI] [PubMed] [Google Scholar]
- 46. Kikuchi Y, Graf J. 2007. Spatial and temporal population dynamics of a naturally occurring two-species microbial community inside the digestive tract of the medicinal leech. Appl. Environ. Microbiol. 73:1984–1991. 10.1128/AEM.01833-06. [DOI] [PMC free article] [PubMed] [Google Scholar]
- 47. Lee SM, Donaldson GP, Mikulski Z, Boyajian S, Ley K, Mazmanian SK. 2013. Bacterial colonization factors control specificity and stability of the gut microbiota. Nature 501:426–429. 10.1038/nature12447. [DOI] [PMC free article] [PubMed] [Google Scholar]
- 48. Kim HJ, Boedicker JQ, Choi JW, Ismagilov RF. 2008. Defined spatial structure stabilizes a synthetic multispecies bacterial community. Proc. Natl. Acad. Sci. U. S. A. 105:18188–18193. 10.1073/pnas.0807935105. [DOI] [PMC free article] [PubMed] [Google Scholar]
- 49. Kerr B, Riley MA, Feldman MW, Bohannan BJ. 2002. Local dispersal promotes biodiversity in a real-life game of rock-paper-scissors. Nature 418:171–174. 10.1038/nature00823. [DOI] [PubMed] [Google Scholar]
- 50. Hekstra DR, Leibler S. 2012. Contingency and statistical laws in replicate microbial closed ecosystems. Cell 149:1164–1173. 10.1016/j.cell.2012.03.040. [DOI] [PubMed] [Google Scholar]
- 51. Choi KH, Kim KJ. 2009. Applications of transposon-based gene delivery system in bacteria. J. Microbiol. Biotechnol. 19:217–228. 10.4014/jmb.0811.669. [DOI] [PubMed] [Google Scholar]
- 52. Bates JM, Mittge E, Kuhlman J, Baden KN, Cheesman SE, Guillemin K. 2006. Distinct signals from the microbiota promote different aspects of zebrafish gut differentiation. Dev. Biol. 297:374–386. 10.1016/j.ydbio.2006.05.006. [DOI] [PubMed] [Google Scholar]
- 53. Olivo-Marin J-C. 2002. Extraction of spots in biological images using multiscale products. Pattern Recognit. 35:1989–1996. 10.1016/S0031-3203(01)00127-3. [DOI] [Google Scholar]
- 54. Christiani N, Shawe-Taylor J. 2000. An introduction to support vector machines and other kernel-based learning methods, 1st ed. Cambridge University Press, Cambridge, United Kingdom. [Google Scholar]
- 55. Boykov Y, Kolmogorov V. 2004. An experimental comparison of min-cut/max-flow algorithms for energy minimization in vision. IEEE Trans. Patterns Anal. Mach. Intell. 26:1124–1137. 10.1109/TPAMI.2004.60. [DOI] [PubMed] [Google Scholar]
- 56. Cocchiaro JL, Rawls JF. 2013. Microgavage of zebrafish larvae. J. Vis. Exp. 72:e4434. 10.3791/4434. [DOI] [PMC free article] [PubMed] [Google Scholar]
Associated Data
This section collects any data citations, data availability statements, or supplementary materials included in this article.
Supplementary Materials
Bacterial populations derived from plating and colony counting (CFU) versus population values derived from fluorescence imaging and image analysis. Gray circles, total fluorescence-derived values; crosses, fluorescence-derived populations of only isolated individual bacteria, excluding clusters; line, best fit to a power-law relationship between the plating- and fluorescence-based values. Download
Approximate gut volume versus bacterial populations for representative scans near the end of the time series for each fish. Download
In vitro growth rate of dTomato-labeled (red) and EGFP-labeled (green) A. veronii, with a 3-h time delay in which these derivatives were, respectively, added to the medium. Error bars give standard deviations over three replicates. Download
Number of clusters versus time for a single fish. Download
(A) Maximum intensity projection (MIP) of larval zebrafish intestine showing both the manually drawn outline and the center of the gut. Scale bar, 100 µm. (B) MIP of a larval zebrafish intestine showing boxes created to bin microbial population data along the long axis of the intestine. Download
Total fluorescence intensity versus volume for all clusters identified, for the same fish shown in Fig. S4. The line indicates the best-fit power-law to the data, which gives a scaling exponent of 1.103 ± 0.004. Download
Extended discussion of methods and results for measuring bacterial populations using plating and colony counting (CFU) and using population values derived from fluorescence imaging and image analysis. Download
MIP of colonization of the zebrafish intestine by EGFP-labeled A. veronii. Time is measured from the start of inoculation. Scale bar, 100 µm. Download
Bacterial population for a subregion of the scan shown in Fig. 4A, showing clusters and individuals of dTomato-labeled and EGFP-labeled A. veronii (red and green, respectively). Scale bar, 100 µm. Rendering was done using FluoRender (software funded by the NIH; Fluorender: An Imaging Tool for Visualization and Analysis of Confocal Data as Applied to Zebrafish Research, R01-GM098151-01). Download