

ABSTRACT
The age structure of human populations is exceptional among animal species. Unlike with most species, human juvenility is extremely extended, and death is not coincident with the end of the reproductive period. We examine the age structure of early humans with models that reveal an extraordinary balance of human fertility and mortality. We hypothesize that the age structure of early humans was maintained by mechanisms incorporating the programmed death of senescent individuals, including by means of interactions with their indigenous microorganisms. First, before and during reproductive life, there was selection for microbes that preserve host function through regulation of energy homeostasis, promotion of fecundity, and defense against competing high-grade pathogens. Second, we hypothesize that after reproductive life, there was selection for organisms that contribute to host demise. While deleterious to the individual, the presence of such interplay may be salutary for the overall host population in terms of resource utilization, resistance to periodic diminutions in the food supply, and epidemics due to high-grade pathogens. We provide deterministic mathematical models based on age-structured populations that illustrate the dynamics of such relationships and explore the relevant parameter values within which population viability is maintained. We argue that the age structure of early humans was robust in its balance of the juvenile, reproductive-age, and senescent classes. These concepts are relevant to issues in modern human longevity, including inflammation-induced neoplasia and degenerative diseases of the elderly, which are a legacy of human evolution.
IMPORTANCE
The extended longevity of modern humans is a very recent societal artifact, although it is inherent in human evolution. The age structure of early humans was balanced by fertility and mortality, with an exceptionally prolonged juvenility. We examined the role of indigenous microbes in early humans as fundamental contributors to this age structure. We hypothesize that the human microbiome evolved mechanisms specific to the mortality of senescent individuals among early humans because their mortality contributed to the stability of the general population. The hypothesis that we present provides new bases for modern medical problems, such as inflammation-induced neoplasia and degenerative diseases of the elderly. We postulate that these mechanisms evolved because they contributed to the stability of early human populations, but their legacy is now a burden on human longevity in the changed modern world.
INTRODUCTION
A central problem in biological populations, universal among species, is the removal of senescent (postreproductive) individuals. There are two major views of senescence and the removal of senescent individuals. One is that they are programmed and result from inherent biological clocks that determine when individuals die (1–5). A second view is that they are the summation of accumulated injuries, due to environmental insults, that compound in appropriate time scales (6–8). These two views are not mutually exclusive, and it may be attractive considering both together. Nevertheless, the senescent period of life is generally considered to occur after natural selection has taken place (9). If, however, biological clocks are relevant, then the senescent period itself ultimately may be under selective pressure (10, 11).
The age structure of any population must reflect adaptations to common biological challenges, including fluctuations in environmental conditions, exposure to communicable pathogens, distribution of resources to reproductively active populations, and replacement of reproductive populations by their offspring (12–16). In this paper, we analyze how nature organized the age structure of early human populations. We focus on the relationships between the juvenile, reproductive, and senescent periods in human life, which are unusual in nature (17–19) due to our greatly extended juvenility and postreproductive senescence relative to those of other species (20). We explore how the age structure of early human populations, with its characteristic juvenile, reproductive, and senescent periods, was dynamically viable and address how the age-dependent fertility of early human females balanced age-dependent mortality.
We hypothesize that programmed death has been selected, is inherent in humans, and is mediated at least in part by indigenous (vertically transmitted) microorganisms resident in human hosts (21, 22). In particular, we ask whether interactions of indigenous microbes in human hosts can provide regulatory mechanisms (programmed host death) for the removal of senescent humans. Although we focus on human populations because our familiarity with the parameters aids understanding, the models that we propose should be broadly applicable to other social species with indigenous microbiota. Our goal is to analyze deterministic mathematical models that describe the dynamics of age-structured populations in relation to these issues. The models consist of nonlinear partial differential equations that incorporate age dependence into fertility and mortality, and we examine their consistency with human population viability (14). The parameterization of the models is necessarily idealized, but defensible, based on a general understanding of human biology (23–25).
Coevolution of indigenous microorganisms and animal hosts.
Metazoan hosts have been colonized by indigenous (residential or commensal) microbiota for at least 500 million years (26). Phylogenetic studies indicate that many of these relationships have continued for >100 million years, involving millions of host generations (27, 28). Such stability implies coevolution of microbe and host (22, 29), with an obvious host function of providing a topographic locus and a reliable nutrient source to resident microbes. The potential symbiotic roles of the microbes are varied (30–32), and include two general categories: metabolic (33–35) and protective (against incidental pathogenic microbes) (36, 37).
However, carriage of residential organisms also confers a biological cost. Colonizing organisms can produce potentially life-threatening infections when they escape their usual topologic confines; similarly, microbes and the host compete for nutrients (30, 31). As such, indigenous organisms may have been selected when the biological benefits to the host exceeded the costs of carriage (33–35). For microbes that have obligatory colonization of a single host species and cause disease as part of their transmission strategy, the costs of premature host mortality must be balanced against transmission efficiency (38, 39).
Our hypothesis assumes that the indigenous microbiota serves two functions for the hosts that they colonize (Fig. 1). First, during reproductive life, there is selection for microbes that preserve host function, through regulation of energy homeostasis, promotion of fecundity, and interference with competing high-grade pathogens. Second, we postulate selection for organisms that contribute to host demise after reproductive life. We hypothesize that, while harmful for the individual (during the postreproductive age, when there no longer are genes to pass on), such interplay may be salutary for the overall population in terms of resource utilization, resistance to periodic diminutions in the food supply, and epidemics due to high-grade pathogens. Such a hypothesis can help regulate local host population numbers to maintain equilibria under conditions of resource limitation and fluctuation. This hypothesis may be especially relevant to isolated prehistoric human communities, where the fates of the indigenous microbes and their hosts are rigidly tethered. Host community demise would lead to microbial extinctions. As such, local communities that have equilibria between colonizing microbial populations and their hosts that maximize overall host fitness have the greatest probability of long-term survival; we have previously postulated that these relationships take the form of a Nash equilibrium (22, 40, 41).
FIG 1 .
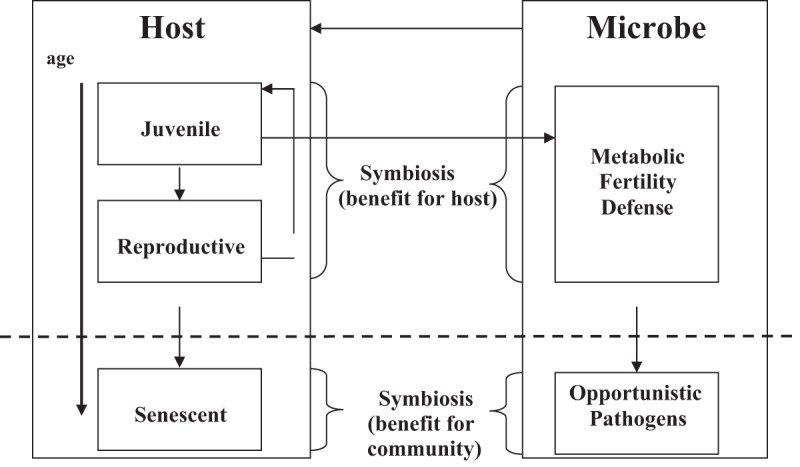
Schematic representation of the coevolution of host and indigenous microbes over the host’s lifetime. In the senescent period, commensal and symbiotic microbes adapt to interactions that contribute to host mortality, potentially conferring benefit to the host community.
Value of an inherent biological clock that removes only senescent individuals from a population.
A corollary to this hypothesis is that indigenous microbial populations that contribute to the health not only of the individual but also of the host group will be most strongly selected. One form of such optimization is when the indigenous microbial population inhibits the virulence (and/or transmissibility) of pathogenic organisms. A second form occurs in individual hosts who survive beyond their reproductive life span and are, by definition, senescent (42, 43). In every species, nature removes senescent individuals (either by the accumulation of accidents or as programmed [or by a combination of both]), which optimizes the health of the reproductively active population and their offspring (16, 44). Populations in which nature removes only senescent individuals have greater viability than those in which young (reproductively active) and old (senescent) individuals are removed indiscriminately, such as by means of a high-grade pathogen sweeping through a community (45).
If indigenous organisms contribute to programmed host death in senescent individuals but not to the death of reproductively active individuals, there may be selection for their maintenance. Because in many host species death coincides with the end of the reproductive period, a fundamental biological question concerns the signals involved in such a form of programmed host death. The extended senescent period of humans, hypothetically significant even in early humans, suggests a possible benefit to population survival, namely, the “grandmother effect,” wherein an individual’s postreproductive period contributes to the survival of later generations (46–53). For the purpose of this analysis, the grandmother effect may be expressed as a reduction of the general senescent-individual mortality burden upon juveniles that would otherwise manifest due to competition pressure between the two subpopulations for resources.
Pathogens and mortality.
We focus on one class of potential selecting agents: microbial pathogens that influence age structure and, particularly, senescent populations. Pathogens vary, involving different severity patterns, often with age-related effects and with agent-specific peak times. Pathogens can cause catastrophic population declines (54, 55), but for some, indigenous (commensal) microbes can affect the outcome of the pathogen-host interaction (37, 56). However, under some circumstances, commensals can become pathogens, a phenomenon called “amphibiosis,” in which context determines whether a biological relationship between two life forms is symbiotic or pathogenic (31). Such a flexible model is highly relevant to both indigenous and acquired microbes, which can have a wide range of biological behaviors.
The hypothesis that we examine contains three elements: (i) exposure to microbial pathogens is an important determinant of host life span, (ii), commensal microbes affect pathogen-host interactions, and, in consequence, (iii) commensals exert control over the age structure and total size of host populations. These assumptions have been previously introduced in preliminary form (22, 57).
RESULTS
Baseline model.
We examine variations in the baseline model that correspond to the significant increase in old/young (O/Y) ratios that occurred in the Upper Paleolithic (52, 53). Sensitivity analyses of the baseline model reveal the following: (i) when the juvenile-mortality component in μ0 (see Methods for an explanation) is increased, the total population at equilibrium falls linearly to low levels and finally to extinction (Fig. S2); (ii) when the total-population burden mortality component in μ0 is increased, the total population at equilibrium falls sharply and then more slowly (Fig. S3); (iii) when the fertility rate (average number of female children born to a female who survives to the maximum reproductive age) is increased from 2 to 5, the total population at equilibrium increases (Fig. S4), and the fraction of juveniles in the population rises significantly; and (iv) when the component in μ0 that corresponds to the senescent-population mortality burden on the juvenile class is increased, the total population at equilibrium falls sharply and then more slowly (Fig. S5).
The effects of varying these baseline parameters (Table S2) reveal an increased mortality for all ages due to the total-population burden. Increased fertility also is problematic when the fertility rate is doubled; the consequent senescent-population burden on juveniles is greatly increased from baseline, and the population exhibits extreme oscillatory behavior (Fig. 2). Such oscillations may substantially reduce the overall group size to its nadir and yield extinction of the population, since recovery from events corresponding to harsh times would be problematic. Such extinctions, when a population becomes too small to be viable, are known as Allee (or fade-out) effects (58). Thus, a much higher human birthrate is not indicated as a strategy for the viability of early human populations. A more feasible survival strategy is reduction of the senescent-population burden on juveniles by increased senescent-individual mortality, which requires additional agents beyond the accumulated ongoing age-based mortality of all individuals. Alternatively, a reduction of the mortality of juveniles due to the senescent-population burden may be accomplished by a grandmother effect, which mitigates this mortality (53).
FIG 2 .

Evolution of the population size and age structure with extreme senescent-population burden on juveniles and on the higher fertility of females. (A, left) Juvenile mortality due to senescent-population burden 20 times baseline [μ1(a,S) = 0.00002 (15.0 − a)S]; (A, right) time evolution (in years) of the age-structured population density, p(a,t), with μ1(a,S) as in panel A and twice baseline fertility {β(a) = 1.0(a − 15.0) exp[0.4(a − 15.0)]}. The population oscillates with wide amplitude from a small founding initial population. (B) Time evolution (in years) of the total-population and subpopulation totals. The population ultimately stabilizes to equilibrium but oscillates with wide amplitude (from a small founding initial population), with the consequent risk of extinction under harsh conditions.
Introduction of pathogens as agents of mortality.
We next examine the effects of age-structured microbial infections, μ2(a), in equation 1 for three different types of human pathogens.
| (1) |
where a is age, t is time (t), T is the total population, S is the senescent population, and the state variable for the model is the population density (p), which is fitted to the equation p(a,t). The first infection is a pathogen (such as Shigella, which causes diarrheal illnesses) that essentially kills only children (59). The second is a commensal (such as Bacteroides in the colon) that may cause an acute event late in life (intestinal perforation), with essentially the same risk each year (30). The third is a commensal microbe that in senescence confers increased risk of death in each year (such as Helicobacter pylori-induced gastric cancer) (60–63). Although all these microbes reside in the gut, microbes in any locale can affect selection. We provide simulations for several combinations of age-dependent microbial pathogens, μ2(a), affecting the population—one affecting only juveniles and the other only senescent individuals. In each simulation, the baseline parameters are assumed, except that one parameter is varied in the formula for μ2(a), corresponding to an increased effect due to one of the microbial infections. In Fig. 3 and 4, the central graph represents the total population, and the juvenile, reproductive, and senescent fractions are indicated in blue, red, and yellow, respectively.
FIG 3 .

Effects of changing both juvenile and senescent-individual mortality on population size and age structure. (A) Combination of microbe-induced increased juvenile mortality with acute mortality of senescent individuals (e.g., from shigellosis). The additional age-dependent mortality in equation 1 is μ2(a) = c(15.0 − a) if 0.0 ≤ a ≤ 15.0, 0.0 if 0.0 ≤ a ≤ 35.0, 0.01(a − 35.0) if 35.0 ≤ a ≤ 40.0, 0.01(45.0 − a) if 40.0 ≤ a ≤ 45.0, and 0.0 if 45.0 ≤ a (inset surface). The sensitivity parameter, c (increasing from 0.0 to 0.005), corresponds to increasing juvenile mortality due to the juvenile microbial infection. The senescent-population infection is acute (centered at age 40), and its mortality is held constant with respect to c. The total population at equilibrium falls linearly to 0, and the time to reach equilibrium increases greatly as c increases. The inset shows the fractions of the population. (B) Combining microbe-induced increased acute mortality of senescent individuals and constant juvenile mortality (e.g., from pneumococcal pneumonia). The additional age-dependent mortality is μ2(a) = 0.003(15.0 – a) if 0.0 ≤ a ≤ 15.0, 0.0 if 15.0 ≤ a ≤ 35.0, (a – 35.0) if 35.0 ≤ a ≤ 40.0, c(45.0 – a) if 40.0 ≤ a ≤ 45.0, and 0.0 if 45.0 ≤ a (inset surface). The sensitivity parameter, c (increasing from 0.0 to 0.08), corresponds to the increasing acute mortality of senescent individuals due to an acute senescent-individual microbial infection centered at age 40. The juvenile infection is held constant with respect to c. The total population at equilibrium increases superlinearly as c increases, which means that the juvenile population benefits significantly even at low senescent-individual infection levels.
FIG 4 .

Effects of changing the mortality of both juveniles and senescent individuals on population size and age structure. (A) Combination of microbe-induced increased juvenile mortality with constant senescent-individual mortality. The additional age-dependent mortality in equation 1 is μ2(a) = c(15.0 – a) if 0.0 ≤ a ≤ 15.0, 0.0 if 15.0 ≤ a ≤ 35.0, and 0.01 + 0.0022222(a – 80.0) if 35.0 ≤ a ≤ 80.0 (inset surface). The sensitivity parameter, c (increasing from 0.0 to 0.004), corresponds to increasing juvenile mortality due to a juvenile microbial infection. The senescent-population infection is persistent, increasing with age, and its mortality is held constant with respect to c. The total population at equilibrium falls linearly to 0, and the time to reach equilibrium increases greatly as c increases. (B) Combination of microbe-induced persistent mortality of senescent individuals (e.g., from H. pylori-induced gastric cancer) and constant juvenile mortality. The additional age-dependent mortality in equation 1 is μ2(a) = 0.003(15.0 – a) if 0.0 ≤ a ≤ 15.0, 0.0 if 15.0 ≤ a ≤ 35.0, and c[0.1 + 0.0022222(a – 80.0)] if 35.0 ≤ a ≤ 80.0 (inset surface). The sensitivity parameter, c (increasing from 0.0 to 2.0), corresponds to the increasing mortality of senescent individuals due to the infection manifesting in senescence. The infection in senescent individuals is persistent, and the manifestations increase with age. The juvenile microbial mortality is held constant with respect to age. The total population at equilibrium increases superlinearly as c increases, which means that the total-population benefits even at relatively low levels of senescent-individual infection. The inset shows the fractions of the population.
When the juvenile microbial mortality is increased and the acute mortality of the senescent population is held constant, the total population at equilibrium falls to extinction levels (Fig. 3A). The decrease is linear as the juvenile mortality worsens, and the senescent population rises slowly as a fraction of the total. High juvenile mortality due to a pathogen with such behavior is highly deleterious to the population’s survival. When the juvenile mortality due to microbes is held fixed while the acute mortality of the senescent population due to microbes increases, the total population at equilibrium rises sharply (Fig. 3B) as the juvenile population fraction increases. Senescent-population mortality due to such a pathogen is very beneficial to population survival, especially at lower total-population levels, but the effect is diminished as the senescent-population mortality increases.
Next, we repeat the simulations above but with senescent-individual infection persistent and its effects increasing with age, rather than being acute in a specific senescence age range. In humans, H. pylori-induced gastric cancer closely fits the scenario (60). Outcomes parallel to those related to acute microbial infections during senescence also were observed for the persistent infections manifesting during senescence (Fig. 4A and B). The idea that senescent-population mortality has a salutary effect on total-population levels is intuitive, given the assumption that the senescent population is a burden. However, the model simulations reveal that the effect is greater as the mortality of senescent individuals rises from a low level, which means that its evolutionary benefits to early human populations challenged by environmental fluctuations may have been crucial.
By varying the microbial mortality parameters (Table S3), it is evident that increased mortality among senescent individuals has a significant impact on total-population size and structure at equilibrium. While juvenile infections contract the total population and shift the population structure to the senescent class, lethal infections in senescence lead to larger total populations and to a higher juvenile fraction. The effects appear more pronounced with the acute than with persistent senescent-population mortality. The models are robust and can lead to similar solutions across a broad range of parameter values, consistent with human population demographics under human hunter-gatherer living conditions (64, 65).
DISCUSSION
Although the mathematical models proposed here are applicable to all social species, we have focused on humans because of important recent changes in human ecology and their potential impact on human society. The age structure of early human populations was intricately balanced by the fertility and mortality schedules of human existence. Modeling this balance should demonstrate that the exceptionally prolonged juvenile period of human populations, largely unchanged into modern times, was maintainable as a stable feature of early human population dynamics over evolutionary time frames. Our simulations indicate that an extended postreproductive age span was nonviable in early humans because of a resultant mortality burden on the juvenile population. Our analysis concurs with claims that the fraction of the senescent population among early humans was much smaller than in present times. Indeed, recent studies indicate that there has been a dramatic 5-fold increase in the O/Y ratio from the Middle to the Upper Paleolithic (52, 53). Changes in host population structure are predicted to select for differing microbiome populations based on altered transmission patterns.
The intrinsic fertility capacity of human females is a defining feature of human population structure. Our simulations indicate that a greatly amplified fertility capacity in early humans was not compatible with the given age structure, since with environmental fluctuations (e.g., flood, drought, epidemics, famine [66]), reset initial conditions would produce extreme population oscillations, with lower population levels resulting in extinction. Our model assigns specific mortality terms to age-compounded effects, total-population effects, and senescent-population effects. Our simulations indicate that age-compounded mortality, accumulated year by year, greatly expands the senescent class to the detriment of a dependent and fragile juvenile class. Our simulations further indicate that additional mortality of the senescent population was necessary to reduce the burden of the senescent population on juveniles, although this burden can be reduced by a transgenerational grandmother effect. Our model formulation of the grandmother effect is the first to employ nonlinear population dependence and continuum age fertility and mortality dependence in an analysis of early human population dynamics (67–70).
The extended longevity of modern humans is a very recent cultural artifact, although it is an inherent capacity of human evolution (71, 72). The total human population 1.2 million years ago was remarkably small, estimated to have had an effective size of about 18,500 (73). Since the landmass of the regions of early human residence was large, human islet communities must have been extremely small (unlike those of modern chimpanzees [21,100] and gorillas [25,000], which inhabit much smaller regions) (73). Did this very sparse human population network hang by a thread over an extended evolutionary time span? To the contrary, our simulations indicate that the intrinsic age structure of the human species, with its exceptional extended juvenility and prolonged senescence, was robust. Our analysis is consistent with previous analyses of population stability based on small population size and variability of the age of reproducing individuals (74–76).
The question examined here is the role of indigenous microbes as causes of additional age-dependent mortality in the programmed death of the senescent population (4, 5). We seek to avoid the (pan-adaptationist) fallacy that all extant biological phenomena have been selected. Neutrally evolving features also may be beneficial. It is not the purpose of this paper to test whether senescence is selected. Rather, our analyses support the concept that indigenous microbes have been selected at least in part by their effects on senescent-population mortality, and our mathematical models demonstrate that such host-microbe interactions are consistent with human demographic age profiles. Our simulations show that the significantly higher total-population size and younger age fraction induced by microbial manifestations in senescence are reflected in the reduced burden of senescent individuals on the presenescent population. Both by curtailing lethal childhood infections by pathogens (77–80) and by curtailing the senescent population, indigenous organisms (such as H. pylori) can have salutary effects on population growth and viability. Pathogens that preferentially affect the old have similar consequences. Thus, in prehistoric times, latent pathogens, such as Mycobacterium tuberculosis, expressed clinically predominantly in senescence (39), may have helped maintain robust population structures. The parameter values characterizing the strength of the protective effects and of postreproductive pathogenicity have important bearing on the age structure of the host population. The alteration of microbial populations with aging may reflect the waning of immunity. An intriguing possibility is that the microbiome—either through alteration or not—affects host immunological function and programs its senescence or that the events are linked in a spiral of alteration, diminished immunity, more alteration, and so forth. An alternative mechanism is that chronic inflammation induced by the microbiota at particular locations (e.g., stomach, lung, colon, skin) may lead to tissue destruction (e.g., atrophic gastritis), which leads to malignancy and demise.
Population structure is a biological characteristic and is both the composite of natural selection per se and a target for selection. The hypotheses that we present provide new bases for such medical problems in humans as inflammation-induced neoplasia (60), degenerative diseases of the elderly (81), and resistance to epidemic infectious diseases (82). The increasing evidence for vertical transmission of the microbiota (83–86) is consistent with their central role in human biology. The mechanisms specific to senescent-population mortality in early humans evolved because they contributed to population stability, but their legacy is now largely a burden on human longevity in the vastly changed modern world (87, 88).
MATERIALS AND METHODS
The model.
The mathematical model is based on the age distribution of the female population and is parameterized by age-dependent fertility and mortality rates. The independent variables of the model are age (a) and time (t), and the state variable for the model is the population density (p), which are fitted to the equation p(a,t). At a given time, three age classes, juvenile [J(t)], reproductive [R(t)], and senescent [S(t)], are defined by integrating the age density [p(a,t)] in a specified age range:
where amin is 15, amax is 35, and a1 is 80. The total population (T) at time t is calculated as follows: T(t) = J(t) + R(t) + S(t).
The density p(a, t) satisfies the partial differential equation of equation 1 and the initial condition (14, 89), where p(a,0) equals p0(a). The founding population, p(a,0) (see Fig. S1 in the supplemental material), mirrors the demographic of a very small human community living under conditions consistent with the early human status of hunters and gatherers (64, 65, 89, 90). The ultimate stabilization of the population will be independent of the founding population, but the ways that stabilization is achieved vary greatly, depending on parameters and initial conditions. The density also satisfies the birthrate boundary condition, as follows:
where β(a) is the age-dependent fertility rate of females (Fig. S1). An average of 6 births per female can be hypothesized for preindustrial human populations (23–25).
Definition of the mortality terms.
The terms μ0, μ1, and μ2 in equation 1 are three modes of mortality. First, μ0 is the all-cause mortality, which includes general age-dependent mortality (66, 73) but excludes two specific age-dependent mortalities: those due to particular microbes and those due to the burden that the senescent population places on the presenescent population. Figure 5A gives an example, with parameters consistent with the hypothetical demographics in a small hunter-gatherer community (23–25). Second, μ1 depends on the age of individuals in the juvenile class and the size of the senescent population. Figure 5B gives an example in which μ1 increases and disproportionately affects young children as the senescent population grows. The grandmother effect is incorporated into the model as a reduction of this mortality from a level that would otherwise be higher. Third, μ2 is the age-dependent mortality in the host population that is regulated by a particular class of microbes affecting age structure, particularly the juvenile and senescent populations. This class is defined in specific ways for different types of microbes. The baseline model has the mortality, μ2, set to 0 (see Table S1 in the supplemental material and Fig. 6A and B), where J(t), R(t), and S(t) reach equilibrium at approximately 200 years, the total population is ~6,000, and the mean age is 18.2 years. The age fractions in the baseline model correspond to the O/Y ratios of early humans in the Middle/Upper Paleolithic transition (52, 53).
FIG 5 .
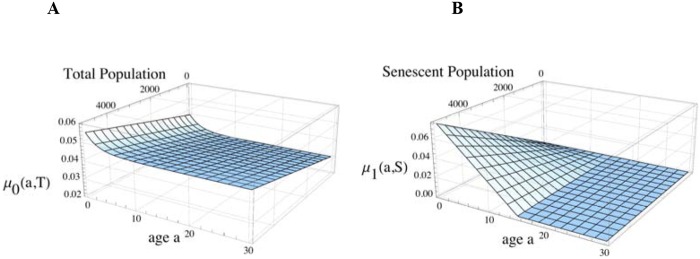
Mortality characteristics of a model human population. (A) All characteristics cause age-dependent and total-population-dependent mortality, μ0(a,T), independently of the senescent-population burden on the juvenile population. (B) Juvenile-age-dependent mortality due to the senescent-population burden, μ1(a,S).
FIG 6 .

Evolution of population size and age structure. (A) Time evolution of the age-structured population density, p(a,t), for the baseline parametric values, in years. (Inset) Population and subpopulation totals and mean ages at equilibrium. (B) Time evolution of the total-population and subpopulation totals for the baseline parametric values, in years.
SUPPLEMENTAL MATERIAL
Characteristics of founding populations of hunter-gatherer humans with exponential population structures. (A) Initial age structure, p0(a), at time 0. The total number of females at time zero is (B) Age-structured fertility rate of females [β(a)]. Download
Effect of increasing juvenile mortality that is independent of the senescent-population burden. The sensitivity of the baseline parameter, c, in the all-cause mortality rate (independent of the senescent-population burden) is calculated as follows: μ0(a,T) = 0.03 + c exp(−0.4a) + ηT, where η is the baseline parameter mortality rate. Data are shown as c increases from 0.0 to 0.21 (e.g., from a recurring severe childhood infection). The total population at equilibrium decreases linearly to 0 as c increases. The vertical line corresponds to a baseline value for c of 0.01. The inset shows the fractions of the population at equilibrium in each age class (blue, juvenile; red, individuals of reproductive age; yellow, senescent individuals) as c increases. Download
Effect of total-population burden. Sensitivity of the baseline parameter mortality rate, η, due to total-population burden as η increases from 10−6 to 10−5. The total population at equilibrium decreases sublinearly as η increases. The vertical line corresponds to the baseline value of η, i.e., 3.0 × 10⁻⁶. The inset shows the fractions of the population at equilibrium in each age class (blue, juveniles; red, individuals of reproductive age; yellow, senescent individuals) as η increases. Download
Effect of fecundity. Sensitivity of the baseline parameter for the fertility rate, β(a), namely, c (a – 15.0) exp[0.4(a – 15.0)] as c increases from 0.31 to 0.8. As c increases, the average number of daughters born per female for females who survive the entire reproductive period (ages, 15 to 35 years) increases from 1.94 to 5.0. The total population at equilibrium increases almost linearly as c increases. The vertical line corresponds to the baseline value of c, i.e., 0.5 (3.125 daughters per female). The inset shows the fractions of the population at equilibrium in each age class as described above as c increases. Download
Effect of increased senescent-population burden on childhood mortality. The sensitivity of the baseline parameter for the juvenile mortality rate (due to the senescent-population burden) is calculated as μ1(a,S) = c(15.0 – a)S as c increases from 5.0 × 10⁻⁶ to 5.0 × 10⁻⁵. The total population at equilibrium decreases sublinearly as c increases. The vertical line corresponds to the baseline value of c, i.e., 10−6. The inset shows the fractions of the population at equilibrium in each age class (blue, juveniles; red, individuals of reproductive age; yellow, senescent individuals) as c increases. Infections that kill primarily during senescence (e.g., reactivation tuberculosis), by reducing the senescent-population burden, increase juvenile populations. Download
Baseline model.
Sensitivity analyses of the baseline model.
Sensitivity analyses of the model with additional age-dependent microbial mortalities.
ACKNOWLEDGMENTS
This work was supported in part by grants RO1 GM63270 and RO1 DK090989 from the National Institutes of Health, the Senior Scholar Award in Infectious Diseases from the Ellison Medical Foundation, and the Diane Belfer Program in Human Microbial Ecology.
We thank Peter Kim, Vincent Young, and Eugene Koonin for providing valuable insights.
Footnotes
Citation Blaser MJ, Webb GF. 2014. Host demise as a beneficial function of indigenous microbiota in human hosts. mBio 5(6):e02262-14. doi:10.1128/mBio.02262-14.
REFERENCES
- 1. Hayflick L. 1980. The cell biology of human aging. Sci. Am. 242:58–65. 10.1038/scientificamerican0180-58. [DOI] [PubMed] [Google Scholar]
- 2. Prinzinger R. 2005. Programmed aging: the theory of maximal metabolic scope. How does the biological clock tick? EMBO Rep. 6:S14–S19. 10.1038/sj.embor.7400425. [DOI] [PMC free article] [PubMed] [Google Scholar]
- 3. Harley CB. 1991. Telomere loss: mitotic clock or genetic time bomb? Mutat. Res. 256:271–282. 10.1016/0921-8734(91)90018-7. [DOI] [PubMed] [Google Scholar]
- 4. Skulachev VP. 2002. Programmed death phenomena: from organelle to organism. Ann. N. Y. Acad. Sci. 959:214–237. 10.1111/j.1749-6632.2002.tb02095.x. [DOI] [PubMed] [Google Scholar]
- 5. Longo VD, Mitteldorf J, Skulachev VP. 2005. Programmed and altruistic ageing. Nat. Rev. Genet. 6:866–872. 10.1038/nrg1706. [DOI] [PubMed] [Google Scholar]
- 6. Stearns SC. 1989. Trade-offs in life-history evolution. Funct. Ecol. 3:259–268. 10.2307/2389364. [DOI] [Google Scholar]
- 7. Kirkwood TB. 1997. The origins of human ageing. Philos. Trans. R. Soc. Lond. B Biol. Sci. 352:1765–1772. 10.1098/rstb.1997.0160. [DOI] [PMC free article] [PubMed] [Google Scholar]
- 8. Kirkwood TB. 2008. Understanding ageing from an evolutionary perspective. J. Intern. Med. 263:117–127. 10.1111/j.1365-2796.2007.01901.x. [DOI] [PubMed] [Google Scholar]
- 9. Cant MA, Johnstone RA. 2008. Reproductive conflict and the separation of reproductive generations in humans. Proc. Natl. Acad. Sci. U. S. A. 105:5332–5336. 10.1073/pnas.0711911105. [DOI] [PMC free article] [PubMed] [Google Scholar]
- 10. Williams GC. 1957. Pleiotropy, natural selection, and the evolution of senescence. Evolution 11:398–411. 10.2307/2406060. [DOI] [Google Scholar]
- 11. Hamilton WD. 1966. The moulding of senescence by natural selection. J. Theor. Biol. 12:12–45. 10.1016/0022-5193(66)90184-6. [DOI] [PubMed] [Google Scholar]
- 12. Medawar PB. 1957. The uniqueness of the individual. Basic Books, New York, NY. [Google Scholar]
- 13. Charlesworth B. 1980. Evolution in age-structured populations. Cambridge University Press, Cambridge, United Kingdom. [Google Scholar]
- 14. Webb GF. 1985. Theory of nonlinear age-dependent population dynamics. Pure and Applied Mathematics, vol 89 Marcel Dekker, New York, NY. [Google Scholar]
- 15. Manton KG, Yashin AI. 2000. Mechanics of aging & mortality: the search for new paradigms. Odense Monogr. Popul. Aging 7. University Press of Southern, Odense, Denmark. [Google Scholar]
- 16. Ronce O, Promislow D. 2010. Kin competition, natal dispersal and the moulding of senescence by natural selection. Proc. Biol. Sci. 277:3659–3667. 10.1098/rspb.2010.1095. [DOI] [PMC free article] [PubMed] [Google Scholar]
- 17. Zeeman EC. 1980. Population dynamics from game theory, p 471–497 In Global theory of dynamical systems. Proceedings of an international conference held at Northwestern University, Evanston, Illinois, June 18–22, 1979 Springer, New York, NY. 10.1007/BFb0087009. [DOI] [Google Scholar]
- 18. Taylor PD, Williams GC. 1984. Demographic parameters at evolutionary equilibrium. Can. J. Zool. 62:2264–2271. 10.1139/z84-329. [DOI] [Google Scholar]
- 19. Bronikowski AM, Alberts SC, Altmann J, Packer C, Carey KD, Tatar M. 2002. The aging baboon: comparative demography in a non-human primate. Proc. Natl. Acad. Sci. U. S. A. 99:9591–9595. 10.1073/pnas.142675599. [DOI] [PMC free article] [PubMed] [Google Scholar]
- 20. Carnes BA, Olshansky SJ. 1993. Evolutionary perspectives on human senescence. Popul. Dev. Rev. 19:793. 10.2307/2938414. [DOI] [Google Scholar]
- 21. Blaser MJ. 1992. Hypotheses on the pathogenesis and natural history of Helicobacter pylori-induced inflammation. Gastroenterology 102:720–727. [DOI] [PubMed] [Google Scholar]
- 22. Blaser MJ, Kirschner D. 2007. The equilibria that permit bacterial persistence in human hosts. Nature 449:843–849. 10.1038/nature06198. [DOI] [PubMed] [Google Scholar]
- 23. Hill KM, Hurtado AM. 1996. Ache life history. The ecology and demography of a foraging people. Aldine de Gruyter, New York, NY. [Google Scholar]
- 24. Chagnon N. 2013. Yanomamö (case studies in cultural anthropology). Wadsworth, Centrage Learning, Belmont, CA. [Google Scholar]
- 25. Van Arsdale PW. 1978. Population dynamics among Asmat hunter-gatherers of New Guinea: data, methods, comparisons. Hum. Ecol. 6:435–467. 10.1007/BF00889419. [DOI] [PubMed] [Google Scholar]
- 26. Schramm A, Davidson SK, Dodsworth JA, Drake HL, Stahl DA, Dubilier N. 2003. Acidovorax-like symbionts in the nephridia of earthworms. Environ. Microbiol. 5:804–809. 10.1046/j.1462-2920.2003.00474.x. [DOI] [PubMed] [Google Scholar]
- 27. Baumann P, Baumann L, Lai CY, Rouhbakhsh D, Moran NA, Clark MA. 1995. Genetics, physiology, and evolutionary relationships of the genus Buchnera: intracellular symbionts of aphids. Annu. Rev. Microbiol. 49:55–94. 10.1146/annurev.mi.49.100195.000415. [DOI] [PubMed] [Google Scholar]
- 28. Ley RE, Lozupone CA, Hamady M, Knight R, Gordon JI. 2008. Worlds within worlds: evolution of the vertebrate gut microbiota. Nat. Rev. Microbiol. 6:776–788. 10.1038/nrmicro1978. [DOI] [PMC free article] [PubMed] [Google Scholar]
- 29. Mazmanian SK, Round JL, Kasper DL. 2008. A microbial symbiosis factor prevents intestinal inflammatory disease. Nature 453:620–625. 10.1038/nature07008. [DOI] [PubMed] [Google Scholar]
- 30. Mackowiak PA. 1982. The normal microbial flora. N. Engl. J. Med. 307:83–93. 10.1056/NEJM198207083070203. [DOI] [PubMed] [Google Scholar]
- 31. Rosebury T. 1962. Microorganisms indigenous to man. McGraw-Hill, New York, NY. [Google Scholar]
- 32. Savage DC. 1977. Microbial ecology of the gastrointestinal tract. Annu. Rev. Microbiol. 31:107–133. 10.1146/annurev.mi.31.100177.000543. [DOI] [PubMed] [Google Scholar]
- 33. Blaser MJ. 2006. Who are we? Indigenous microbes and the ecology of human diseases. EMBO Rep. 7:956–960. 10.1038/sj.embor.7400812. [DOI] [PMC free article] [PubMed] [Google Scholar]
- 34. Ley RE, Turnbaugh PJ, Klein S, Gordon JI. 2006. Microbial ecology: human gut microbes associated with obesity. Nature 444:1022–1023. 10.1038/4441022a. [DOI] [PubMed] [Google Scholar]
- 35. Ohkuma M. 2008. Symbiosis of flagellates and prokaryotes in the gut of lower termites. Trends Microbiol. 6:345–352. 10.1016/j.tim.2008.04.004. [DOI] [PubMed] [Google Scholar]
- 36. Blaser MJ, Falkow S. 2009. What are the consequences of the disappearing human microbiota? Nat. Rev. Microbiol. 7:887–894. 10.1038/nrmicro2245. [DOI] [PMC free article] [PubMed] [Google Scholar]
- 37. Bohnhoff M, Miller CP. 1962. Enhanced susceptibility to salmonella infection in streptomycin-treated mice. J. Infect. Dis. 111:117–127. 10.1093/infdis/111.2.117. [DOI] [PubMed] [Google Scholar]
- 38. Black FL. 1966. Measles endemicity in insular populations: critical community size and its evolutionary implication. J. Theor. Biol. 11:207–211. 10.1016/0022-5193(66)90161-5. [DOI] [PubMed] [Google Scholar]
- 39. Frost WH. 1939. The age selection of mortality from tuberculosis in successive decades. Am. J. Epidemiol. 30:91–96. [DOI] [PubMed] [Google Scholar]
- 40. Kirschner DE, Blaser MJ. 1995. The dynamics of Helicobacter pylori infection of the human stomach. J. Theor. Biol. 176:281–290. 10.1006/jtbi.1995.0198. [DOI] [PubMed] [Google Scholar]
- 41. Blaser MJ, Kirschner D. 1999. Dynamics of Helicobacter pylori colonization in relation to the host response. Proc. Natl. Acad. Sci. U. S. A. 96:8359–8364. 10.1073/pnas.96.15.8359. [DOI] [PMC free article] [PubMed] [Google Scholar]
- 42. Finch CE, Crimmins EM. 2004. Inflammatory exposure and historical changes in human life-spans. Science 305:1736–1739. 10.1126/science.1092556. [DOI] [PubMed] [Google Scholar]
- 43. Hamilton WD. 1964. The genetical evolution of social behavior. J. Theor. Biol 7:1–16, 17–32. [DOI] [PubMed] [Google Scholar]
- 44. Milner FA. 2005. How do nonreproductive groups affect population growth? Math. Biosci. Eng. 2:579–590. 10.3934/mbe.2005.2.579. [DOI] [PubMed] [Google Scholar]
- 45. Traore Y, Tameklo TA, Njanpop-Lafourcade BM, Lourd M, Yaro S, Niamba D, Drabo A, Mueller JE, Koeck JL, Gessner BD. 2009. Incidence, seasonality, age distribution, and mortality of pneumococcal meningitis in Burkina Faso and Togo. Clin. Infect. Dis. 48(Suppl 2):S181–S189. 10.1086/596498. [DOI] [PubMed] [Google Scholar]
- 46. Packer C, Tatar M, Collins A. 1998. Reproductive cessation in female animals. Nature 392:807–811. 10.1038/33910. [DOI] [PubMed] [Google Scholar]
- 47. Shanley DP, Kirkwood TB. 2001. Evolution of the human menopause. Bioessays 23:282–287. . [DOI] [PubMed] [Google Scholar]
- 48. Livnat A, Pacala SW, Levin SA. 2005. The evolution of intergenerational discounting in offspring quality. Am. Nat. 165:311–321. 10.1086/428294. [DOI] [PubMed] [Google Scholar]
- 49. Shanley DP, Sear R, Mace R, Kirkwood TB. 2007. Testing evolutionary theories of menopause. Proc. Biol. Sci. 274:2943–2949. 10.1098/rspb.2007.1028. [DOI] [PMC free article] [PubMed] [Google Scholar]
- 50. Cyrus CY, Lee RD. 2006. The co-evolution of intergenerational transfers and longevity: an optimal life history approach. Theor. Popul. Biol. 69:193–201. 10.1016/j.tpb.2005.11.004. [DOI] [PMC free article] [PubMed] [Google Scholar]
- 51. Johnstone RA, Cant MA. 2010. The evolution of menopause in cetaceans and humans: the role of demography. Proc. Biol. Sci. 277:3765–3771. 10.1098/rspb.2010.0988. [DOI] [PMC free article] [PubMed] [Google Scholar]
- 52. Caspari R, Lee SH. 2004. Older age becomes common late in human evolution. Proc. Natl. Acad. Sci. U. S. A. 101:10895–10900. 10.1073/pnas.0402857101. [DOI] [PMC free article] [PubMed] [Google Scholar]
- 53. Caspari R. 2011. The evolution of grandparents. Sci. Am. 305:44–49. 10.1038/scientificamerican0711-44. [DOI] [PubMed] [Google Scholar]
- 54. Lindenbaum S. 2008. Understanding kuru: the contribution of anthropology and medicine. Philos. Trans. R. Soc. Lond. 363:3715–3720. 10.1098/rstb.2008.0072. [DOI] [PMC free article] [PubMed] [Google Scholar]
- 55. McMichael AJ, McKee M, Shkolnikov V, Valkonen T. 2004. Mortality trends and setbacks: global convergence or divergence? Lancet 363:1155–1159. 10.1016/S0140-6736(04)15902-3. [DOI] [PubMed] [Google Scholar]
- 56. Barton ES, White DW, Cathelyn JS, Brett-McClellan KA, Engle M, Diamond MS, Miller VL, Virgin HW. 2007. Herpesvirus latency confers symbiotic protection from bacterial infections. Nature 447:326–329. 10.1038/nature05762. [DOI] [PubMed] [Google Scholar]
- 57. Blaser MJ, Webb GF. 2005. Host demise as a beneficial function of indigenous microbiota in multicellular hosts, abstr S2:3, p 16. Second ASM Conf. Beneficial Microbes, Lake: Tahoe, NV. [Google Scholar]
- 58. Stephens PA, Sutherland WJ. 1999. Consequences of the allee effect for behaviour, ecology and conservation. Trends Ecol. Evol. (Amst.) 14:401–405. [DOI] [PubMed] [Google Scholar]
- 59. Kotloff KL, Winickoff JP, Ivanoff B, Clemens JD, Swerdlow DL, Sansonetti PJ, Adak GK, Levine MM. 1999. Global burden of Shigella infections. Bull. World Health Organ. 77:651–666. [PMC free article] [PubMed] [Google Scholar]
- 60. Sipponen P, Hyvarinen H, Seppala K, Blaser MJ. 1998. Pathogenesis of the transformation from gastritis to malignancy. Aliment. Pharm. Ther. 12(Suppl 1):61–72. 10.1111/j.1365-2036.1998.00005.x. [DOI] [PubMed] [Google Scholar]
- 61. Chang AH, Parsonnet J. 2010. Role of bacteria in oncogenesis. Clin. Microbiol. Rev. 23:837–857. 10.1128/CMR.00012-10. [DOI] [PMC free article] [PubMed] [Google Scholar]
- 62. Finch CE. 2010. Evolution of the human lifespan and diseases of aging: roles of infection, inflammation, and nutrition. Proc. Natl. Acad. Sci. U. S. A. 107:1718–1724. 10.1073/pnas.0909606106. [DOI] [PMC free article] [PubMed] [Google Scholar]
- 63. Finch CE. 2012. Evolution of the human lifespan, past, present, and future: phases in the evolution of human life expectancy in relation to the inflammatory load. Proc. Am. Philos. Soc. 156:9–44. [PubMed] [Google Scholar]
- 64. Paine RR. 2000. If a population crashes in prehistory, and there is no paleodemographer there to hear it, does it make a sound? Am. J. Phys. Anthropol. 112:181–190. . [DOI] [PubMed] [Google Scholar]
- 65. Huff CD, Xing J, Rogers AR, Witherspoon D, Jorde LB. 2010. Mobile elements reveal small population size in the ancient ancestors of Homo sapiens. Proc. Natl. Acad. Sci. U. S. A. 107:2047–2052. 10.1073/pnas.0909000107. [DOI] [PMC free article] [PubMed] [Google Scholar]
- 66. Gage TB. 1989. Bio-mathematical approaches to the study of human variation in mortality. Yearb. Phys. Anthropol. 32:185–214. 10.1002/ajpa.1330320509. [DOI] [Google Scholar]
- 67. Lee R. 2008. Sociality, selection, and survival: simulated evolution of mortality with intergenerational transfers and food sharing. Proc. Natl. Acad. Sci. U. S. A. 105:7124–7128. 10.1073/pnas.0710234105. [DOI] [PMC free article] [PubMed] [Google Scholar]
- 68. Kachel AF, Premo LS, Hublin JJ. 2011. Grandmothering and natural selection. Proc. Biol. Sci. 278:384–391. 10.1098/rspb.2010.1247. [DOI] [PMC free article] [PubMed] [Google Scholar]
- 69. Hawkes K, Kim PS, Kennedy B, Bohlender R, Hawks J. 2011. A reappraisal of grandmothering and natural selection. Proc. R. Soc. Lond. B Biol. Sci. 278:1936–1938. 10.1098/rspb.2010.2720. [DOI] [PMC free article] [PubMed] [Google Scholar]
- 70. Kim PS, Coxworth JE, Hawkes K. 2012. Increased longevity evolves from grandmothering. Proc. Biol. Sci. 279:4880–4884. 10.1098/rspb.2012.1751. [DOI] [PMC free article] [PubMed] [Google Scholar]
- 71. Rose ME, Mueller LD. 1998. Evolution of the human lifespan, past, present, future. Am. J. Hum. Biol. 10:409–420. . [DOI] [PubMed] [Google Scholar]
- 72. Gurven M, Kaplan H. 2007. Longevity among hunter-gatherers: a cross-cultural examination. Popul. Dev. Rev. 33:321–395. 10.1111/j.1728-4457.2007.00171.x. [DOI] [Google Scholar]
- 73. Gluckman PD, Hanson MA. 2004. Living with the past: evolution, development and patterns in disease. Science 305:1733–1736. 10.1126/science.1095292. [DOI] [PubMed] [Google Scholar]
- 74. Demetrius L, Gundlach VM, Ochs G. 2004. Complexity and demographic stability in population models. Theor. Popul. Biol. 65:221–225. 10.1016/j.tpb.2003.12.002. [DOI] [PubMed] [Google Scholar]
- 75. Demetrius L, Legendre S, Harremöes P. 2009. Evolutionary entropy: a predictor of body size, metabolic rate and maximal lifespan. Bull. Math. Biol. 71:800–818. 10.1007/s11538-008-9382-6. [DOI] [PMC free article] [PubMed] [Google Scholar]
- 76. Jones OR, Scheuerlein A, Salguero-Gómez R, Camarda CG, Schaible R, Casper BB, Dahlgren JP, Ehrlén J, García MB, Menges ES, Quintana-Ascencio PF, Caswell H, Baudisch A, Vaupel JW. 2014. Diversity of ageing across the tree of life. Nature 505:169–173. 10.1038/nature12789. [DOI] [PMC free article] [PubMed] [Google Scholar]
- 77. Rothenbacher D, Blaser MJ, Bode G, Brenner H. 2000. An inverse relationship between gastric colonization by Helicobacter pylori and diarrheal illnesses in children: results of a population-based cross-sectional study. J. Infect. Dis. 182:1446–1449. 10.1086/315887. [DOI] [PubMed] [Google Scholar]
- 78. Pütsep K, Brändén CI, Boman HG, Normark S. 1999. Antibacterial peptide from H. pylori. Nature 398:671–672. 10.1038/19439. [DOI] [PubMed] [Google Scholar]
- 79. Mattsson A, Lönroth H, Quiding-Järbrink M, Svennerholm AM. 1998. Induction of B cell responses in the stomach of Helicobacter pylori-infected subjects after oral cholera vaccination. J. Clin. Invest. 102:51–56. 10.1172/JCI22. [DOI] [PMC free article] [PubMed] [Google Scholar]
- 80. Perry S, de Jong BC, Solnick JV, de La Luz Sanchez M, Yang S, Lin PL, Hansen LM, Talat N, Hill PC, Hussain R, Adegbola RA, Flynn J, Canfeild D, Parsonnet J. 2010. Infection with Helicobacter pylori is associated with protection against tuberculosis. PLoS One 5:e8804. 10.1371/journal.pone.0008804. [DOI] [PMC free article] [PubMed] [Google Scholar]
- 81. Wozniak MA, Mee AP, Itzhaki RF. 2009. Herpes simplex virus type 1 DNA is located within Alzheimer’s disease amyloid plaques. J. Pathol. 217:131–138. 10.1002/path.2449. [DOI] [PubMed] [Google Scholar]
- 82. Yager EJ, Szaba FM, Kummer LW, Lanzer KG, Burkum CE, Smiley ST, Blackman MA. 2009. Gamma-herpesvirus-induced protection against bacterial infection is transient. Viral Immunol. 22:67–72. 10.1089/vim.2008.0086. [DOI] [PMC free article] [PubMed] [Google Scholar]
- 83. Dominguez-Bello MG, Costello EK, Contreras M, Magris M, Hidalgo G, Fierer N, Knight R. 2010. Delivery mode shapes the acquisition and structure of the initial microbiota across multiple body habitats in newborns. Proc. Natl. Acad. Sci. U. S. A. 107:11971–11975. 10.1073/pnas.1002601107. [DOI] [PMC free article] [PubMed] [Google Scholar]
- 84. Palmer C, Bik EM, DiGiulio DB, Relman DA, Brown PO. 2007. Development of the human infant intestinal microbiota. PLoS Biol. 5:e177. 10.1371/journal.pbio.0050177. [DOI] [PMC free article] [PubMed] [Google Scholar]
- 85. Moodley Y, Linz B, Yamaoka Y, Windsor HM, Breurec S, Wu JY, Maady A, Bernhöft S, Thiberge JM, Phuanukoonnon S, Jobb G, Siba P, Graham DY, Marshall BJ, Achtman M. 2009. The peopling of the Pacific from a bacterial perspective. Science 323:527–530. 10.1126/science.1166083. [DOI] [PMC free article] [PubMed] [Google Scholar]
- 86. Makino H, Kushiro A, Ishikawa E, Muylaert D, Kubota H, Sakai T, Oishi K, Martin R, Ben Amor K, Oozeer R, Knol J, Tanaka R. 2011. Transmission of intestinal Bifidobacterium longum subsp. longum strains from mother to infant, determined by multilocus sequencing typing and amplified fragment length polymorphism. Appl. Environ. Microbiol. 77:6788–6793. 10.1128/AEM.05346-11. [DOI] [PMC free article] [PubMed] [Google Scholar]
- 87. Vaupel JW. 2010. Biodemography of human ageing. Nature 464:536–542. 10.1038/nature08984. [DOI] [PMC free article] [PubMed] [Google Scholar]
- 88. Blaser MJ. 2014. Missing microbes: how the overuse of antibiotics is fueling our modern plagues. Henry Holt, New York, NY. [DOI] [PMC free article] [PubMed] [Google Scholar]
- 89. Ammerman AJ. 1975. Late Pleistocene population dynamics: an alternative view. Hum. Ecol. 3:219–233. 10.1007/BF01531424. [DOI] [Google Scholar]
- 90. Pennington RL. 1996. Causes of early human population growth. Am. J. Phys. Anthropol. 99:259–274. . [DOI] [PubMed] [Google Scholar]
Associated Data
This section collects any data citations, data availability statements, or supplementary materials included in this article.
Supplementary Materials
Characteristics of founding populations of hunter-gatherer humans with exponential population structures. (A) Initial age structure, p0(a), at time 0. The total number of females at time zero is (B) Age-structured fertility rate of females [β(a)]. Download
Effect of increasing juvenile mortality that is independent of the senescent-population burden. The sensitivity of the baseline parameter, c, in the all-cause mortality rate (independent of the senescent-population burden) is calculated as follows: μ0(a,T) = 0.03 + c exp(−0.4a) + ηT, where η is the baseline parameter mortality rate. Data are shown as c increases from 0.0 to 0.21 (e.g., from a recurring severe childhood infection). The total population at equilibrium decreases linearly to 0 as c increases. The vertical line corresponds to a baseline value for c of 0.01. The inset shows the fractions of the population at equilibrium in each age class (blue, juvenile; red, individuals of reproductive age; yellow, senescent individuals) as c increases. Download
Effect of total-population burden. Sensitivity of the baseline parameter mortality rate, η, due to total-population burden as η increases from 10−6 to 10−5. The total population at equilibrium decreases sublinearly as η increases. The vertical line corresponds to the baseline value of η, i.e., 3.0 × 10⁻⁶. The inset shows the fractions of the population at equilibrium in each age class (blue, juveniles; red, individuals of reproductive age; yellow, senescent individuals) as η increases. Download
Effect of fecundity. Sensitivity of the baseline parameter for the fertility rate, β(a), namely, c (a – 15.0) exp[0.4(a – 15.0)] as c increases from 0.31 to 0.8. As c increases, the average number of daughters born per female for females who survive the entire reproductive period (ages, 15 to 35 years) increases from 1.94 to 5.0. The total population at equilibrium increases almost linearly as c increases. The vertical line corresponds to the baseline value of c, i.e., 0.5 (3.125 daughters per female). The inset shows the fractions of the population at equilibrium in each age class as described above as c increases. Download
Effect of increased senescent-population burden on childhood mortality. The sensitivity of the baseline parameter for the juvenile mortality rate (due to the senescent-population burden) is calculated as μ1(a,S) = c(15.0 – a)S as c increases from 5.0 × 10⁻⁶ to 5.0 × 10⁻⁵. The total population at equilibrium decreases sublinearly as c increases. The vertical line corresponds to the baseline value of c, i.e., 10−6. The inset shows the fractions of the population at equilibrium in each age class (blue, juveniles; red, individuals of reproductive age; yellow, senescent individuals) as c increases. Infections that kill primarily during senescence (e.g., reactivation tuberculosis), by reducing the senescent-population burden, increase juvenile populations. Download
Baseline model.
Sensitivity analyses of the baseline model.
Sensitivity analyses of the model with additional age-dependent microbial mortalities.