Abstract
The signal processing and fitting methods used for hearing aids have mainly been designed to optimize the intelligibility of speech. Little attention has been paid to the effectiveness of hearing aids for listening to music. Perhaps as a consequence, many hearing-aid users complain that they are not satisfied with their hearing aids when listening to music. This issue inspired the Internet-based survey presented here. The survey was designed to identify the nature and prevalence of problems associated with listening to live and reproduced music with hearing aids. Responses from 523 hearing-aid users to 21 multiple-choice questions are presented and analyzed, and the relationships between responses to questions regarding music and questions concerned with information about the respondents, their hearing aids, and their hearing loss are described. Large proportions of the respondents reported that they found their hearing aids to be helpful for listening to both live and reproduced music, although less so for the former. The survey also identified problems such as distortion, acoustic feedback, insufficient or excessive gain, unbalanced frequency response, and reduced tone quality. The results indicate that the enjoyment of listening to music with hearing aids could be improved by an increase of the input and output dynamic range, extension of the low-frequency response, and improvement of feedback cancellation and automatic gain control systems.
Keywords: hearing aids, music, survey, distortion, acoustic feedback, amplitude compression
Introduction
The ability to understand speech is very important for functioning in everyday life, whereas the enjoyment of music might be considered to be more of a luxury. It is therefore natural that hearing aids have been optimized for speech and not for music perception. However, many people enjoy playing, singing, or listening to music, and it is therefore also worth trying to optimize hearing aids for music perception.
There are only a few studies on the effects of hearing aids on the perception of music. Some aspects of the signal processing used in hearing aids might be expected to impair the enjoyment of music. For example, frequency compression (FC) introduces inharmonicity; the upper partials are not “in tune” with the lower partials of a given instrument. However, even people with normal hearing are relatively insensitive to inharmonicity at high frequencies (Culling & Darwin, 1993), and a study on the effects of FC on the enjoyment of music showed that FC actually increased the enjoyment of music (Uys, Pottas, Vinck, & van Dijk, 2012), probably because the FC provided information about high-frequency components in the music.
Another aspect of hearing-aid signal processing that might be expected to impair the enjoyment of music is multichannel amplitude compression. Such compression can introduce cross-modulation between previously independent sound sources (Stone & Moore, 2004, 2008) and can also distort the temporal envelope shapes of sounds (Croghan, Arehart, & Kates, 2012), which would be expected to reduce sound quality (Arehart, Kates, & Anderson, 2011; Croghan et al., 2012). One study (Croghan, Arehart, & Kates, 2014) examined the combined effects of compression limiting (CL), as used by the music industry, and hearing-aid wide dynamic range compression (WDRC) and found that WDRC was more important than CL in determining music preferences. Also, fast-acting WDRC led to lower perceived quality than slow-acting WDRC. On the other hand, one recent study (Madsen & Moore, 2014) showed that fast-acting WDRC improved the ability to make use of cues from onset asynchronies to hear one tone in the presence of another, which might be expected to improve music perception.
A special edition of Trends in Amplification (Chasin & Hockley, 2012) was dedicated to the topic of music and hearing loss. Several of the articles were concerned with distortion caused by the high sound levels and crest factors that are typical of live music (Chasin, 2012; Hockley, Bahlmann, & Fulton, 2012; Schmidt, 2012); the crest factor is the ratio of the peak value to the root mean square value. Chasin (2012) argued that distortion occurs because of the limited input dynamic range that can be handled by current analog-to-digital (A/D) converters. Two other articles were concerned with potential solutions to this problem. Schmidt (2012) suggested using microphones that are less sensitive at low frequencies. However, this reduces the fitting range for lower frequencies and requires the use of low-level expansion to avoid an increase in the noise floor. Hockley et al. (2012) suggested shifting the dynamic range used by the A/D converter upward to include higher sound levels. They found that this led to an overall improvement in ratings for sound quality when testing 10 musicians.
Another article in this special issue (Moore, 2012) reviewed several studies. Moore (2012) presented evidence suggesting that the ripples in frequency response and limited bandwidth that are typical of hearing aids both led to reduced sound quality when listening to music (Moore & Tan, 2003). Other studies (Moore, Füllgrabe, & Stone, 2011; Ricketts, Dittberner, & Johnson, 2008) showed that for hearing-impaired people, higher upper cutoff frequencies were preferred by people whose audiograms had shallow slopes. A fourth study (Moore & Sek, 2013) compared preferences for the CAM2 (Moore, Glasberg, & Stone, 2010) and NAL-NL2 (Keidser, Dillon, Flax, Ching, & Brewer, 2011) fitting methods. The results showed an overall preference for CAM2 for music stimuli. Because CAM2 and NAL-NL2 differ mainly in the greater high-frequency gain recommended by CAM2, this result suggests that extending the upper cutoff frequency would be beneficial for the sound quality of music.
There have also been a few surveys of the enjoyment of music by hearing-impaired people. The results of a survey evaluating the enjoyment of music by elderly hearing-impaired people (Leek, Molis, Kubli, & Tufts, 2008) were compared with results from a survey conducted 20 years earlier. The authors concluded that developments in hearing-aid technology had reduced problems of music enjoyment but that 25% to 30% of people still experienced problems when listening to music.
The problems reported in some of these studies and anecdotal evidence that hearing aids reduce the enjoyment of music inspired the survey presented in this article. The purpose of the survey was to assess the extent to which hearing aids improve or worsen the experience of listening to live and reproduced music, and to establish the nature and prevalence of any problems.
Method
Questionnaire
The questionnaire was generated using Survey Monkey and was active on the Internet from March 13, 2013 to January 21, 2014. Among other places, it was advertised on the Web sites of Action on Hearing Loss (a major UK charity, http://www.actiononhearingloss.org.uk), of the Cambridge “hearing group” laboratory (http://hearing.psychol.cam.ac.uk/), and of several US-based audiologists and hearing-aid dispensers, as well as on the “Auditory” and “Earmail” e-mail lists and via Facebook and Twitter.
The questionnaire consisted of 22 questions. All questions except the last were multiple choice. An overview of the multiple-choice questions and the response options is shown in Table 1. First the respondents were asked whether or not they had a hearing loss. Only respondents answering that they had a hearing loss were able to continue to the remaining questions. The next 15 questions were concerned with general information such as gender, age and musical background, and information about their hearing loss and hearing aids. The remaining questions were concerned with the experiences of the respondents when listening to music with their hearing aids. For some of the questions, the respondents could add comments. For all of the multiple-choice questions except Question 20, the respondents could only choose one of the response options. Question 22 was an open question. Responses to Question 22 will be reported elsewhere. For brevity, the explanations included for some of the questions to help the respondents understand those questions and response options are not included in Table 1. The full questionnaire is given in the supplementary material (available online).
Table 1.
Questions and Response Options for Questions 1 to 21 From the Music Survey.
| Question | Response options | |
|---|---|---|
| 1 | Do you have a hearing loss? | Yes; No |
| 2 | Do you use hearing aid(s) for one hour a day or more? | No; Yes, in the left ear only; Yes, in the right ear only; Yes, in both ears |
| 3 | Is your hearing loss conductive, sensorineural, or a combination of the two (mixed)? | Conductive; Sensorineural; Mixed; Don’t know |
| 4 | How long have you had a hearing loss? | Less than one year; 1–5 years; 5–10 years; 10–20 years; More than 20 years |
| 5 | Please describe your hearing loss using the categories below. Click on all that apply | Mild; Moderate; Severe; Profound |
| 6 | Please describe how easy you find it to understand speech when talking to one person in a quiet room without using your hearing aids and without lipreading | Very easy; Fairly easy; Medium; Somewhat difficult; Very difficult; Impossible |
| 7 | Please describe how easy you find it to talk on the telephone without using your hearing aids when you are in a quiet room | Very easy; Fairly easy; Medium; Fairly difficult; Very difficult; Impossible |
| 8 | Please describe the pattern of your hearing loss as well as you can | Greater at high frequencies than low frequencies; Greater at low frequencies than at high frequencies; Greater at medium than at low or high frequencies; Almost the same at all frequencies |
| 9 | What age are you? | 1–15; 16–20; 21–30; 30–40; 5: 40–50; 50–60; 60–70; 70–80; More than 80 |
| 10 | Are you male or female? | Male; Female |
| 11 | Please specify the extent of your musical training/experience. Click on the description that fits your training/experience the best. | I have no musical training; I play a musical instrument or sing as an amateur, but have not had formal training; I play a musical instrument or sing and have had training or lessons lasting one year or less; I play a musical instrument or sing and have had training or lessons lasting one to two years; I play a musical instrument or sing and have had training or lessons lasting two to five years; I play a musical instrument or sing and have had training or lessons lasting more than five years; I am a professional musician |
| 12 | Please specify the type of hearing aids that you have | Behind the ear with earmold in the ear; Behind the ear with thin tubing and a soft dome in the ear canal; Behind the ear with receiver in the ear canal; In the ear; In the canal; Completely in the canal; Other (please specify) |
| 13 | Please specify the extent to which your ear canal is sealed by your hearing aid(s). | Open (earmold with large vent); Open (soft dome with openings); Partly closed (earmould with small vent); Closed (earmould with no vent); Closed (sealed dome in ear canal); Other (please specify) |
| 14 | Please specify the name of the manufacturer of your hearing aid(s) | Audifon; Beltone; Bernafon; Danavox; GNResound; Hansaton; Oticon; Phonak; Rexton; Sebotek; Siemens; Sonic Innovations; Starkey; Unitron; Widex; other (please specify) |
| 15 | Do your hearing aids incorporate any form of frequency lowering or frequency compression, for example “Soundrecover” for Phonak aids, “Audibility extender” for Widex aids, or “Spectral iQ” for Starkey aids? | No; Yes—Soundrecover; Yes—Audibility extender; Yes—Spectral IQ; Yes—type unknown; Don’t know |
| 16 | Do you have a special program in your hearing aid(s) for listening to music | Yes; No |
| 17 | Do you ever experience a whistling sound (acoustic feedback) when using your hearing aids to listen to music? | Yes; No |
| 18 | When listening to music via radio, TV or stereo system, do you find your hearing aids to be helpful? | Yes—a lot; Yes—a little; Hardly at all; No—the aids make things a bit worse; No—the aids make things a lot worse; Not applicable: I don’t wear hearing aids when listening to music; I can’t hear music via the TV or radio without my hearing aids |
| 19 | When listening to live music, do you find your hearing aids to be helpful? | Yes—a lot; Yes—a little; hardly at all; No—the aids make things a bit worse; No the aids make things a lot worse; Not applicable: I don’t wear hearing aids when listening to live music; I can’t hear live music without my hearing aids |
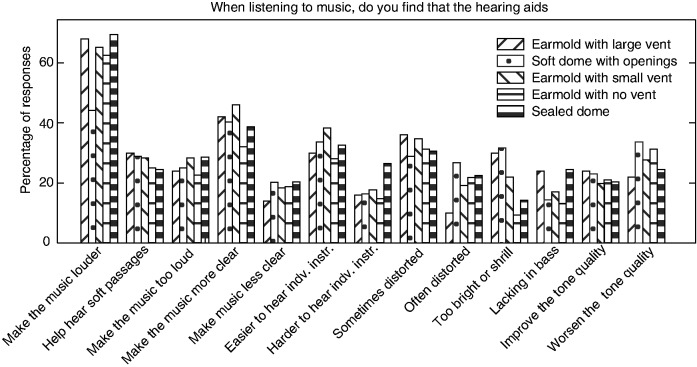
| 20 | When you listen to music using your hearing aids, do you find that the hearing aids (please click on ALL that apply): | Make the music louder; Help me to hear softer passages without the louder parts being too loud; Make the louder parts too loud; Make the music sound more clear; Make the music sound less clear; Make it easier to hear the individual instruments; Make it harder to hear the individual instruments; Sometimes make the music seem distorted; Often make the music seem distorted; Make the music seem too bright or shrill; Make the music seem lacking in bass; Improve the tone quality of the music; Worsen the tone quality of the music |
| 21 | Please rate your ease of listening when using your hearing aids for the following types of music. We are interested in how easy or difficult it is to hear individual notes and to follow the melodic line or lines. If you do not listen to one of the types of music, click on “not applicable.” | Very easy; Fairly easy; Medium; Somewhat difficult; Very difficult; Not applicable |
Note. Some additional information meant to improve the understanding of the respondents is not included here but is given in the supplementary material.
The study was approved by the Research Ethics Committee, East of England.
Data Analysis
Group differences were assessed for the multiple-choice questions related to music (Questions 17–21). For Questions 17 to 20, the group differences were analyzed using a chi-square test with Yates correction in cases of 2 × 2 contingency tables. Groups were merged or excluded if a merger was not appropriate. This was done if expected values were <5 for 2 × 2 contingency tables and <1 otherwise, as recommended by Levine, Stephan, Krehbiel, and Berenson (2008). When respondents answered “Not applicable: I don’t wear hearing aids when listening to music” in response to Question 18, their responses were not included in the analysis of results for that question. Similarly, when respondents answered “Not applicable: I don’t wear hearing aids when listening to live music” in response to Question 19, their responses were not included in the analysis of results for that question. For Question 21, group differences were assessed using Wilcoxon rank-sum tests for two groups and Kruskal–Wallis rank tests for three or more groups (ordinal variables). These tests were performed for each of the 13 types of music and for the mean across all music types. Before calculating the mean, the number of responses for each response option, group, and music type was divided by the total number of respondents from that group who did not respond “Not applicable,” denoted Ngroup, to give the proportion of responses. The proportion for each music type was then multiplied by the mean of Ngroup across all music types. Finally, the means were rounded, as integers were needed for the statistical tests. All statistical analysis was done using a significance level, α, of .05. Bonferroni corrections were employed for multiple-comparison tests and when comparing group differences for the individual types of music for Question 21.
Population
A total of 1,077 respondents participated in the survey. Of these, 554 were not included here: 209 respondents had normal hearing, 58 used hearing aids less than one hour a day, 273 did not finish the survey, 4 had at least one bone-anchored hearing aid, and 10 had at least one cochlear implant.
For Question 20, where it was possible for the respondents to choose any or all of the response options, the responses for the 32 respondents agreeing with two statements that contradicted each other or were mutually inconsistent were not included in the analysis of responses for that question. These pairs of statements were as follows: “Help me to hear softer passages without the louder parts being too loud” and “Make the louder parts too loud”; “Make the music sound more clear” and “Make the music sound less clear”; “Make it easier to hear the individual instruments” and “Make it harder to hear the individual instruments”; “Sometimes make the music seem distorted” and “Often make the music seem distorted”; and “Improve the tone quality of the music” and “Worsen the tone quality of the music.”
Results
Overall Results
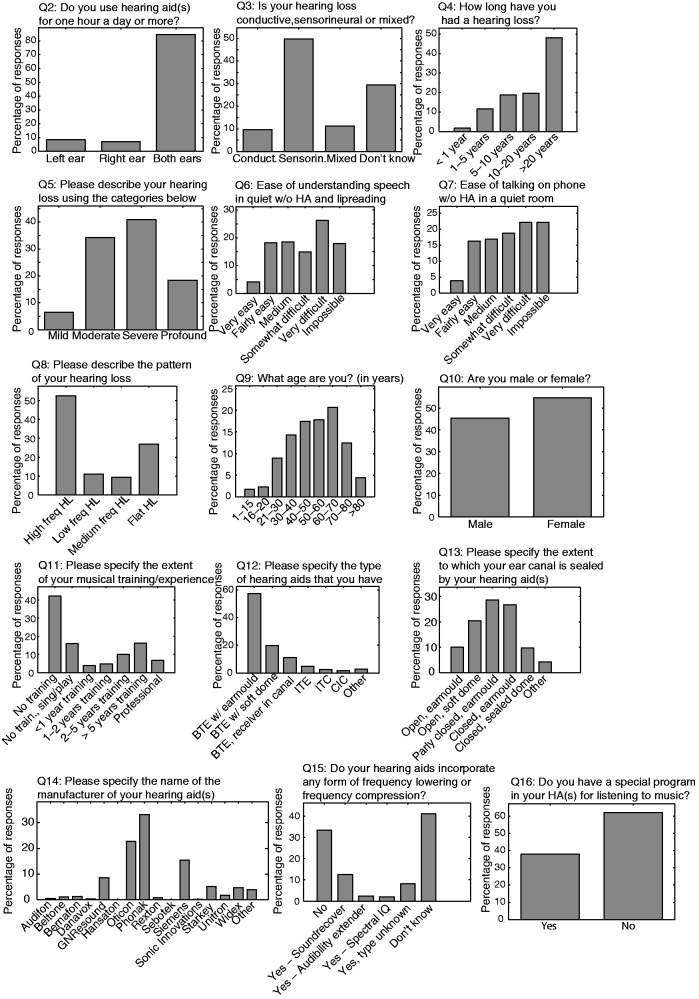
The responses to the first 16 questions in the survey give an overview of the demographics of the population of this survey and information about their hearing loss, types of hearing aids, and musical training. An overview of the distribution of these responses is presented in Figure 1.
Figure 1.
Percentage of responses for Questions 2 to 16. BTE = behind the ear; ITE = in the ear; ITC = in the canal; CIC = completely in the canal.
For Questions 6 and 7, the respondents were asked to describe how easy it was to understand speech when talking to one person (Question 6) and how easy they found it to talk on the telephone (Question 7), both without using their hearing aids in a quiet room. These questions were included to check the reliability of the self-reported degree of hearing loss from Question 5. Tables 2 and 3 show the distributions of responses for these two questions. As expected, in general, the more severe the self-reported hearing loss, the more difficult it was to hear speech in quiet or on the telephone without hearing aids. There are a few anomalies, such as one respondent with a mild hearing loss finding it “Very difficult” and a few respondents with profound hearing loss finding it “Very easy” or “Fairly easy.” Some variation is to be expected, as the interpretation of what is easy or difficult probably varies across individuals and the ease of hearing speech in quiet or the telephone is affected by cognitive abilities as well as by the degree of hearing loss (Akeroyd, 2008). Furthermore, it is likely that the people with profound hearing loss responding “Very easy” or “Fairly easy” to Question 6 made use of lip reading without being aware of this and therefore found the task easier than would have been expected. Despite the anomalies, the rank-order correlations (Kendall’s Tau) between the degree of hearing loss and the responses to Question 6 (τ = .52, p < .001) and Question 7 (τ = .51, p < .001) were significant. Therefore, only the self-reported hearing loss and not the responses to Questions 6 and 7 are employed in the following analyses.
Table 2.
Relationship of Responses to Questions About Severity of Hearing Loss (Question 5) and Ease of Hearing Speech in Quiet Without Hearing Aids (Question 6).
| Mild | Moderate | Severe | Profound | |
|---|---|---|---|---|
| Very easy | 6 | 11 | 2 | 3 |
| Fairly easy | 20 | 52 | 21 | 2 |
| Medium | 6 | 59 | 25 | 7 |
| Somewhat difficult | 1 | 35 | 35 | 7 |
| Very difficult | 1 | 19 | 83 | 34 |
| Impossible | 0 | 3 | 48 | 43 |
Table 3.
Relationship of Responses to Questions About Severity of Hearing Loss (Question 5) and Ease of Talking on the Telephone Without Hearing Aids (Question 7).
| Mild | Moderate | Severe | Profound | |
|---|---|---|---|---|
| Very easy | 8 | 10 | 1 | 1 |
| Fairly easy | 14 | 51 | 17 | 3 |
| Medium | 7 | 45 | 31 | 5 |
| Somewhat difficult | 4 | 41 | 44 | 9 |
| Very difficult | 1 | 25 | 69 | 21 |
| Impossible | 0 | 7 | 52 | 57 |
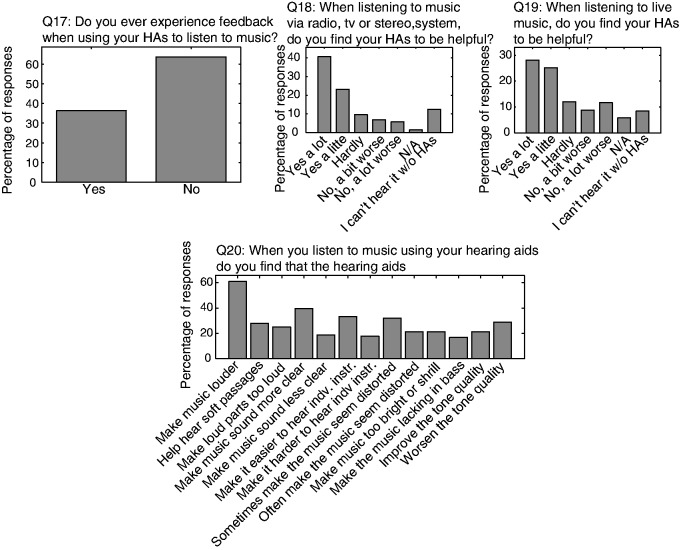
Questions 17 to 21 were concerned with experiences of the respondents when listening to music with their hearing aids. An overview of the responses for these questions is shown in Figures 2 and 3. The responses to Question 17 showed that more than a third of the respondents experienced acoustic feedback when listening to music, indicating that this is still a problem for many hearing-aid users. For listening to music via radio, TV, or stereo system, the responses to Question 18, including those for respondents answering that they could not hear music via radio, TV, or stereo system without their hearing aids, showed that 76% of respondents found their hearing aids to be helpful. On the other hand, only 62% of the respondents found their hearing aids to be helpful for listening to live music.
Figure 2.
Percentage of responses for Questions 17 to 20.
Figure 3.
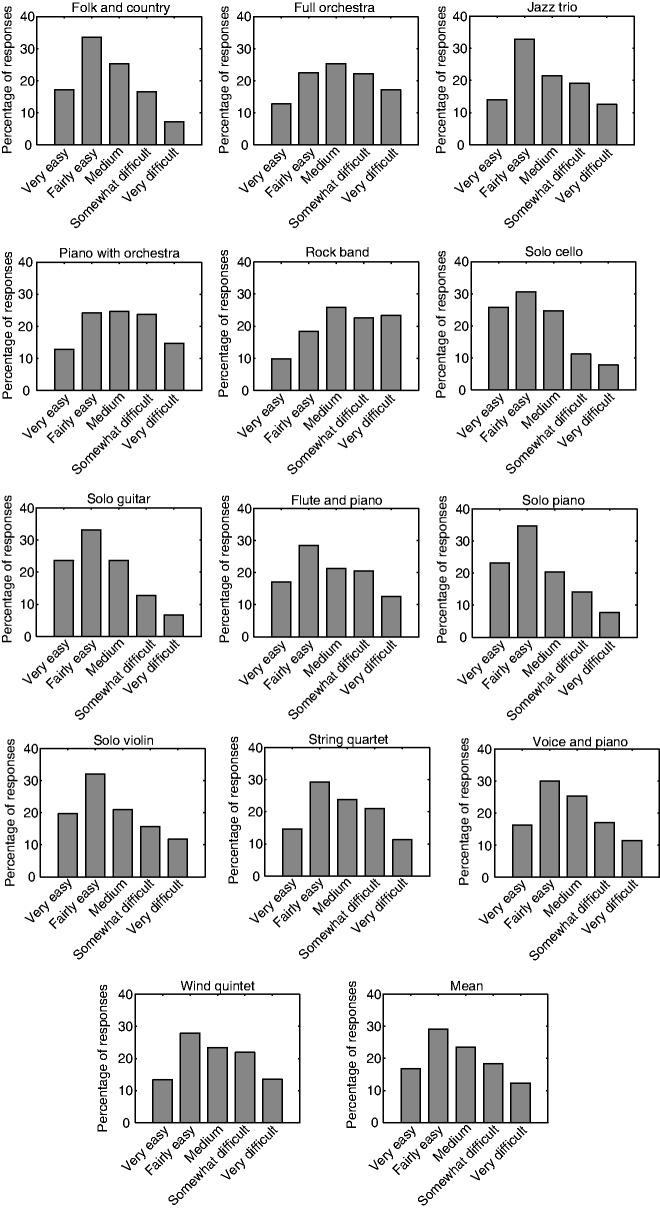
Responses to Question 21 for different types of music and for the mean across all music types.
The difference between the responses for live and reproduced music could be a consequence of the high sound levels that occur for some types of live music. Several factors may be involved here. First, most people with sensorineural hearing loss experience loudness recruitment; for high sound levels, the loudness “catches up” with the normal value (Fowler, 1936; Moore, 2007). Hence, a hearing aid is not required, as high-level sounds may have a nearly normal loudness without amplification. Second, hearing aids may lead to worsened sound quality or even distortion for high input sound levels due to the use of CL or peak clipping before the A/D converter for levels above about 95 dB SPL (Chasin & Hockley, 2013; Dillon, 2012; Hockley et al., 2012). Distortion may also occur in the output transducers. For reproduced music, the peak replay levels are usually below those for live music. This is the case for a number of reasons. First, the listener may prefer somewhat lower levels. Second, the equipment used may not be capable of reproducing sounds at very high levels. Third, amplitude compression is commonly applied to reproduced music to make it louder and to keep it within the dynamic range of the equipment used for storing, transmitting, and reproducing it (Croghan et al., 2012; Stone, Moore, Füllgrabe, & Hinton, 2009). This has the effect of reducing the crest factor of the signal (Croghan et al., 2012). The reduced crest factor makes it less likely that any form of “overload” will occur in hearing aids.
For Question 20, the respondents were asked to indicate which of 13 possible statements about their experiences listening to music with their hearing aids they agreed with. It is a little surprising that only 61% of the respondents found that their hearing aids made the music louder. A possible reason is that some respondents listened to music at very high levels and, due to the amplitude compression used in their hearing aids, they received little if any gain (Chasin & Hockley, 2013).
The responses for the next two statements, “Help hear soft passages without the louder parts being too loud” and “Make the music sound too loud,” show that slightly more than a quarter of the respondents were able to hear soft sounds and were happy with the level of the louder passages, implying that both gain and amplitude compression were suitable for them. On the other hand, another quarter of the respondents thought that the music sounded too loud, implying that the hearing aids provided too much high-level gain, probably because not enough compression was used (Kates, 2008). Because almost 50% of the respondents did not agree with either of these two statements, it is reasonable to assume that they thought that their hearing aids do not make music too loud but also that their hearing aids do not help them hear the softer passages, implying that they need more gain for weaker sounds.
The responses for Statements 4 to 7 indicate that 40% of respondents found that their hearing aids made music more clear while 19% found that they made it less clear. Also, 33% of respondents thought that their hearing aids made it easier to hear out individual instruments, while 18% thought that they made it harder.
The responses for the two statements about distortion (Statements 8 and 9) show that more than half (53%) of the respondents found that their hearing aids either “sometimes” or “often” made music sound distorted. Distortion is likely to be caused by clipping or overload of the circuitry, resulting from the high levels typical of many types of live music, as described in the “Introduction” section (Chasin & Hockley, 2013; Dillon, 2012). Significantly larger proportions of the respondents who experienced acoustic feedback than of those who did not experience feedback reported that their hearing aids “sometimes” or “often” made music sound distorted (sometimes: 43% vs. 26%, χ2 = 13.1, p < .001; often: 28% vs. 18%, χ2 = 6.04, p = .014), df = 1. Because acoustic feedback is associated with high gain and therefore high output levels, this suggests that at least part of the distortion arises at the output stage; distortion is not restricted to the A/D converter. In addition, perceived distortion could be caused by changes in temporal envelope due to the use of fast-acting amplitude compression (Croghan et al., 2014), by the use of FC or lowering (Robinson, Baer, & Moore, 2007), or by artifacts produced by feedback cancellation systems (Freed & Soli, 2006; Merks, Banerjee, & Trine, 2006).
Twenty-one percent of the respondents agreed that their hearing aids “Make the music seem too bright or shrill,” implying that the frequency-gain characteristics of the hearing aids were not appropriate for music. This may be a consequence of too much high-frequency gain, too little low-frequency gain, or a combination of the two. However, in cases with a severe low-frequency loss, it may not be possible for a hearing aid to provide sufficient gain to achieve a better tonal balance. Statement 10 about music being too bright or shrill is related to Statement 11 that hearing aids “Make the music seem lacking in bass.” However, a smaller proportion of the respondents agreed with this statement (17%), implying that even if people find the sound shrill, they do not necessarily feel or are aware of a lack of bass.
The responses for Statements 12 and 13 showed that a slightly larger proportion (29%) found that hearing aids worsened the tone quality of music than found that hearing aids improved the tone quality of the music (21%). About half of the respondents did not think that their hearing aids affected the tone quality of music. For Question 21, the respondents were asked to rate the ease of hearing out individual notes and following melodic lines. Between 66% and 86% of the respondents listened to each of the different types of music. The proportion of responses for the means estimated across the different types of music (lower right panel of Figure 3) shows a peak at “Fairly easy.” The pattern of responses is very similar for most of the individual music types. However, the distributions of responses for “Full orchestra,” “Piano and Orchestra,” and “Rock band” deviate, in that a larger proportion of the respondents found it more difficult to hear out individual tones and melodic lines for these types of music. Music with a full orchestra can be very complex, often with many instruments playing different melodic lines at the same time. A rock band may be challenging due to the high sound levels and the deliberate use of distortion.
Rank-sum multiple comparisons between the patterns of responses for the different music types showed that the responses for full orchestra were significantly different from the responses for folk and country band (W = 60,618.5, p < .001), solo cello (W = 101,496, p < .001), solo guitar (W = 113,863.5, p < .001), solo piano (W = 121,580, p < .001), solo violin (W = 105,566, p < .001), and voice and piano (W = 113,300, p < .001); the responses for piano with orchestra were significantly different from the responses for folk and country band (W = 59,600, p < .001), solo cello (W = 95,717.5, p < .001), solo guitar (W = 107,339, p < .001), solo piano (W = 114,591, p < .001), solo violin (W = 99,283.5, p < .001); and the responses for rock band were significantly different from the responses for folk and country band (W = 45,992, p < .001), jazz trio (W = 52,886, p < .001), solo cello (W = 93,990, p < .001), solo guitar (W = 105,602, p < .001), flute and piano (W = 88,166, p < .001), solo piano (W = 112,763, p < .001), solo violin (W = 98,493, p < .001), string quartet (W = 90,187, p < .001), voice and piano (W = 106,355, p < .001), and wind quintet (W = 75,383, p < .001). The responses for solo cello, solo guitar, and solo piano were significantly different from the responses for many of the other music types. In addition to the significant differences mentioned earlier, the responses for solo cello, solo guitar, and solo piano, respectively, were significantly different from the responses for jazz trio (W = 72,900.5, p < .001; W = 81,589.5, p < .001; and W = 87,221.5, p < .001), flute and piano (W = 56,094, p < .001; W = 63,366.5, p < .001; W = 94,254, p < .001), string quartet (W = 56,353, p < .001; W = 63,641.5, p < .001; W = 69,429, p < .001), voice and piano (W = 67,581, p < .001; W = 76,369, p < .001; W = 83,167.5, p < .001), and wind quintet (W = 46,493, p < .001; W = 52,465.5, p < .001; W = 57,304, p < .001).
From Figure 3, it can be seen that although the patterns of responses for solo cello, guitar, and piano were very similar to the pattern for the mean, there were relatively more “Very easy” responses for the solo cello, guitar, and piano than for the other music types. It is likely that it is easier to hear out individual tones and melodic lines for these single instruments. However, the proportion of “Very easy” responses for solo violin was slightly smaller and the responses for this were not significantly different from those for most of the other music types. Perhaps the reason for this is the higher frequency range of the violin, which coincides more with the frequency regions where many people have a hearing loss. In general, a large proportion of respondents found it difficult to hear individual melodic lines for rock and orchestral music, while they found it easier for solo cello, solo guitar, and solo piano.
In summary, 76% of the respondents found their hearing aids to be helpful for listening to reproduced music. However, only 62% of respondents found their hearing aids to be helpful for listening to live music, probably reflecting the worsened sound quality that can occur due to input peak clipping or CL or overload of the output transducers when listening at the high sound levels that are typical of some types of live music. Such high sound levels are also likely to be one reason why more than half (53%) of the respondents reported that their hearing aids sometimes or often made music sound distorted. Furthermore, only 28% agreed that they could comfortably hear both soft and loud passages, while 25% found that the loud passages were too loud, implying that the automatic gain control systems in the hearing aids were not performing as well as would be desired. Another problem, encountered by 36% of the respondents, was acoustic feedback, indicating that improved feedback cancellation is necessary and that current systems do not work optimally for music.
Group Differences
The distributions of responses for the questions concerned with listening to music (Questions 17–21) were compared for different subgroups of the respondents according to their responses for each of the first 16 questions, except Questions 6, 7, and 14. Group differences were not analyzed in relation to manufacturer of hearing aids (Question 14) because there were often relatively small numbers in the different subgroups (given the large number of manufacturers).
Hearing aids in one or two ears (Question 2)
Respondents with one and two hearing aids were identified using the responses to Question 2: “Do you use hearing aid(s) for one hour a day or more?” The first group consisted of participants responding either “Yes, in the left ear only” (n = 44; 8.4%) or “Yes, in the right ear only” (n = 37; 7.1%), and the second group included all people responding “Yes, in both ears” (n = 442; 85%). Statistical tests showed no significant differences between the responses for the group wearing one hearing aid and for the group wearing two hearing aids for any of the questions regarding listening to music.
Type of hearing loss (Question 3)
The respondents were grouped according to their responses to Question 3: “Is your hearing loss conductive (n = 50), sensorineural (n = 260), or a combination of the two (mixed; n = 59)?” The group responding “Don’t know” (n = 154) was not included in the analysis.
The proportion of respondents experiencing acoustic feedback varied across groups (χ2 = 15.66, df = 2, p < .001). The left panel of Figure 4 shows that a smaller proportion of the group with sensorineural hearing loss experienced feedback than for the other groups. However, the proportion of respondents experiencing feedback for the group with sensorineural hearing loss was only significantly smaller than for the group with mixed hearing loss (χ2 = 13.74, df = 1, p < .001, α = .017) but not for the group with conductive hearing loss.
Figure 4.
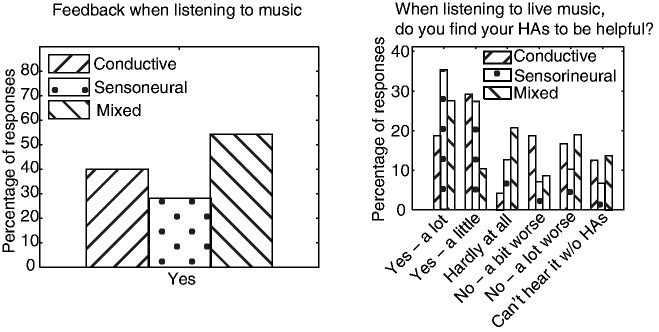
Percentage of responses for groups with different types of hearing loss for Question 17 regarding acoustic feedback (left panel) and Question 19 regarding how helpful hearing aids (HAs) are for listening to live music (right panel), excluding responses to option 6 (I don’t wear hearing aids when listening to music).
The responses to Question 18, “When listening to music via radio, TV or stereo system, do you find your hearing aids to be helpful?” and to Question 21, regarding the ease of hearing out individual notes and melodic lines were independent of the type of hearing loss. On the other hand, there was a significant difference across groups for Question 19, “When listening to live music, do you find your hearing aids to be helpful?” (χ2 = 27.91, df = 10, p = .0019). The right panel of Figure 4 shows that a larger proportion of the group with sensorineural hearing loss than of the other groups responded “Yes a lot” and a smaller proportion of this group than of the other groups responded “No a lot worse.” Multiple comparisons showed that there were significant differences between the responses for the group with sensorineural hearing loss and those for both of the other groups (sensorineural vs. conductive: χ2 = 14.62, df = 5, p = .012; sensorineural vs. mixed: χ2 = 14.31, df = 5, p = .014, α = .017). These results imply that a larger proportion of the group with sensorineural hearing loss than of the other groups found their hearing aids to be helpful for listening to live music. This may be the case because hearing aids are usually programmed to provide less amplitude compression for people with conductive or mixed hearing loss than for people with sensorineural hearing loss. As a result, gains for high input levels are greater for the former than for the latter, possibly leading to overload of output amplifiers and transducers, and hence to more perceived distortion for the former. Furthermore, a smaller proportion of the group with sensorineural hearing loss than of the other groups responded that they needed their hearing aids to hear live music. This is consistent with the fact that most people with sensorineural hearing loss experience loudness recruitment, while those with mixed hearing loss experience less recruitment, and those with conductive hearing loss experience little or no recruitment (Dillon, 2012; Hood, 1972; Moore, 2007).
For Question 20, there were significant differences across hearing-loss groups for the following statements about hearing aids: “Make the music sound more clear” (χ2 = 13.68, p = .0011), “Make the music sound less clear” (χ2 = 6.21, p = .045), “Make it easier to hear the individual instruments” (χ2 = 13.17, p = .0014), and “Improve the tone quality of the music” (χ2 = 9.86, p = .0072), df = 2.
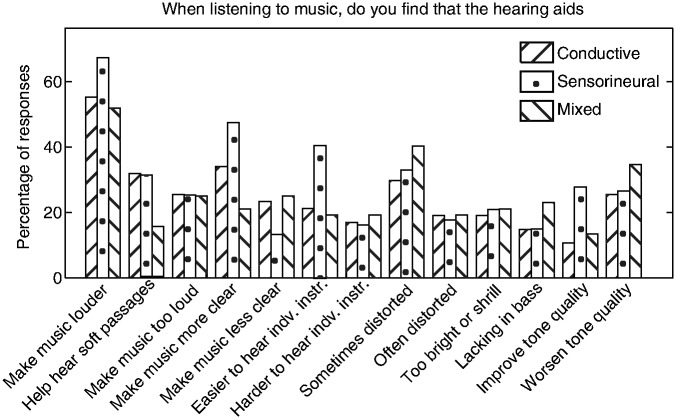
Figure 5 shows that a larger proportion of respondents with sensorineural hearing loss than for the other groups agreed with the statements that their hearing aids: “Make the music sound more clear,” “Make it easier to hear the individual instruments,” and “Improve the tone quality of the music.” A smaller proportion of the group with sensorineural hearing loss than of the other groups agreed with the statement “Make the music sound less clear.” Multiple comparison showed that the responses of the group with sensorineural hearing loss were significantly different from the responses for the group with mixed hearing loss for the statements “Make the music sound more clear” (χ2 = 11.19, df = 1, p < .001) and “Make it easier to hear the individual instruments” (χ2 = 7.62, df = 1, p = .0058), for α = .017, but were not significantly different from the responses for the group with conductive hearing loss for any of the statements. These results show that a larger proportion of the group with sensorineural hearing loss than of the other groups found that their hearing aids made it easier to hear out individual instruments and were more satisfied with the sound when listening to music with their hearing aids.
Figure 5.
Percentage of respondents for each of the groups with different types of hearing loss agreeing with each of the statements in Question 20.
The overall higher satisfaction for the sensorineural group that was seen in responses to Questions 17, 19, and 20 may indicate that hearing aids are more effective for sensorineural than for mixed or conductive losses for listening to music. This at first sight appears surprising, as the reduced hearing-aid amplitude compression used with conductive and mixed hearing losses might be expected to improve rather than impair sound quality (Arehart et al., 2011). However, as described earlier, the near-linear amplification used for people with conductive hearing loss means that higher gains are used for high input levels which might introduce distortion in the output stage for high-level sounds. Also, or alternatively, the hearing-aid gains may have been insufficient for those with conductive or mixed losses, and this could have contributed to reduced satisfaction.
It is a little surprising that the responses for the group with mixed hearing loss differed more from the responses for the group with sensorineural hearing loss than from the responses for the group with conductive hearing loss; one might expect responses for the mixed hearing loss group to be intermediate between those for the other two groups. However, it may be more difficult to fit a hearing aid optimally to a mixed hearing loss than to either a pure conductive or a sensorineural hearing loss.
In summary, there were significant differences between the responses of the different groups for Questions 17, 19, and 20. In general, larger proportions of the group with sensorineural hearing loss were happy with the performance of their hearing aids when using them for listening to music than for the other two groups. This is likely to be due to the higher gain used for mixed and conductive hearing losses that can increase the probability of acoustic feedback and distortion.
Duration of hearing loss (Question 4)
The respondents were grouped according to the duration of their hearing loss. The two groups with hearing loss <1 years and 1–5 years were merged because of chi-square expected values less than 1. Thus, the four groups considered here had hearing loss for ≤5 years (n = 70), 5–10 years (n = 98), 10–20 years (n = 103), and >20 years (n = 252). The proportion of respondents experiencing acoustic feedback varied across groups (χ2 = 16.97, df = 2, p < .0001). Multiple comparisons showed that only the difference between the proportion of responses for the <5 years group and the >20 years group was significant (χ2 = 13.92, df = 1, p < .001), α = .0083. Figure 6 shows that a greater proportion of the <5 years group and a smaller proportion of the >20 years group than for the other groups experienced feedback, implying that the longer the duration of the hearing loss, the less likely the respondents were to have experienced feedback. This is surprising, as the groups with hearing loss for the longest time generally included the largest proportion of people with severe and profound hearing loss (see Table 4), who ought to have received the largest amount of gain from their hearing aids, increasing the likelihood of feedback. It may be that the people who had not had their hearing loss for a long time were more sensitive to artifacts from their hearing aids and therefore were more likely to report feedback. Additionally, people with severe or profound hearing loss may not hear acoustic feedback.
Figure 6.
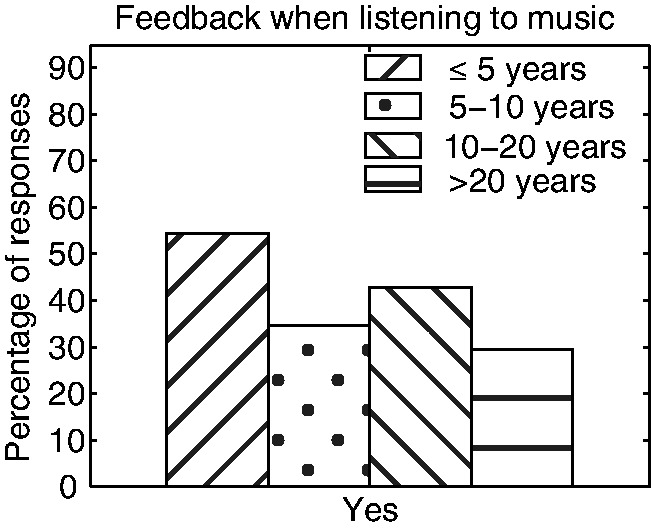
Percentage of responses for Question 17 for groups with different durations of hearing loss.
Table 4.
Relationship Between Duration of Hearing Loss (Question 4) and Degree of Hearing Loss (Question 5).
| Duration of hearing loss |
||||
|---|---|---|---|---|
| ≤5 years | 5–10 years | 10–20 years | >20 years | |
| Mild | 10 (14%) | 16 (16%) | 4 (3.9%) | 4 (1.6%) |
| Moderate | 37 (53%) | 49 (50%) | 47 (46%) | 46 (18%) |
| Severe | 18 (26%) | 28 (29%) | 40 (39%) | 128 (51%) |
| Profound | 5 (7.1%) | 5 (5.1%) | 12 (12%) | 74 (29%) |
Note. Percentages in parentheses are calculated for each column, that is, within groups that had hearing loss for similar lengths of time.
For Question 18, a chi-square p-value <.001 (χ2 = 38.91, df = 15) implied that the ease of listening to music via radio, TV, or stereo system varied across groups. Multiple comparisons showed that there was a significant difference between the responses for the group with hearing loss >20 years and for each of the other groups (<5 years vs. >20 years: χ2 = 23.79, p < .001; 5–10 years vs. >20 years: χ2 = 18.69, p = .0022; 10–20 years vs. >20 years: χ2 = 15.55, p = .0082), df = 5 and α = .0083. The left panel of Figure 7 shows that a larger proportion of the >20 years group than for the other groups responded “Yes—a lot” and “I can’t hear music via the TV or radio without my hearing aids,” indicating that a larger proportion of this than the other groups benefitted from their hearing aids when listening to reproduced music.
Figure 7.
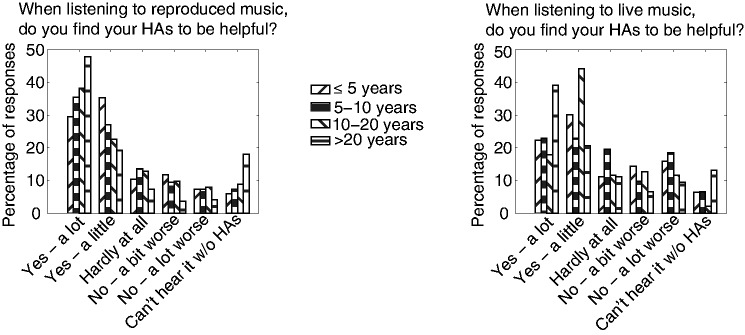
Percentage of responses for Questions 18 and 19 for groups with different durations of hearing loss.
A chi-square p-value <.001 (χ2 = 54.21, df = 15) for Question 19 implied that the ease of listening to live music also varied significantly for groups with different durations of hearing loss. The right panel of Figure 7 shows that a greater proportion of the group with hearing loss for more than 20 years than for the other groups found their hearing aids to be helpful for live music. However, multiple comparisons showed that the difference was only significant between the >20 years group and the 5–10 years group (χ2 = 16.87, p = .0048) and between the >20 years group and the 10–20 years group (χ2 = 34.92, p < .001), df = 5. Overall, these results indicate that a larger proportion of the >20 years group benefitted from using their hearing aids for listening to live music than for the other groups. The reason for this and the similar results for Question 18 might be that a larger proportion of the >20 years group than of the other groups had severe or profound hearing loss (see Table 4). People with a more severe hearing loss are more in need of hearing aids and are therefore more likely to find them helpful. Also, the >20 years group may have reported greater benefit because they had grown accustomed to artifacts introduced by hearing aids.
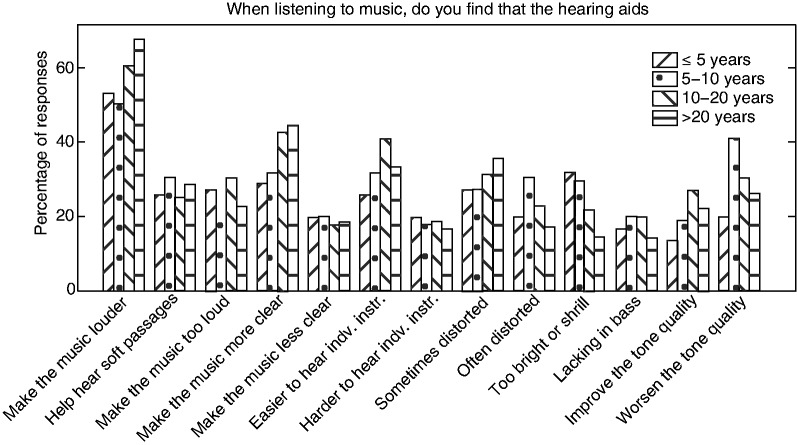
Generally, the proportion of responses for the different groups was similar for Question 20 (see Figure 8). However, for Question 20, there was a significant difference between proportions for the statements: “Make music louder” (χ2 = 10.33, p = .016), “Make the music sound more clear” (χ2 = 8.47, p = .037), “Make the music seem too bright or shrill” (χ2 = 14.61 p = .0022), and “Worsen the tone quality of the music” (χ2 = 10.54, p = .015), df = 3.
Figure 8.
Percentage of respondents for each of the groups with different durations of hearing loss agreeing with each of the statements in Question 20.
Multiple comparisons showed that there was a significant difference between the proportion of respondents finding that their hearing aids “Make music louder” for the 5–10 years and the >20 years groups (χ2 = 7.63, df = 1, p = .0058). Also, in general, the proportion of respondents agreeing with this statement increased with increasing duration of hearing loss. The reason for this might be that a larger proportion of the groups with hearing loss for the longest time had severe and profound hearing loss and therefore received higher gain.
A greater proportion of the two groups who had their hearing loss for the longest time agreed that their hearing aids “Make the music sound more clear,” and a smaller proportion of these groups agreed that their hearing aids “Make the music seem too bright or shrill.” However, multiple comparisons showed that there was only a significant difference for the latter of the two statements and only between the proportion of responses for the <5 years and the >20 years groups (χ2 = 9.15, df = 1, p = .0025) and for the 5–10 years and the >20 years groups (χ2 = 8.91, df = 1, p = .0028).
A greater proportion of the 5–10 years group agreed that their hearing aids worsened tone quality, but there was not a monotonic relationship between the duration of hearing loss for a group and the proportion of the group agreeing with this statement. Multiple comparisons showed that the only significant difference was between the responses for the <5 years and the 5–10 years groups (χ2 = 7.18, df = 1, p = .0074).
Overall, these results imply that the groups with the longest duration of hearing loss were more satisfied with some aspects of the sound quality when listening to music with their hearing aids. This higher level of satisfaction is probably related to the fact that a larger proportion of these groups had more severe hearing loss and therefore needed their hearing aids more than the other groups.
The responses for Question 21, regarding the ease of hearing out individual notes and melodic lines, were independent of the duration of hearing loss.
In summary, a larger proportion of the group who had the longest duration of hearing loss (>20 years) were satisfied with their hearing aids and experienced less acoustic feedback than the other groups. The proportion of respondents experiencing feedback decreased with increasing duration of hearing loss. For Questions 18 and 19, a larger portion of the >20 years group found their hearing aids to be helpful than for the other groups, and a larger proportion of this group needed their hearing aids for listening to either recorded or live music. The responses for Question 20 also point in that direction. The proportion of respondents agreeing with the statements that their hearing aids “Make the music louder” and “Make the music clearer” increased with increasing duration of hearing loss, whereas the opposite was the case for the statement, “Make music seem too bright or shrill” and to some extent for the statement that hearing aids “Worsen tone quality.”
Degree of hearing loss (Question 5)
The respondents were divided into groups with mild (n = 34), moderate (n = 179), severe (n = 214), and profound (n = 96) hearing loss, according to their responses to Question 5. The proportion of people experiencing feedback was independent of degree of hearing loss. For Question 18, a chi-square p-value <.001 (χ2 = 51.19, df = 15) implied that the proportion of people finding their hearing aids to be helpful when listening to reproduced music varied significantly with degree of hearing loss. The left panel of Figure 9 shows that the proportion of people responding “I can’t hear music via the TV, radio or stereo without my hearing aids” increased with increasing severity of hearing loss. For the groups with moderate, severe, and profound hearing loss, the proportion of respondents finding their hearing aids to be helpful increased with severity of hearing loss (moderate: 72%; severe: 77%; profound: 84%) when including responses for the option “I can’t hear music via the TV or radio without my hearing aids.” However, the proportion of the group with mild hearing loss finding their hearing aids to be helpful was larger than for the other groups (91%), even though no one from this group responded that “I can’t hear music via the TV, radio or stereo without my hearing aids radio, TV or stereo system.” Instead, a much larger proportion of the group with mild hearing loss than of the other groups chose the option “Yes a little,” indicating that most people from this group found their hearing aids to be helpful to some extent.
Figure 9.
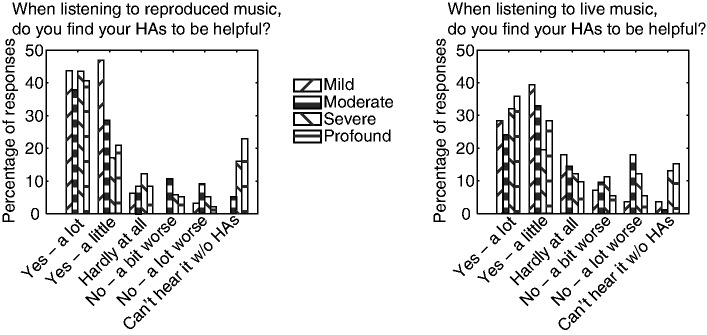
Percentages of responses for groups with different degrees of hearing loss for Questions 18 (left panel) and 19 (right panel).
Multiple comparisons showed that there were significant differences between the responses for the groups with mild and severe hearing loss (χ2 = 19.88, df = 5, p = .0013), between the groups with moderate and severe hearing loss (χ2 = 23.23, df = 5, p < .001), and between the groups with moderate and profound hearing loss (χ2 = 25.57, df = 5, p < .001), α = .0083.
The responses across groups also varied significantly for Question 19, regarding how helpful hearing aids are for listening to live music (χ2 = 45.41, df = 15, p < .001). The right panel of Figure 9 shows that the main difference between the responses for Questions 18 and 19 was that for all groups, there was a smaller proportion of respondents finding their hearing aids to be helpful for live music (mild: 71%, moderate: 58%, severe: 64%, profound 79%). Otherwise, the pattern of responses was fairly similar for the two questions.
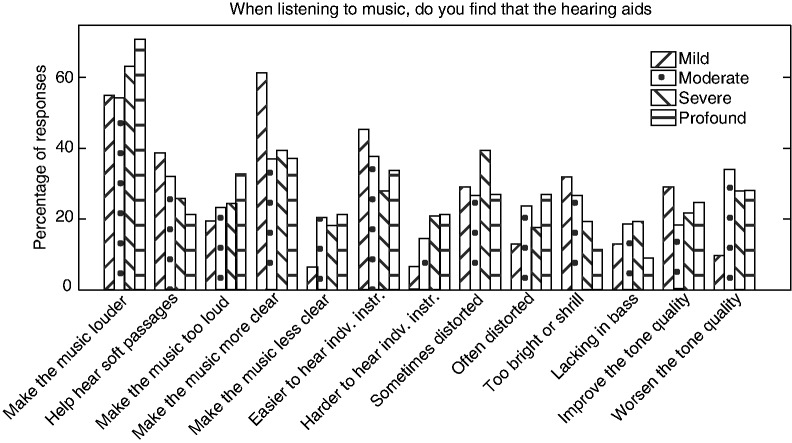
For Question 20, there were significant differences between the proportions of responses for the different groups for the statements: “Sometimes make the music seem distorted” (χ2 = 8.47, p = .037), “Make the music seem too bright or shrill” (χ2 = 11.05, p = .011), and “Worsen the tone quality of the music” (χ2 = 8, p = .046), df = 3. Figure 10 shows that a larger proportion of the group with severe hearing loss than for the other groups found that their hearing aid “Sometimes make the music seem distorted,” although the group with severe loss did not report that their hearing aids “Often make the music seem distorted” more than the groups with moderate or profound loss. Overall, reports of music sometimes or often sounding distorted were lowest for the group with mild loss. This makes sense, as the group with mild loss would require lower output levels than the other groups and therefore were less likely to experience problems with overload of transducers and peak clipping or CL.
Figure 10.
Percentage of responses for Question 20 for groups with different degrees of hearing loss.
There was a clear tendency for the proportion of people agreeing that their hearing aids make the music seem too bright or shrill to decrease with increasing degree of hearing loss. This might indicate that groups with milder hearing loss are more likely to have hearing aids that provide either too much high-frequency gain, too little low-frequency gain, or a combination of the two. This may be partly the result of poor initial fitting of the open-fit hearing aids that are often used for people with mild or moderate hearing loss (Aazh, Moore, & Prasher, 2012). Alternatively, people with more severe hearing loss may be less bothered by an excess of high-relative to low-frequency gain. For this statement, only the difference between the proportion of responses for groups with moderate and profound hearing loss was significant (χ2 = 7.36, df = 1, p = .0067), α = .0083.
For the statement “Worsen the tone quality,” a much smaller proportion of people with a mild than with a more severe hearing loss found that their hearing aids worsened tone quality.
Figure 11 shows the responses for Question 21 for full orchestra (left panel) and the mean responses across music types (right panel). It can be seen that there is a clear tendency for the difficulty of hearing out individual tones and musical lines to increase with increasing severity of hearing loss. Such overall tendencies were found for each of the individual music types. However, the differences across groups were significant only for folk and country band (K = 18.5, p < .001), full orchestra (K = 31.47, p < .001), jazz trio (K = 13.55, p = .0036), piano and orchestra (K = 19.66, p < .001), string quartet (K = 20.50, p < .001), voice and piano (K = 13.70, p = .0033), and wind quintet (K = 22.39, p < .001), α = .0038, and for the mean across music types (K = 11.83, p = .008), α = .05. This includes most of the types of music with more than one instrument, except the rock band. There was less variation between the responses across groups for the rock band because a larger proportion of the groups with milder hearing loss found it difficult to hear individual tones and melodic lines for this type of music.
Figure 11.
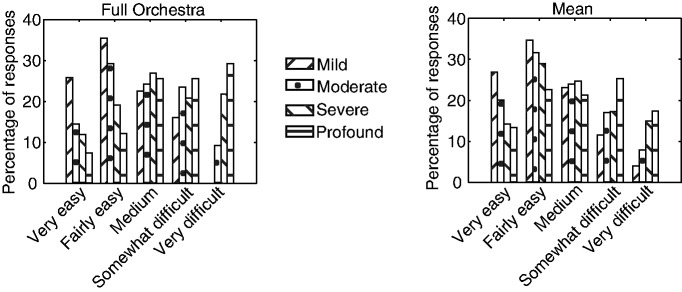
Responses for full orchestra (left panel) and mean responses across music types (right panel) for groups with different degrees of hearing loss for Question 21.
Rank-sum multiple comparison tests showed that the responses varied significantly (α = .00064) between the groups with mild and severe hearing loss for folk and country band (W = 882.5, p = .00053) and full orchestra (W = 1,662.5, p < .00021); between the groups with mild and profound hearing loss for folk and country band (W = 321.5, p = .00015), full orchestra (W = 568, p < .0001), and string quartet (W = 554.5, p = .00041); and between the groups with moderate and profound hearing loss for full orchestra (W = 4,231.5, p < .0001), string quartet (W = 3,515, p = .00022), and wind quintet (W = 2,406, p < .0001). For the mean across music types, the proportion of responses varied between the groups with mild and profound hearing loss (W = 637.5, p = .0070), and moderate and profound hearing loss (W = 3,813.5, p = .0076), α = .0083.
In summary, the proportion of respondents answering that they cannot hear reproduced or live music without their hearing aids generally increased with increasing severity of hearing loss. Similarly, the proportion of people finding it difficult to hear out individual tones and melodic lines increased with increasing degree of hearing loss. On the other hand, the proportion of people reporting that their hearing aids made music seem too bright or shrill decreased with increasing degree of hearing loss. Responses for Question 20 also showed that a larger proportion of the group with severe hearing loss found that music was sometimes distorted and that a much smaller proportion of the group with mild hearing loss than for the other groups found that their hearing aids sometimes made music seem distorted. The latter finding might be explained by the fact that people with mild hearing loss need less gain than for more severe hearing loss and therefore are less likely to experience distortion caused by overload of output transducers or output peak clipping. Finally, the proportion of people finding their hearing aids to be helpful for reproduced music increased with increasing hearing loss for the groups with moderate, severe, and profound hearing loss but was largest for the group with a mild hearing loss. The proportion of people finding their hearing aids to be helpful for live music was smaller than that for reproduced music for all groups.
Spectral pattern of hearing loss (Question 8)
The respondents were grouped according to the spectral pattern of their hearing loss. This resulted in four groups with hearing losses that were greatest at: high frequencies (n = 275), low frequencies (n = 58), medium frequencies (n = 49), or almost the same at all frequencies (n = 141).
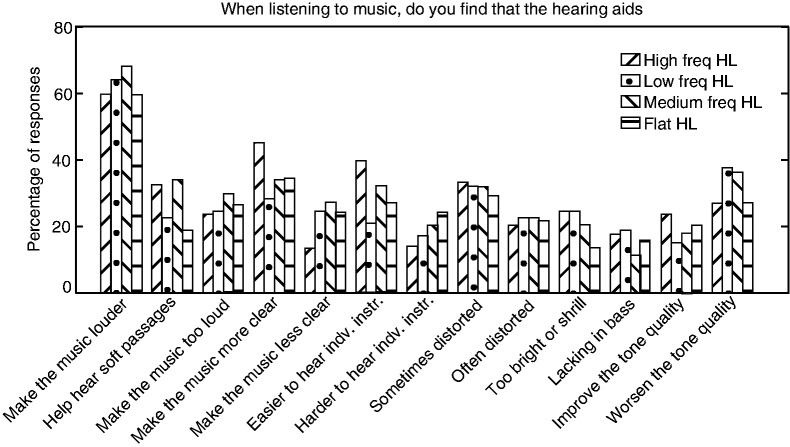
The responses were independent of the pattern of hearing loss for Question 17 regarding feedback and Questions 18 and 19 regarding how helpful hearing aids were for listening to reproduced and live music, respectively. For Question 20, there were significant differences between the proportion of responses across groups for the statements that hearing aids: “Help me hear softer passages without the louder parts being too loud” (χ2 = 9.87, p = .020); “Make the music sound more clear” (χ2 = 8.22, p = .042); “Make the music sound less clear” (χ2 = 10.61, p = .014); and “Make it easier to hear the individual instruments” (χ2 = 10.57, p = .014); df = 3. Figure 12 shows that larger proportions of the groups with high- and medium-frequency hearing losses found that their hearing aids helped them “hear softer passages without the louder parts being too loud,” implying that a larger proportion of these two groups had hearing aids that provided appropriate gain and amplitude compression. Multiple comparison tests showed that the responses varied significantly (α = .0083) between the groups with high-frequency and flat hearing loss (χ2 = 7.63, df = 1, p = .0057). The larger proportions of responses for the groups with high- and medium-frequency hearing losses and the fact that the proportion of respondents finding that their hearing aids “make the louder parts too loud” was similar across groups, suggest that larger proportions of the groups with medium-frequency and flat hearing loss did not find that the louder parts were too loud but could not hear soft passages, indicating that their hearing aids did not provide sufficient gain.
Figure 12.
Percentages of responses for groups with low-frequency hearing loss (Low freq HL), high-frequency hearing loss (High freq HL), medium-frequency hearing loss (Medium freq HL), and flat hearing loss (Flat HL) for Question 20.
Fifty-one percent of each of the groups with high-frequency and medium-frequency hearing loss had severe or profound hearing loss, whereas the proportion was slightly higher (55%) for the group with low-frequency hearing loss and much higher (79%) for the group with flat hearing loss. For the group with flat hearing loss and to some extent also for the group with low-frequency loss, this might explain why larger proportions gave responses suggesting that their hearing aids did not provide enough gain. For the group with low-frequency hearing loss, insufficient gain might also have occurred because many hearing aids have limited gain at low frequencies (Dillon, 2012).
Figure 12 also shows that a larger proportion of the group with high-frequency hearing loss than for the other groups found that their hearing aids made music sound more clear and that a smaller proportion of this group found that hearing aids made music sound less clear. Similarly, a larger proportion of this group and a smaller proportion of the group with low-frequency hearing loss than for the other groups found that hearing aids made it easier to hear out individual instruments. These findings again suggest that people with high-frequency hearing loss are more likely to be satisfied with the performance of their hearing aids than people from other groups.
For Question 21, the ease of hearing out individual tones and melodic lines of music was independent of the pattern of hearing loss except for the solo cello (χ2 = 14.82, p = .0020) and string quartet (χ2 = 18.27, p < .001), df = 3. Figure 13 shows the responses for string quartet (left panel) and the mean responses across music types (right panel). For the mean across music types, there was a nonsignificant trend for the proportion of “very difficult” responses to be smaller for the high- and medium-frequency hearing loss groups. This was also the case for the string quartet and solo cello, but for these music types, there was also a larger proportion of “fairly easy” responses for the high-frequency and medium-frequency loss groups. This suggests that these groups found it slightly easier to hear out individual tones and melodic lines. Multiple-comparison rank-sum tests showed that the difference between responses for the different groups was significant only between the groups with medium and flat hearing loss for the string quartet (W = 1,268.5, p = .00046), α = .00064.
Figure 13.
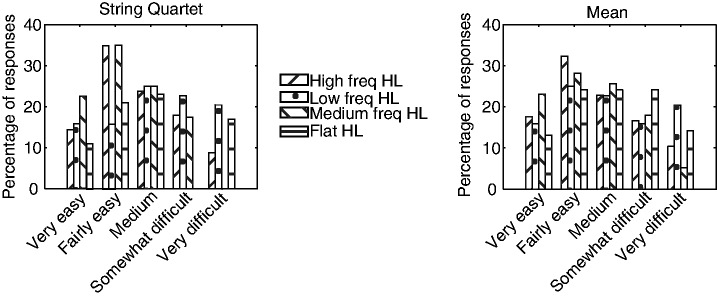
Percentage of responses for Question 21 for groups with different patterns of hearing loss. The left panel shows the responses for the string quartet and the right panel shows the mean responses across the 13 music types.
In summary, slightly larger proportions of people with hearing loss predominately at high or medium frequencies than for the other groups found it easier to hear individual tones and melodic lines and greater proportions of these groups found that their hearing aids made them able to hear soft passages while not making the louder parts too loud. The latter observation, and the fact that similar proportions across groups found that their hearing aids made the loud passages too loud, suggests that people with a flat hearing loss or a hearing loss mainly at low frequencies tend to have insufficient gain in their hearing aids. Furthermore, a larger proportion of the group with high-frequency hearing loss than for the other groups found that their hearing aids made music clearer and made it easier to hear individual instruments. Overall, people with high-frequency and to some extent with medium-frequency hearing loss were more likely to be satisfied with their hearing aids for listening to music than the other groups.
Age (Question 9)
Respondents were grouped according to their age. The two youngest and the two oldest groups were merged due to expected values <1. Thus, the age ranges (in years) of the seven groups considered here were <21 (n = 21), 21–30 (n = 47), 30–40 (n = 75), 40–50 (n = 91), 50–60 (n = 93), 60–70 (n = 108), and ≥70 (n = 88).
The responses for Question 17 regarding acoustic feedback and Question 18 regarding how helpful hearings aids are for listening to reproduced music were independent of age group. The responses for Question 19 regarding how helpful hearing aids are for listening to live music did vary across groups (χ2 = 59.07, df = 30, p = .0012). Figure 14 shows that both the <21 years group and to a lesser extent the 50–60 years group had a smaller proportion of “Yes—a lot” responses and a larger proportion of “No—a lot worse” responses. This implies that these groups found their hearing aids to be less helpful than the other groups. However, the relationship between age and how helpful hearing aids were for live music was not monotonic.
Figure 14.
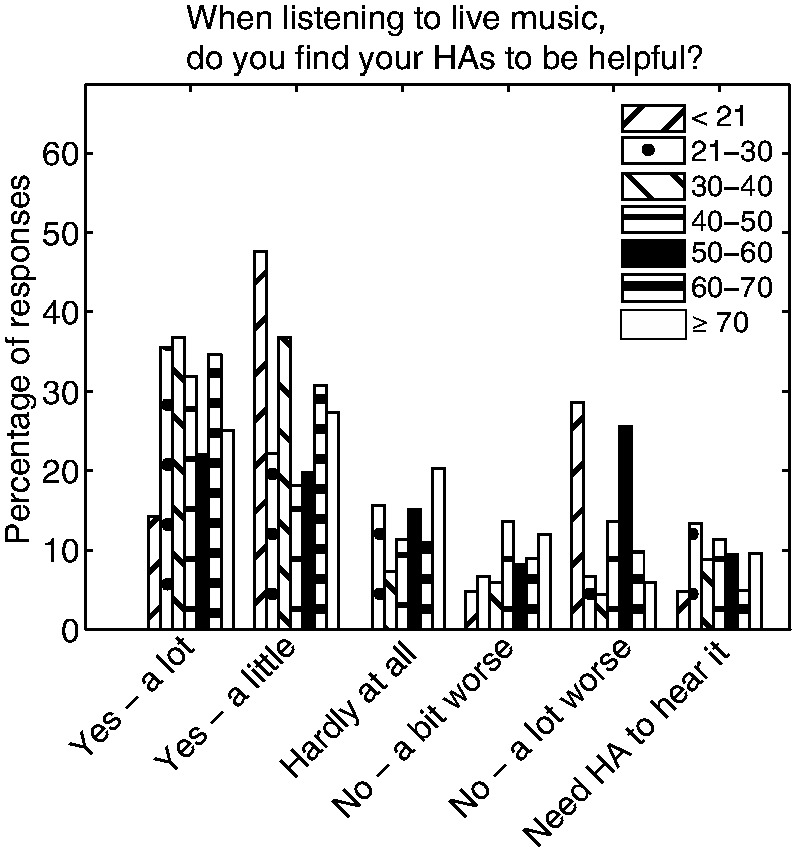
Percentage of responses for different age groups for Question 19.
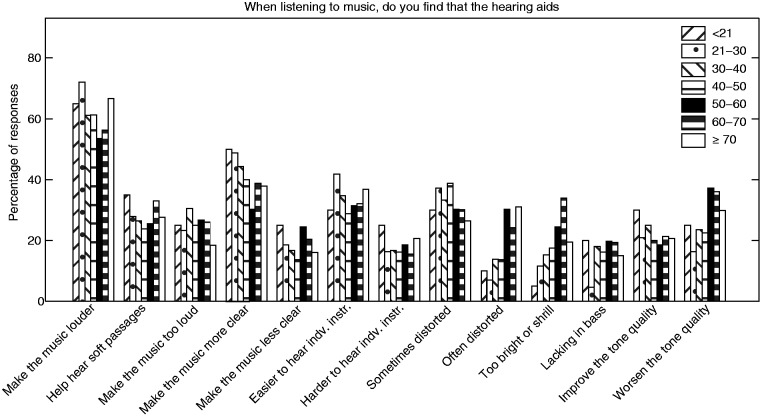
For Question 20, only the responses to Statement 9 that hearing aids “often make music seem distorted” (χ2 = 21.50, p = .0015) and to Statement 10 that hearing aids “make the music seem too bright or shrill” (χ2 = 18.43, p = .0052) were not independent of age, with df = 6. Figure 15 shows that the proportion of respondents agreeing with Statement 9 generally increased with increasing age and was largest for the three oldest groups. This did not happen because the proportion of respondents with profound or severe hearing loss increased with age. The percentages of respondents with severe or profound hearing loss for each age group were as follows: <21 years: 47.6%, 21–30 years: 59.6%, 30–40 years: 73.3%, 40–50 years: 72.2%, 50–60 years: 61.3%, 60–70 years: 50%, and ≥70 years: 45.5%. Figure 15 also shows that the proportion of people finding that their hearing aids made music sound too bright or shrill increased montonically with increasing age, except for the ≥70 years group; the proportion of responses for this group was smaller than for the 50–60 years group and the 60–70 years group.
Figure 15.
Percentage of responses to each statement in Question 20 for groups of different ages.
For Question 21, the proportion of responses was independent of age for the mean across music types and for all of the individual music types except for rock band (K = 20.31, df = 6, p = .0024), α = .0038. Figure 16 shows that for rock music the proportion of “Very easy” responses was larger for the two youngest groups and the proportion of “Fairly easy” responses was larger for the youngest group than for the other groups, indicating that younger people find it easier to hear out melodic lines and individual tones, especially for rock music. Rank-sum multiple-comparison tests showed that the proportion of responses varied across groups for <21 years versus 50–60 years (W = 388.5, p = .00015) and for <21 years versus 60–70 years (W = 333, p < .0001), α = .00018.
Figure 16.
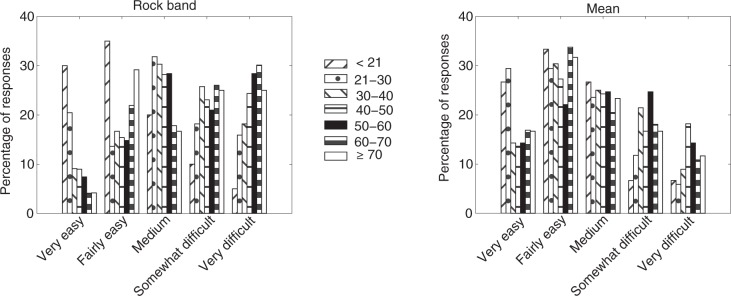
Proportion of responses for rock band (left panel) and the mean across music types (right panel) for groups of different ages for Question 21.
In summary, the responses for Question 19 regarding how helpful hearing aids are for music varied across groups, but there was no simple relationship between the responses and age. For Question 20, the proportion of people finding that hearing aids often make music seem distorted and that hearing aids make music seem too bright or shrill increased with increasing age, perhaps because the older groups were more likely to be able to compare the sound of music from their hearing aids with how it used to sound before they needed hearing aids.
Gender (Question 10)
The participants were grouped according to their gender (male: n = 237; female: n = 286). The proportion of responses was independent of gender for Questions 17 to 19 and for Question 21. For Question 20, the responses only varied across gender for the statements that hearing aids “Make the louder parts too loud” (χ2 = 13.57, p < .001) and “Make the music seem lacking in bass” (χ2 = 4.88, p = .027), df = 1. Figure 17 shows that a much larger proportion of the female respondents found that their hearing aids made the louder parts too loud. This is consistent with the finding of McGuinness (1972) that the mean highest comfortable loudness level across frequency was almost 8 dB higher for men than for women. The proportion of males finding that their hearing aids made the music seem lacking in bass was higher than for females, perhaps indicating that in general men prefer more bass than women.
Figure 17.
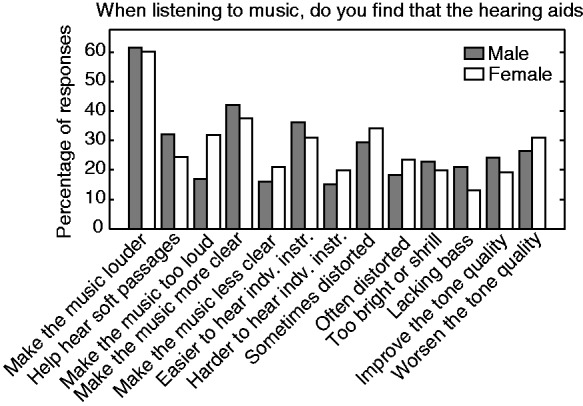
Responses of males and females for Question 20.
In summary, a larger proportion of females than males found that hearing aids made the louder parts too loud and a larger proportion of males than females found that hearing aids made music seem lacking in bass.
Musical training (Question 11)
The respondents were grouped according to the extent of their musical training/experience, as described in Table 1 (No training: n = 220; No training but amateur: n = 83; <1 year training: n = 21; 1–2 year training: n = 25; 2–5 years: n = 52; >5 years training: n = 85; and Professional: n = 35). The responses to Question 17 regarding acoustic feedback, and to Questions 18 and 19 regarding how helpful hearing aids are for reproduced and live music, respectively, were independent of extent of musical training/experience.
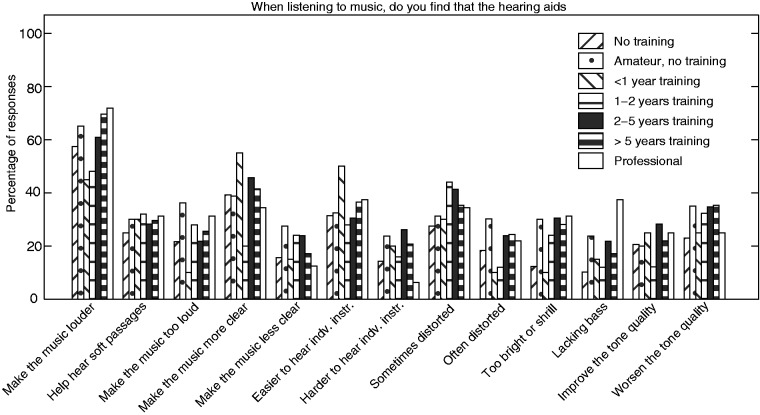
For Question 20, the proportion of respondents agreeing that hearing aids “Make the music seem too bright or shrill” (χ2 = 21.63, p = .0014) and “Make the music seem lacking in bass” varied with extent of training/experience (χ2 = 20.05, p = .0027), df = 6. Figure 18 shows that a smaller proportion of the two groups with the least experience (no training and <1 year training) found that hearing aids made music seem too bright or shrill. It is noticeable that the proportion of such judgments for the group who played or sang as amateurs but had no training was as large as for the groups with more training. However, it is likely that people from this group had a lot of experience despite the lack of training. If so, it would imply that people are more likely to notice an excess of high-frequency versus low-frequency gain when they have some musical training or have experience as a self-taught singer/musician. On the other hand, for the statement that hearing aids make music seem lacking in bass, only the group of professional musicians gave a higher proportion of responses than for the other groups. This suggests that a lack of bass is only more noticable for people with a large amount of musical training. Multiple comparison tests showed that the responses varied significantly (α = .00018) between the groups with no training and professional musicians (χ2 = 14.84, df = 1, p = .00012).
Figure 18.
Percentage of responses for Question 20 for groups with varying extents of training/experience.
For Question 21, the proportion of responses was independent of the extent of training/experience except for solo cello (K = 19.41, p = .0035) and voice and piano (K = 24.64, p < .001), α = .0038. The outcome of multiple-comparison rank-sum tests was significant only between the group with no training and the group with >5 years of training for voice and piano (W = 9,252, df = 1, p < .0001), α = .00018. Figure 19 shows that there was an overall tendency for people with a greater extent of musical training to find it easier to hear out individual tones and musical lines. This tendency is in accordance with earlier studies suggesting that people with musical training are better at segregating streams of notes than people without musical training (Beauvois & Meddis, 1997; Fine & Moore, 1993; Marozeau, 2013; Vliegen & Oxenham, 1999).
Figure 19.
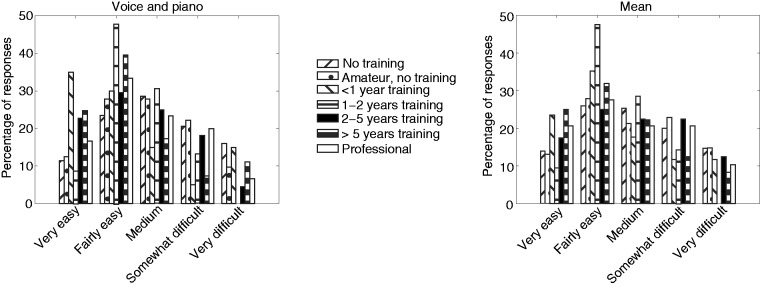
Percentage of responses for Question 21 for groups with different extents of musical training/experience for voice and piano (left panel) and the mean across music types (right panel).
In summary, the proportion of respondents reporting that hearing aids made music sound bright or shrill was noticeably smaller for the groups with <1 year musical training than for the other groups. The proportion of respondents reporting that hearing aids make music seem lacking in bass was greater for the group of professional musicians than for the other groups. For Question 21 regarding the ease of hearing out individual tones and melodic lines, responses only varied significantly across groups for solo cello and voice and piano. There was an overall tendency for increasing ease of hearing out tones and melodic lines with increased musical training or experience.
Type of hearing aid (Question 12)
The respondents were grouped according to the type of hearing aids they used. The groups with “In the canal” (n = 13) and “Completely in the canal” (n = 9) hearing aids were not included in the analysis because there were too few respondents with these types of hearing aids. Also the responses from the 15 people responding “Others” (n = 15) were not included. Many from the “Others” group had different types of hearing aids in the two ears. Thus, the four groups considered here had hearing aids of the type: “Behind the ear with earmold in the ear” (BTE with earmold, n = 300); “Behind the ear with thin tubing and a soft dome in the ear canal” (BTE with soft dome, n = 103); “Behind the ear with receiver (miniature loudspeaker) in the ear canal” (BTE with receiver in canal, n = 58); and “In the ear” (ITE, n = 25).
The proportion of respondents who experienced feedback varied across groups (χ2 = 16.51, df = 3, p < .001). Figure 20 shows that larger proportions of the groups with BTE with soft dome and ITE than for the other groups experienced acoustic feedback. However, multiple comparisons showed that the difference between the proportion of responses was only significant for BTE with earmold versus BTE with soft dome (χ2 = 11.81, df = 1, p < .001), α = .0083. Soft domes are often used with relatively “open” fittings, in which case sound amplified by the hearing aid can leak out of the ear canal and reach the microphone of the hearing aid with little attenuation, giving rise to feedback.
Figure 20.
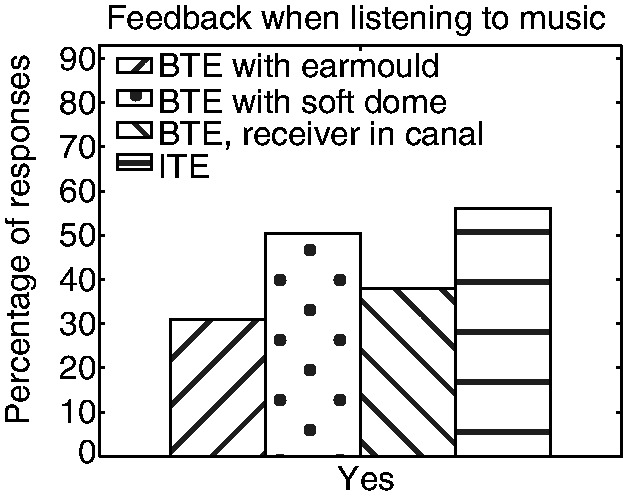
Percentage of responses for groups with different types of hearing aids for Question 17, regarding acoustic feedback. BTE = behind the ear; ITE = in the ear.
The responses for Questions 18 and 19, regarding how helpful hearing aids are for reproduced and live music, respectively, also varied across groups (Question 18: χ2 = 45.34, p < .001; Question 19: χ2 = 33.48, p = .0040), df = 15. Figure 21 shows that, for both questions, larger proportions of the groups with BTE with earmold responded “Yes—a lot,” “I can’t hear music via the TV or radio without my hearing aids,” or “I can’t hear live music without my hearing aids.” Also, for Question 18, a larger proportion of respondents using BTE with soft dome found that their hearing aids made reproduced music worse and, for Question 19, larger proportions of the groups with BTE with soft dome or BTE with receiver in the canal found that hearing aids made live music worse. This might be an indirect effect of the relationship between type of hearing aid and degree of hearing loss. The proportions of people with severe or profound hearing loss from the different groups were as follows: BTE with earmold, 76%; BTE with soft dome, 28%; BTE with receiver in the canal, 24%; and ITE, 60%. The larger proportions of people with severe or profound hearing loss from the group with BTE with earmold might explain why a larger proportion of this group needed their hearing aids or found them helpful for listening to music. Multiple comparison tests showed that for both Questions 18 and 19, the responses varied significantly (α = .0083) between the groups with BTE with earmold and BTE with soft dome (Question 18: χ2 = 31.84, p < .001; Question 19: χ2 = 18.01, p = .0029), df = 1.
Figure 21.
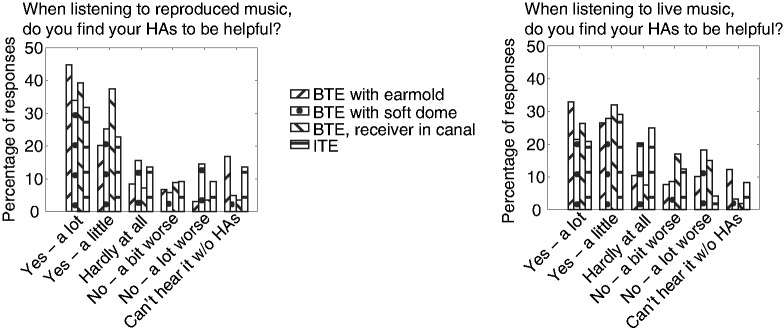
Percentage of responses for groups with different types of hearing aids for Question 18, regarding how helpful hearing aids are for reproduced music (left panel), and for Question 19, regarding how helpful hearing aids are for live music (right panel). BTE = behind the ear; ITE = in the ear.
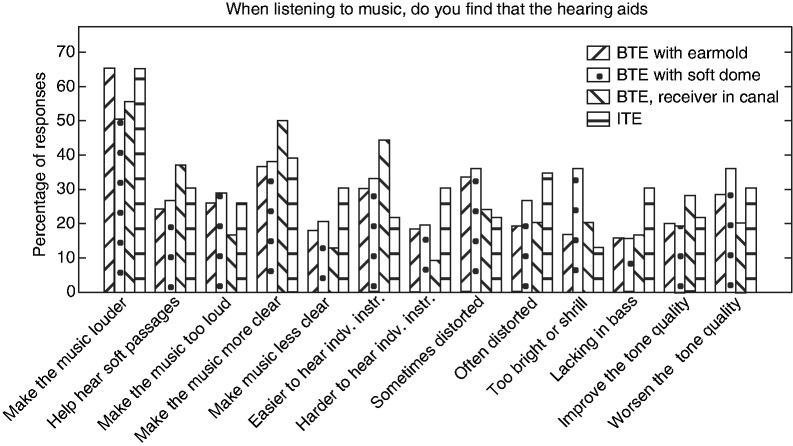
For Question 20, only the proportion of respondents who found that their hearing aids made the music seem too bright or shrill varied across groups (χ2 = 16.95, df = 1, p < .001). Figure 22 shows that a larger proportion of the group with BTE with soft dome than for the other groups agreed with this statement. Multiple comparisons showed that only the difference between the proportion of responses for the groups with BTE with earmold and BTE with soft dome was significant (χ2 = 14.51, df = 1, p < .001). The reason for this is probably that people with milder hearing loss are more likely to be dissatisfied with the sound of their hearing aids because they can cope without them.
Figure 22.
Percentage of responses for Question 20 for groups with different types of hearing aids. BTE = behind the ear; ITE = in the ear.
In summary, acoustic feedback was most common among respondents with ITE aids and BTE aids with soft dome. Responses to Question 18 and 19, regarding how helpful hearing aids are for reproduced and live music, respectively, showed higher proportions of “helpful” responses among respondents with BTE aids with earmold, probably because this group tended to have the most severe hearing loss. Problems with hearing aids making the music seem too bright or shrill were most prevalent among respondents with a BTE with soft dome.
Seal of ear canal (Question 13)
Responses were analyzed for five groups according to the degree to which the ear canal was sealed: Open (earmold with large vent, n = 53), Open (open soft dome, n = 107), Partly closed (earmold with small vent, n = 150), Closed (earmold with no vent, n = 140), Closed (sealed dome in ear canal, n = 51). Data for the 22 people responding “Other” (n = 22) were not included in the analysis, as they did not constitute a homogeneous group.
The responses for Question 17, regarding acoustic feedback, were independent of the degree of sealing. The responses for Questions 18 and 19 varied across groups (Question 18: χ2 = 49.56, p < .001; Question 19: χ2 = 34.71, p = .022), df = 20. For Question 18, multiple comparisons showed significant differences between the group with open soft dome and each of the other groups (Earmold with large vent: χ2 = 17.93, p = .0030; Earmold with small vent: χ2 = 22.06 p < .001; Earmold with no vent: χ2 = 28.50, p < .001; and Sealed dome: χ2 = 25.58, p < .001), df = 1 and α = .005. For Question 19, only the proportion of responses from the group with open soft dome and the group with earmold without a vent differed significantly (χ2 = 20.30, df = 1, p = .0011), α = .005.
Figure 23 shows that a smaller proportion of the group with open soft dome and a larger proportion of the groups with a closed fit (earmold with no vent or sealed dome) found that they “can’t hear music without hearing aids.” Also, a much smaller proportion of the former group than for the other groups responded “Yes—a lot.” This may partly reflect the fact that respondents with open soft domes tended to have less severe hearing loss than the other groups.
Figure 23.
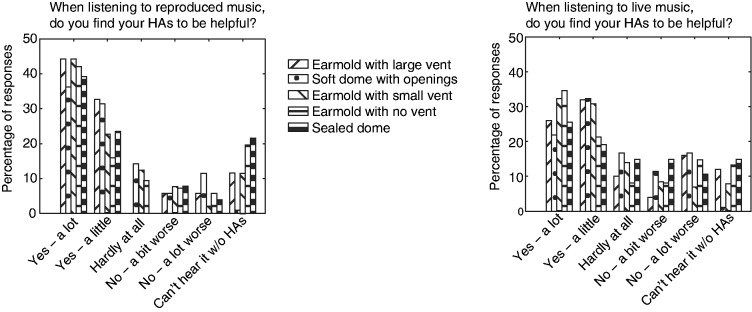
Percentage of responses of groups with different degrees of sealing of the ear canal for Questions 18 (left panel) and 19 (right panel), regarding how helpful hearing aids are for listening to reproduced and live music, respectively.
For Question 20, only the proportion of people finding that hearing aids make music louder and the proportion finding that hearing aids make music too bright or shrill varied across groups (make music louder: χ2 = 15.87, p = .0032; make music too bright or shrill: χ2 = 21.67, p < .001), df = 4. Figure 24 shows that a smaller proportion of people with open soft dome than for the other groups reported that their hearing aids made music louder. Multiple comparison tests showed that the difference was only significant between the groups with open soft dome and earmold with small vent (χ2 = 9.91, df = 1, p = .0016). The small proportion for respondents with open soft dome may reflect the small proportion of this group with severe or profound loss, or it may indicate that, for high input levels, the level of the sound leaking past the dome was comparable to or greater than the level of sound produced by the hearing aids. The proportion of people reporting that their hearing aids made music too bright and shrill differed significantly between groups with earmold with large vent and earmold with no vent (χ2 = 10.34, df = 1, p = .0013) and between groups with open soft dome and earmold with no vent (χ2 = 16.94, df = 1, p < .001), α = .005. Generally, the proportion responding that their hearing aids made the music sound too bright or shrill was largest for the groups with open fittings (earmold with large vent or open soft dome), smaller for the group with partially open fitting (earmold with small vent), and smallest for the groups with closed fitting (earmold with no vent or sealed dome). This might be related to the proportion of people with severe and profound hearing loss in each of the groups, as discussed earlier. However, it might also reflect the fact that it is difficult to achieve much gain at low frequencies using open-fitting hearing aids (Dillon, 2012).
Figure 24.
Percentage of responses of groups with different degrees of sealing of the ear canal for Question 20.
For Question 21, the responses were very similar across groups, although they did vary significantly across groups for full orchestra (K = 19.04, p < .001, df = 4), α = .0038. Rank-sum multiple comparison tests showed that there was only a significant difference between the groups with open soft dome and earmold without a vent (W = 3,783.5, p < .0001), α = .00019. Figure 25 shows that the group with earmold and no vent gave a somewhat smaller proportion of “Very easy” responses and larger proportion of “Very difficult” responses than the other groups, probably again reflecting the large proportion of people with severe or profound hearing loss in this group.
Figure 25.
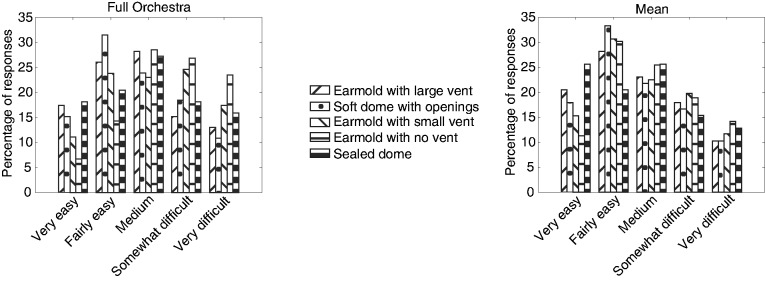
Percentage of responses for groups with hearing aids with different seals of the ear canal for Question 21, regarding the ease of hearing individual melodic lines.
In summary, a smaller proportion of the group with open soft dome than for the other groups responded that they needed their hearing aids for listening to music or that they found hearing aid very helpful for listening to music. Also a smaller proportion of this group found that their hearing aids made music louder. A larger proportion of the groups with open fitting and a smaller proportion of the groups with closed fitting found that their hearing aids made music sound bright or shrill. Responses for Question 21 regarding the ease of hearing individual tones and melodic lines were similar across groups, but the group with earmold with no vent found it somewhat more difficult than the other groups.
Frequency lowering (Question 15)
Because few people responded that their hearing aids used one of the named algorithms, the respondents were grouped according to whether or not their hearing aids incorporated some form of frequency lowering (without frequency lowering: n = 175; with frequency lowering: n = 133). Data from the group responding “Don’t know” were not included in the analysis.
For Question 17, the proportion of people reporting acoustic feedback was significantly lower for those with than without frequency lowering, as illustrated in Figure 26 (χ2 = 9.10, df = 1, p = .0026). This is in the expected direction, as lower gains are usually required when frequency lowering is implemented and frequency shifting itself reduces feedback (Freed & Soli, 2006; Kates, 2008).
Figure 26.
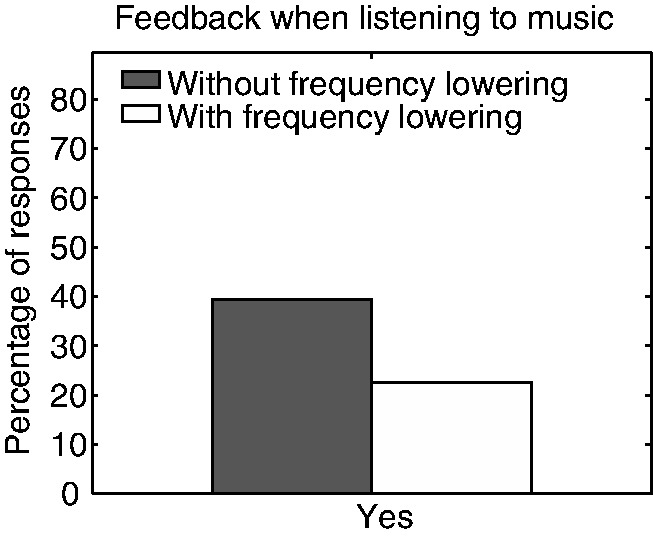
Responses for Question 17 regarding acoustic feedback for groups with and without frequency lowering in their hearing aids.
There were no significant differences between the responses for the groups with and without frequency lowering for Questions 18 and 19 regarding how helpful hearing aids are for reproduced and life music, and for Question 21 regarding the ease of hearing out individual tones and musical lines.
For Question 20, the proportion of responses that hearing aids “Make the louder parts too loud” was lower for the group with than without frequency lowering (χ2 = 4.95, df = 1, p = .018), as shown in Figure 27. This may happen because frequency lowering reduces the need for very high gains and output levels, reducing the likelihood of overamplification.
Figure 27.
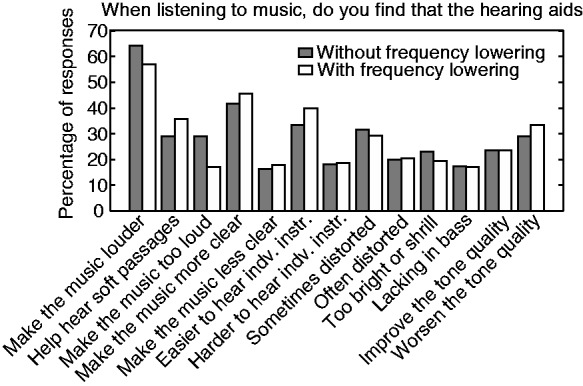
Percentage of responses to Question 20 for groups with hearing aids without or with frequency lowering.
It is interesting that frequency lowering was not associated with increased reports of distortion. This suggests that hearing-impaired people are insensitive to the inharmonicity that can be introduced by frequency lowering. This is consistent with the finding that people with hearing loss tend to be insensitive to a shift in frequency of all components in a harmonic tone, such that the tone becomes inharmonic (Hopkins & Moore, 2007).
The percentage of respondents using frequency lowering tended to increase with increasing severity of hearing loss. The percentages were 27%, 38%, 46%, and 52% for the groups with mild, moderate, severe, and profound loss. This suggests that frequency lowering is used more frequently for people with severe or profound hearing loss. However, a chi-square test showed that the proportion of respondents with frequency lowering did not vary significantly with degree of hearing loss. The percentage of respondents using frequency lowering varied somewhat with the pattern of hearing loss. The percentages were 48%, 35%, 36%, and 41% for the groups with high-frequency, low-frequency, medium-frequency, and flat hearing losses. A chi-square test showed that the proportion of respondents with frequency lowering was independent of the pattern of hearing loss. It is surprising that frequency lowering is apparently being used for some people with low-frequency or medium-frequency hearing loss, as one would expect that it would mainly be used for people with high-frequency hearing loss. It is possible that some respondents reported that they had a low- or medium-frequency loss when in fact they had a high-frequency loss.
In summary, frequency lowering was associated with reduced proportions of people experiencing feedback when listening to music and reporting that hearing aids made music too loud. The use of frequency lowering was not associated with increased reports of distortion. The use of frequency lowering did not vary significantly with the severity or pattern of hearing loss.
Music program (Question 16)
The respondents were grouped according to whether or not their hearing aids had a special program for listening to music (with music program: n = 198; without music program: n = 325). For Question 20, use of a music program was associated with a higher proportion of responses that hearing aids made it easier to hear the individual instruments (χ2 = 3.94, df = 1, p = .047; see Figure 28). Otherwise, the responses did not vary across groups. The relatively small differences across groups suggest that having a music program does not make a large difference and that there is much to be done to improve music programs.
Figure 28.
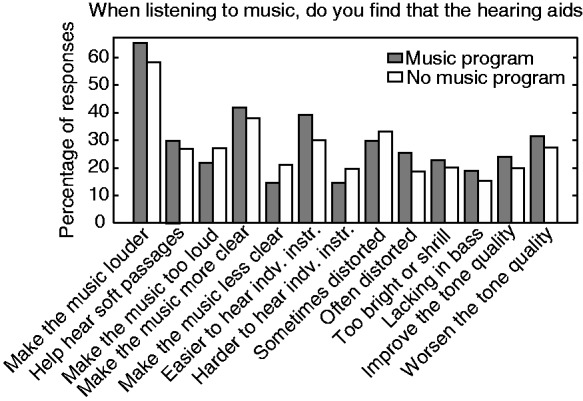
Percentage of responses to Question 20 for respondents grouped according to whether or not their hearing aids had a music program.
In summary, the availability of a music program resulted in a small reported improvement in the ability to hear individual instruments, but otherwise had little effect. This implies that there is room for improvement of hearing aid music programs.
Discussion
The responses from this survey showed that large proportions of hearing-aid users found their hearing aids to be helpful for listening to both reproduced and live music and that many people found that their hearing aids made music sound more clear and made it easier to hear individual instruments. However, this does not necessarily mean that people are completely satisfied with their hearing aids with regard to music. This survey identified several problems experienced by many people when using their hearing aids for listening to music.
More than a third of the respondents had experienced feedback when listening to music, indicating that current feedback cancellation systems need to be improved. However, it is not possible to give a precise estimate of the severity of this problem from the responses obtained in this survey, as the survey did not provide information about how often each respondent experienced feedback. The group reporting that they experienced feedback when listening to music was likely to range from people who only rarely experienced feedback to people who constantly had problems with feedback.
One of the most prevalent problems was distortion. More than half of the respondents reported that their hearing aids “sometimes” or “often” made the music sound distorted. Possible reasons for the distortion are changes in the temporal envelope of the signal caused by the use of fast-acting amplitude compression, output limiting, adaptive directionality, or the use of frequency lowering; artifacts caused by feedback-cancellation systems, which can include the introduction of spurious tones, “after tones” produced after a note ceases, and beats; and the introduction of harmonic or intermodulation distortion for high input sound levels because of input or output peak clipping or overload of input and output transducers. It is not possible to know exactly how much each of these factors is responsible for the distortion reported in the survey. However, the link between higher sound levels and distortion is supported by the fact that a greater proportion of respondents found their hearing aids to be helpful for reproduced than for live music, as high sound levels and large crest factor are more often typical of the latter (reproduced music is often subjected to amplitude compression). The problem of distortion at high sound levels for music signals with a large crest factor could be alleviated by increasing the dynamic range of the input of the hearing aid. This could be done by increasing the number of bits in the A/D converter, or by shifting the available input dynamic range upward, as is already done by some manufacturers (Hockley et al., 2012; Kuk, Chi-Chuen, Korhonen, & Crose, 2014). Problems with distortion were less prevalent among respondents with mild losses than among groups with moderate to profound loss. This suggest that at least some of the problems with distortion arise at the output stage of the hearing aids, as groups with more severe loss require higher output levels.
Another issue involves problems with the sound level provided by the hearing aids when listening to music. Twenty-five percent of respondents reported that their hearing aids made the louder parts of music too loud and only 28% reported that they could hear soft passages without the louder parts being too loud. These findings indicate that hearing-aid automatic-gain-control systems need to be improved and ideally optimized for listening to music in a special music program.
The comparison of responses for groups with different patterns of hearing loss indicated that a larger proportion of the groups with flat and low-frequency hearing loss than for the other groups did not receive sufficient gain from their hearing aids. This result suggests that insufficient gain is a bigger problem at low than at higher frequencies. This is supported by 21% of respondents reporting that their hearing aids make music seem too bright or shrill and 17% agreeing that their “hearing aids make the music seem lacking in bass.” Most hearing aids have a frequency response that rolls off below about 200 Hz. This is done mainly to prevent the masking of speech by low-frequency background sounds, such as car noise. An extended low-frequency response would probably improve tone quality (Moore & Tan, 2003) reducing the proportion of people (29% in the survey) responding that their hearing aids “worsened the tone quality of music.”
Only 40% of respondents reported having a music program in their hearing aids and there was little difference between the responses of the groups with and without a music program. However, some hearing aids change program automatically and a music program may be activated even if the person using it is not aware of it. Also, some people who reported having a music program may not have actually used it on a regular basis. Even so, the lack of an effect of having a music program suggests that current music programs do not markedly improve the experience of listening to music and that there is plenty of room for improvement.
This survey only contained a limited number of questions. More detailed information could have been obtained by having more questions. However, we decided to limit the number of questions in order to reduce the number of respondents giving up part way through the survey, as it was only possible to make use of responses from people who finished the survey. This turned out to be a valid concern, as 273 people started but did not finish the survey, even with this limited number of questions. Another limitation is that it is difficult to infer causality from survey data. The survey has revealed some interesting trends, but the reasons why those trends occur remains uncertain. However, we feel that the survey has been useful in revealing the extent and nature of the problems experienced by people when listening to music with hearing aids, and that the results should provide useful pointers for future, more controlled, studies.
Conclusions
A large proportion of respondents found their hearing aids to be helpful for listening to music. However, many people experienced problems with feedback, distortion, excessive loudness, inadequate audibility of soft sounds, reduced tone quality, and unbalanced frequency response. The results presented here suggest that the experience of listening to music with hearing aids could be improved by improving feedback cancellation and automatic gain control systems, increasing the input and output dynamic range to avoid distortion for high sound levels, and extending the frequency response at lower frequencies.
Acknowledgements
We thank Martin McKinny, Kelly Fitz, and Sridhar Kalluri for helpful discussions and Andrew Oxenham and two anonymous reviewers for helpful comments.
Declaration of conflict of interests
The PhD studentship of Sara M. K. Madsen was funded by Starkey.
Funding
The authors disclosed receipt of the following financial support for the research, authorship, and/or publication of this article: This work was funded by Starkey and the MRC (UK).
References
- Aazh H., Moore B. C. J., Prasher D. (2012) The accuracy of matching target insertion gains with open-fit hearing aids. American Journal of Audiology 21(2): 175–180. [DOI] [PubMed] [Google Scholar]
- Akeroyd M. A. (2008) Are individual differences in speech reception related to individual differences in cognitive ability? A survey of twenty experimental studies with normal and hearing-impaired adults. International Journal of Audiology 47(Suppl. 2): S53–S71. [DOI] [PubMed] [Google Scholar]
- Arehart K. H., Kates J. M., Anderson M. C. (2011) Effects of noise, nonlinear processing, and linear filtering on perceived music quality. International Journal of Audiology 50(3): 177–190. [DOI] [PubMed] [Google Scholar]
- Beauvois M. W., Meddis R. (1997) Time decay of auditory stream biasing. Perception and Psychophysics 59(1): 81–86. [DOI] [PubMed] [Google Scholar]
- Chasin M. (2012) Music and hearing aids – An introduction. Trends in Amplification 16(3): 136–139. [DOI] [PMC free article] [PubMed] [Google Scholar]
- Chasin, M., & Hockley, N. S. (Eds). (2012). Special issue on music and hearing loss: Preventative and rehabilitative options. Trends in Amplification, 16(3), 135–182.
- Chasin M., Hockley N. S. (2013) Some characteristics of amplified music through hearing aids. Hearing Research 308: 2–12. [DOI] [PubMed] [Google Scholar]
- Croghan N. B., Arehart K. H., Kates J. M. (2012) Quality and loudness judgments for music subjected to compression limiting. Journal of the Acoustical Society of America 132(2): 1177–1188 doi: 10.1121/1.4730881. [DOI] [PubMed] [Google Scholar]
- Croghan N. B., Arehart K. H., Kates J. M. (2014) Music preferences with hearing aids: Effects of signal properties, compression settings, and listener characteristics. Ear and Hearing 35(5): e170–e184. [DOI] [PubMed] [Google Scholar]
- Culling J. F., Darwin C. J. (1993) Perceptual separation of simultaneous vowels: Within and across-formant grouping by F0. Journal of the Acoustical Society of America 93: 3454–3467. [DOI] [PubMed] [Google Scholar]
- Dillon, H. (2012). Hearing aids (2nd ed.). Turramurra, NSW: Boomerang Press.
- Fine P. A., Moore B. C. J. (1993) Frequency analysis and musical ability. Music Perception 11: 39–53. [Google Scholar]
- Fowler E. P. (1936) A method for the early detection of otosclerosis. Archives of Otolaryngology 24: 731–741. [Google Scholar]
- Freed D. J., Soli S. D. (2006) An objective procedure for evaluation of adaptive antifeedback algorithms in hearing aids. Ear and Hearing 27: 382–398. [DOI] [PubMed] [Google Scholar]
- Hockley N. S., Bahlmann F., Fulton B. (2012) Analog-to-digital conversion to accommodate the dynamics of live music in hearing instruments. Trends in Amplification 16(3): 146–158. [DOI] [PMC free article] [PubMed] [Google Scholar]
- Hood J. D. (1972) Fundamentals of identification of sensorineural hearing loss. Sound 6: 21–26. [Google Scholar]
- Hopkins K., Moore B. C. J. (2007) Moderate cochlear hearing loss leads to a reduced ability to use temporal fine structure information. Journal of the Acoustical Society of America 122: 1055–1068. [DOI] [PubMed] [Google Scholar]
- Kates J. M. (2008) Digital hearing aids, San Diego, CA: Plural. [Google Scholar]
- Keidser G., Dillon H., Flax M., Ching S., Brewer S. (2011) The NAL-NL2 prescription procedure. Audiology Research 1(1): 88–90. [DOI] [PMC free article] [PubMed] [Google Scholar]
- Kuk F., Chi-Chuen L., Korhonen P., Crose B. (2014) Evaluating hearing aid processing at high and very high input levels. Hearing Review 21(3): 32–35. [Google Scholar]
- Leek M. R., Molis M. R., Kubli L. R., Tufts J. B. (2008) Enjoyment of music by elderly hearing-impaired listeners. Journal of the American Academy of Audiology 19: 519–526. [DOI] [PubMed] [Google Scholar]
- Levine D. M., Stephan D. F., Krehbiel T. C., Berenson M. L. (2008) Statistics for managers using microsoft excel, Upper Saddle River, NJ: Prentice Hall, pp. 462–496. [Google Scholar]
- Madsen S. M. K., Moore B. C. J. (2014) Effects of compression and onset/offset asynchronies on the detection of one tone in the presence of another. Journal of the Acoustical Society of America 135(5): 2902–2912. [DOI] [PubMed] [Google Scholar]
- Marozeau J. (2013) The effect of timbre and loudness on melody segregation. Music Perception 30(3): 259–274. [Google Scholar]
- McGuinness D. (1972) Hearing: Individual differences in perceiving. Perception 1(4): 465–473. [DOI] [PubMed] [Google Scholar]
- Merks I., Banerjee S., Trine T. (2006) Assesing the effectiveness of feedback cancellers in hearing aids. Hearing Review 13: 53–57. [Google Scholar]
- Moore B. C. J. (2007) Cochlear hearing loss: Physiological, psychological and technical issues, 2nd ed Chichester, England: Wiley. [Google Scholar]
- Moore B. C. J. (2012) Effects of bandwidth, compression speed, and gain at high frequencies on preferences for amplified music. Trends in Amplification 16(3): 159–172 doi: 10.1177/1084713812465494. [DOI] [PMC free article] [PubMed] [Google Scholar]
- Moore B. C. J., Füllgrabe C., Stone M. A. (2011) Determination of preferred parameters for multi-channel compression using individually fitted simulated hearing aids and paired comparisons. Ear and Hearing 32: 556–568. [DOI] [PubMed] [Google Scholar]
- Moore B. C. J., Glasberg B. R., Stone M. A. (2010) Development of a new method for deriving initial fittings for hearing aids with multi-channel compression: CAMEQ2-HF. International Journal of Audiology 49: 216–227. [DOI] [PubMed] [Google Scholar]
- Moore B. C. J., Sek A. (2013) Comparison of the CAM2 and NAL-NL2 hearing aid fitting methods. Ear and Hearing 34(1): 83–95. [DOI] [PubMed] [Google Scholar]
- Moore B. C. J., Tan C. T. (2003) Perceived naturalness of spectrally distorted speech and music. Journal of the Acoustical Society of America 114: 408–419. [DOI] [PubMed] [Google Scholar]
- Ricketts T. A., Dittberner A. B., Johnson E. E. (2008) High frequency amplification and sound quality in listeners with normal through moderate hearing loss. Journal of Speech, Language, and Hearing Research 51: 160–172. [DOI] [PubMed] [Google Scholar]
- Robinson J., Baer T., Moore B. C. J. (2007) Using transposition to improve consonant discrimination and detection for listeners with severe high-frequency hearing loss. International Journal of Audiology 46: 293–308. [DOI] [PubMed] [Google Scholar]
- Schmidt M. (2012) Musicians and hearing aid design-is your hearing instrument being overworked? Trends in Amplification 16(3): 140–145. [DOI] [PMC free article] [PubMed] [Google Scholar]
- Stone M. A., Moore B. C. J. (2004) Side effects of fast-acting dynamic range compression that affect intelligibility in a competing speech task. Journal of the Acoustical Society of America 116: 2311–2323. [DOI] [PubMed] [Google Scholar]
- Stone M. A., Moore B. C. J. (2008) Effects of spectro-temporal modulation changes produced by multi-channel compression on intelligibility in a competing-speech task. Journal of the Acoustical Society of America 123: 1063–1076. [DOI] [PubMed] [Google Scholar]
- Stone M. A., Moore B. C. J., Füllgrabe C., Hinton A. C. (2009) Multi-channel fast-acting dynamic-range compression hinders performance by young, normal-hearing listeners in a two-talker separation task. Journal of the Audio Engineering Society 57: 532–546. [Google Scholar]
- Uys M., Pottas L., Vinck B., van Dijk C. (2012) The influence of non-linear frequency compression on the perception of music by adults with a moderate to severe hearing loss: Subjective impressions. The South African Journal of Communication Disorders. Die Suid-Afrikaanse tydskrif vir Kommunikasieafwykings 59: 53–67. [PubMed] [Google Scholar]
- Vliegen J., Oxenham A. J. (1999) Sequential stream segregation in the absence of spectral cues. Journal of the Acoustical Society of America 105: 339–346. [DOI] [PubMed] [Google Scholar]


