Abstract
Murine models are used extensively in biological and translational research. For many of these studies it is necessary to access the vasculature for the injection of biologically active agents. Among the possible methods for accessing the mouse vasculature, tail vein injections are a routine but critical step for many experimental protocols. To perform successful tail vein injections, a high skill set and experience is required, leaving most scientists ill-suited to perform this task. This can lead to a high variability between injections, which can impact experimental results. To allow more scientists to perform their own tail vein injections and to decrease the variability between injections a vascular access system (VAS) that semi-automatically inserts a needle into the tail vein of a mouse was developed. The VAS uses near infrared (NIR) light, image processing techniques, computer controlled motors, and a pressure feedback system to insert the needle and to validate its proper placement within the vein. The VAS was tested by injecting a commonly used radiolabeled probe (FDG) into the tail veins of five mice. These mice were then imaged using micro-positron emission tomography (PET) to measure the percentage of the injected probe remaining in the tail. These studies showed that, on average, the VAS leaves 3.4% of the injected probe in the tail. With these preliminary results, the VAS system demonstrates the potential for improving the accuracy of tail vein injections in mice.
1. Introduction
The National Institute of Health (NIH) has identified translational research as a top priority, meaning there will be a larger emphasis on taking research from the laboratory bench to the clinical bedside (Collins 2010). To achieve this, in-vivo experiments with animal models are often used due to the similarities of their biochemical interactions and pathways to those of humans. Mice are the most commonly used in-vivo model and account for approximately 90% of all mammalian disease studies (Malako 2000). Depending on the in-vivo experiment performed, access to the vascular system of the murine model may be required to inject drugs, cells, proteins, nanoparticles, or imaging agents.
One of the most readily accessible veins in a mouse is the lateral tail vein. Injecting into the tail vein can be a di cult task (Groman & Reinhardt 2004), (Vines et al. 2011). In a study performed by Groman et al., three di erent trained injectors each injected ten di erent mice with colloidal gold in the tail vein. Out of the thirty injections, twelve were misadministered by leaving more than 10% of the injected dose in the tail. On average, the injectors left 25.8 +/−37.4 % of the injected particle in the tail. Even more telling with this study is that only one of thirty injections was qualitatively thought to be a poor injection before the injections were quantified, indicating that scientists are often not aware when they perform a poor tail vein injection (Groman & Reinhardt 2004). Accurate and consistent tail vein injections are important because depending on the experimental design, a poor tail vein injection can a ect experimental results, change biodistribution, and increase study variability.
The key reason why performing a tail vein injection in a mouse is di cult is because of the tail vein size. There are four main vessels in the mouse tail: a dorsal vein, two lateral veins, and a ventral artery (Hedrich 2004). The lateral veins are used for tail vein injections. Based on histological slices performed on a tail and casting of the tail vasculature (Callewaert et al. 2008), it is estimated that the lateral tail veins in a mouse have a nominal diameter of approximately 300 μm, which is six times smaller than the diameter of the human median cubital vein that is commonly used for vascular access (Shima et al. 1996). The di erence in size between a mouse vein and a human vein highlights why performing a tail vein injection can be problematic, the tail vein is relatively small. To decrease the skill set required to perform tail vein injections and to increase the accuracy and reproducibility of tail vein injections, a semi-automated vascular access system (VAS) for murine models was designed, constructed, and tested. Furthermore, the use of an automated system for handling and inserting the needle in the mouse, should increase the safety of this procedure for the operator, something important when pathogens and other potentially hazardous agents are used.
2. Methods
2.1. The VAS
The VAS functionality is based on five concepts:
Immobilize and warm the tail of an anaesthetized mouse
Image the tail and identify the lateral tail vein
Align a needle to the tail vein via computer controlled motion
Insert the needle into the tail vein via computer controlled motion and monitor this process with a pressure feedback system
Inject the desired compound into the tail vein
2.1.1. Securing and warming the tail
Mice regulate their body temperature in large part through their tail. If the core body temperature of a mouse drops, heat will be conserved by reducing blood circulation to the extremities, mainly the tail. This causes the tail veins to shrink or collapse, rendering a tail vein injection nearly impossible. Vascular dilation in the tail can be encouraged by adding additional heat to the tail (Gordon 2012). It is critical to heat the mouse body and tail before and during a tail vein injection.
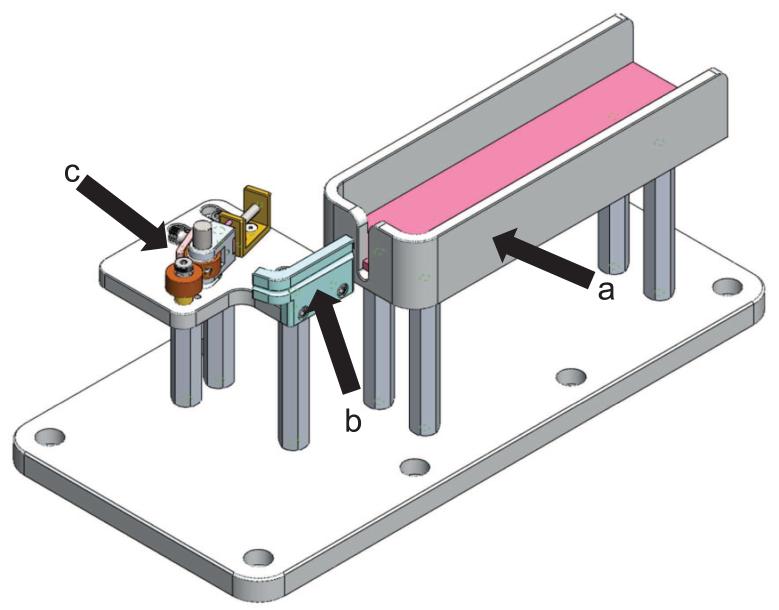
It is also important to secure the tail to reduce tail movement during the tail imaging and needle insertion process. While securing the tail, the vein must remain visible and damage to the tail should be minimized. As seen in Figure 1, the VAS incorporates a warming bed, heated tail support, and a tail clamp to warm the subject and prevent the tail from moving. The heated tail support also bends the tail. The bend in the tail is the target for the insertion of the needle. The clamp consists of two wheels, with one being spring loaded to adjust to di erent size tails. The tail is placed between the wheels and the wheels are manually rotated to pull the tail taught. When the desiredtension in the tail that minimizes tail movement is achieved, a brake is applied to the wheel to prevent the tail from further movement.
Figure 1.
The VAS setup to secure the tail. a. Heated mouse bed, b. Heated tail support, c. Tail clamp
2.1.2. Imaging the tail
To image the tail, a common monochrome charged-coupled device (CCD) camera is used (DMK 31BU03, Imaging Source, Charlotte, NC) with a variable focus lens (H3Z1014CS, Computar, Commack, NY). A NIR bandpass filter was added to the camera. The bandpass filter is centered at 850 nm and has a full width half maximum of 100 nm (NIR Bandpass filter, Ocean Thin Films, Golden, CO). This filter was chosen to match the emission spectrum of the light-emitting diode (LED) ring used to illuminate the tail and allows the VAS setup to be used in an open environment without the need for a lightproof box. The surface of a mouse tail has scales, hair, and skin pigmentation in the visible wavelength, which can vary from mouse to mouse and between breeds. NIR light is less sensitive than visible light to skin pigmentation and penetrates deeper into the skin because of the decrease in tissue absorption, allowing for deeper blood vessels to be imaged (Paquit et al. 2006). The VAS uses a LED light ring consisting of 13 LEDs having a peak emission at 880nm (QEC122, Fairchild, San Jose, CA).
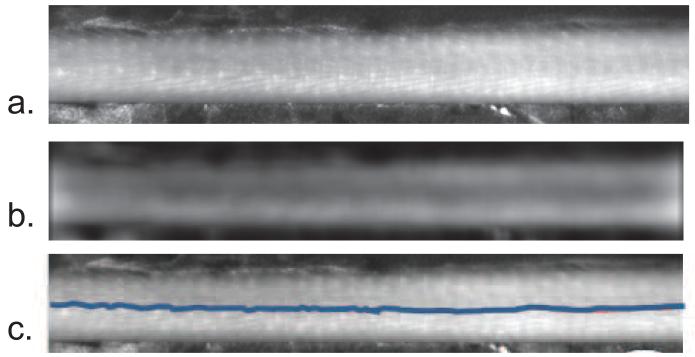
The VAS also uses NIR linear cross-polarizers. Cross-polarizers are employed to separate the reflectance of the surface from the light that is backscattered in tissue (Anderson 1991), (Demos & Alfano 1997), (Jacques et al. 2002). At the air-tissue interface, a percentage of the incident light is reflected causing glare at the surface while the remaining portion of the incident light enters the tissue and is scattered and/or absorbed. Scattering of the light causes depolarization, yet regular surface reflectance preserves the plane of polarization (Anderson 1991). The incident light can be linearly polarized and an analyzing polarizer is used at the CCD. The analyzing polarizer, which is set orthogonal to the polarization of the incident light, rejects the surface reflected light yet allows some of the scattered light from the tissue, which now has random polarization, to pass to the CCD. This method of using cross-polarizers enhances the view of the vasculature of the tail. The VAS uses NIR linear polarizing film (NT54-112, Edmund Optics, Barrington, NJ) to polarize the LED light and to analyze the light coming into the CCD camera. The NIR tail images are then processed to extract the vein location in real-time, as seen in Figure 2. To extract the vein location, a blurred image is first created by convolving a heavily smoothed 2D Gaussian filter with a sigma of 25 pixels (1 pixel=23.2 μm in image space) with the tail image (Nixon & Aguado 2008). This blurred image is then subtracted from the original tail image resulting in a high pass filtered image. To reduce the noise in the high pass filtered image, a second Gaussian filter, with a sigma of 7.7 pixels, is convolved with the high pass filtered image. By applying these two Gaussian filters, we are left with a bandpass filtered image, as seen in Figure 2b. These mathematical operations can be performed in real time with a standard laptop computer. To locate the vein in the processed image, we use the zero-crossing edge detection method to identify the tail edges along with the vein edges. The zero-crossing edge detection method is a second order derivative, where each zero crossing is defined as an edge (Nixon & Aguado 2008). With the vein edges identified, the center point between the two vein edges is overlaid onto the live tail images, as seen in Figure 2c, and becomes the location for alignment of the needle before insertion. The average vessel size in these processed images is 600 μm, which is larger than the estimated physical vessel diameter. This increase in apparent vessel size is from the di usion of light, which is assumed to be isotropic. Because the needle is aligned to the center location of the vessel, the di usion should not have an impact on guiding the alignment of the needle.
Figure 2.
Processed tail images with the vein location identified. a. is the NIR image of the tail, b. is the bandpass filtered image, and c. is the overlay of the vein location onto the NIR image
2.1.3. Moving the needle with computer controlled motors
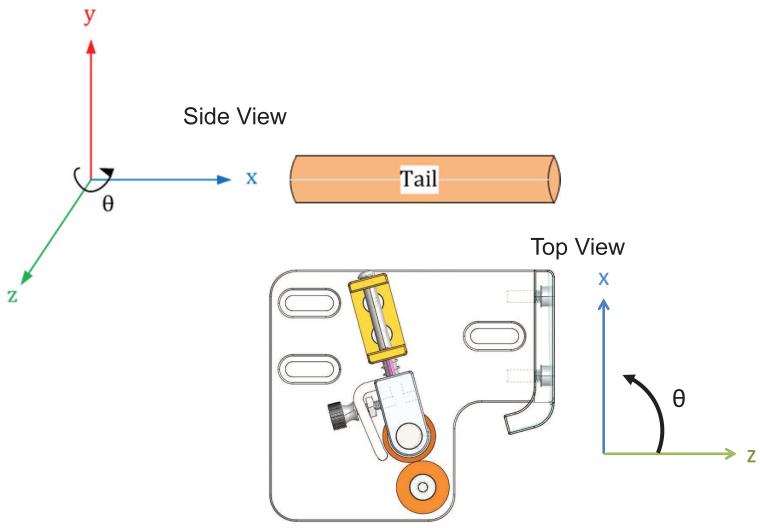
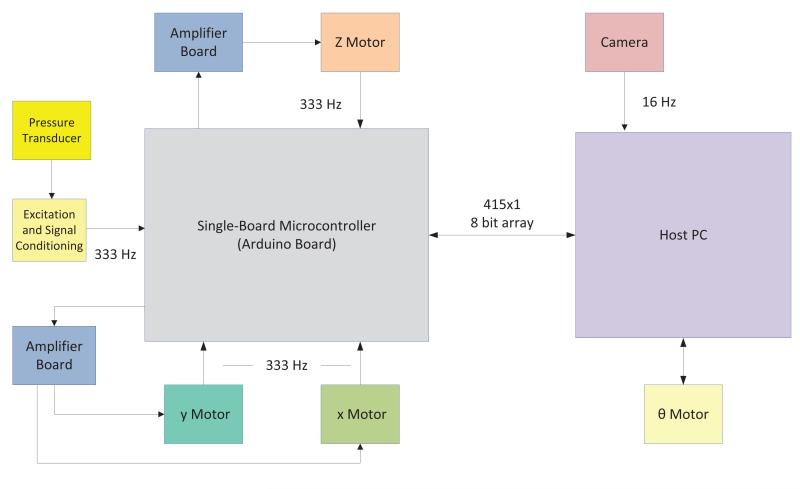
The VAS inserts a 30 G needle into the tail vein by moving the needle with a four-degrees-of-freedom motorized stage, as seen in Figure 3. Translation of the needle in the y and z direction properly aligns the needle to the vein and prepares it for entry. Rotation of the needle in the θ direction changes the angle of insertion of the needle and finally translation of the needle in the x direction inserts the needle into the vein. Each degree of freedom is controlled by a di erent motor axis. Siskiyou DC brush servo encoded motors (Grants Pass, OR) move the needle in the y and z direction, while a Drive-Master CTC-165-1 motor (US EuroTek, Inc., Lake Forest, CA) moves the needle in the x direction and a Newport CONEX-AG-PR100P rotational table (Irvine, CA) moves the needle in the θ direction. The x, y and z motors have custom built controllers that use an Arduino Mega 2560 board (Arduino, Torino, Italy) to send pulse width modulated signals that are amplified (Sabertooth dual 12 A motor drivers, Dimension Engineering, Akron, OH) to the motors. The Arduino board is interfaced with a custom labview program that allows the user to input commands to move the motors. A schematic of the VAS electronics is seen in Figure 4.
Figure 3.
The VAS needle can be positioned in the xyz and oriented in theta. The x direction is relative to θ, but y and z are independent of θ. Two different views, relative to the tail are displayed.
Figure 4.
A schematic of the VAS electronics
2.1.4. Pressure feedback system
Because the acquired single view surface images of the tail have no depth information about the vein along the z axis, it is unknown how far the needle needs to penetrate the tail in the x direction to reach the vein. To overcome this hurdle, a pressure transducer (Deseret Medical Inc., Sandy, UT) is attached to the needle. The pressure transducer, the needle, and connections are preloaded with saline. The pressure transducer monitors the pressure inside the lumen of the needle. When the needle enters the vein, a change in pressure is detected, indicating that the needle is inside the vein. This pressure can also be monitored to verify that the needle remains in the vein. The pressure is monitored by the Arduino Mega 2560 board, where the analog pressure transducer signal is digitized. A signal is sent to the x motor to stop moving when the pressure rapidly rises. This trigger is sent based on monitoring the di erence of two running averages of the pressure signal. The Arduino receives a new data point from the pressure transducer at a rate of 333 Hz and stores the most recent 512 data points in memory. With each new data point, the di erence of the average of the 16 oldest data points from the average of the 16 newest data points is calculated. If this di erence is greater than a preselected value, a trigger event occurs which stops the forward progression of the x motor and backs the needle up to the location where it was when the trigger first occurred. The pressure feedback system uses the di erence of two running averages to avoid stopping the motor based on a random change of pressure and also to guarantee that the motor stops due to a sudden and consistent change in pressure, which is what is expected when the needle enters the vein lumen.
2.1.5. Injecting the desired probe
Once the needle is properly inserted into the tail vein, the desired compound can be injected. To reduce the likelihood of damaging the vessel during the injection, it is advantageous to inject a small volume slowly. Using the VAS, the probe can be injected manually or by using a connected syringe pump (NE-1000, New Era Pump Systems, Inc., Farmingdale, NY). By using the syringe pump, di erent volumes can be injected at controlled speeds programmed by the user.
2.2. Manual Tail Vein Injections
To compare the VAS injections in mice to the current standard method of manual tail vein injections, three di erent trained injectors and two di erent expert injectors injected FDG into the tail veins of a total of 14 anaesthetized mice (seven mice were injected by trained injectors and seven mice were injected by expert injectors). A graduate student or postdoc who has been trained to perform tail vein injections and performs injections for their own studies, but not on a daily basis, is classified as a trained injector. An expert injector is a highly trained person with extensive animal handling experience who performs tail vein injections on an almost daily basis. Each injector used the manual tail vein injection technique of their choice. Typically, a manual tail vein injection consists of warming the mouse tail followed by securing the tail in the injector’s hand and locating the tail vein by eye. The injector then uses their other hand to advance a 28 G or 30 G needle into the mouse tail vein until a flashback of blood is observed. 3.7 MBq of FDG in 50-100 μL of saline is then injected into the tail vein.
3. Results and Discussion
3.1. Manual tail vein injection results
After about one hour of unconscious uptake following the manual injection of FDG, the entire mouse was imaged for 10 minutes in a Siemens Inveon microPET scanner followed by a CT scan. The images for each mouse with a manual tail vein injection were then processed and analyzed as described in Section 3.2.2. For the injections performed by trained injectors, the average percentage of radioactivity remaining in the tail was 13.9% with a standard deviation between injectors of 12.3 %. The expert injectors left on average 1.8 +/−1.0 % of the radioactivity in the tail. This study hilights the high skill set required to perform reliable tail vein injections.
3.2. VAS results
3.2.1. Pressure transducer results using an artificial pressurized vessel
To test the pressure transducer, artificial vessels that can be pressurized, as depicted in Figure 5, were created. These artificial vessels consisted of either a Polydimethylsiloxane (PDMS) microfluidic chip (Liu et al. 2010) with approximately 300 μm diameter channels or rubber tubing with an inner diameter (ID) of 1.59 mm and an outer diameter (OD) of 3.18 mm. The pressure inside the PDMS channels or the rubber tubing was controlled with an electronic pressure regulator (LFR-05TK-0005-R4, Kelly Pneumatics Inc., Costa Mesa, CA) that controlled the pressure of compressed nitrogen gas that flowed into the inlet of a water reservoir. Pressurized water would then flow out of the reservoir outlet and into the artificial vessel. The pressure inside the vessel was verified with a digital pressure gauge (DPGW-04, Dwyer, Michigan City, IN) located at the outlet of the artificial vessel.
Figure 5.
Setup to pressurize artificial vessels
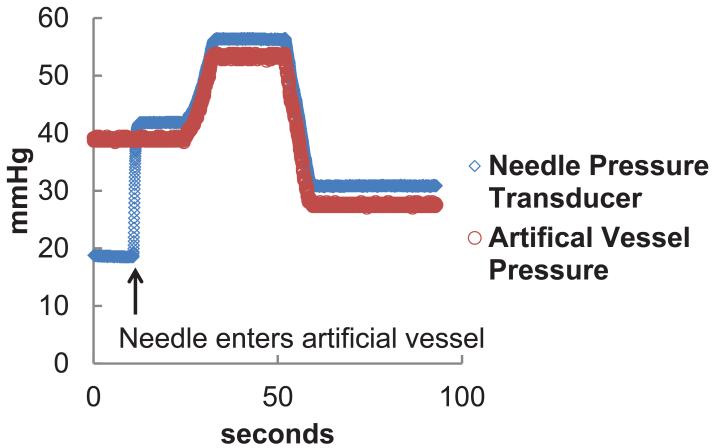
Verification that the pressure transducer attached to the needle measures the pressure of the vessel that the needle is inserted into was performed by inserting a needle into an artificial vessel. While the needle was in the vessel, the pressure inside the vessel was altered. As seen in Figure 6, the change in the pressure reading from the needle pressure transducer followed the same pattern as the change in pressure inside of the artificial vessel.
Figure 6.
Pressure reading inside the artificial vessel and needle lumen during one experiment. When the needle enters the vessel, a rapid change in pressure is detected. The pressure inside the vessel is altered and similar changes in pressure are monitored with the needle pressure transducer.
A trigger signal to stop the x motor is generated from the pressure signal. This was tested on an artificial vessel as seen in Figure 7. For this experiment, a needle was inserted into the artificial vessel at a velocity of 800 μm/sec. When the needle entered the vessel, a change in pressure was detected, triggering the motor to stop moving. To reduce inertial backlash, the motor did not stop instantaneously. The motor traveled an additional 139 μm before backing up to the location where the pressure trigger occurred. After the trigger, it took the needle 1.07 seconds to reach its resting position. The time and amount of additional travel the motor moves after the trigger is dependent on the motor velocity. After the needle was at rest, the needle was removed from the pressurized vessel and the needle pressure reading decreased. Similar pressure readings are observed when the needle is inserted into the mouse tail vein and then removed, as seen in Figure 7
Figure 7.
A plot of the needle movement and pressure output during an experiment with a. an artificial vessel and b. a mouse. The trigger point that signals to the motor to stop moving is indicated. After the trigger, the motor slows down and backs up to the location the motor was at when it was triggered. When the needle is removed from the vein, the pressure decreases.
These experiments confirm that a pressure transducer attached to a needle can detect a change in pressure that is expected when a needle enters a blood vessel. This information can be used to control the movement of the needle and can verify when the needle is in the lumen of a vessel.
3.2.2. Utilizing the VAS with murine models
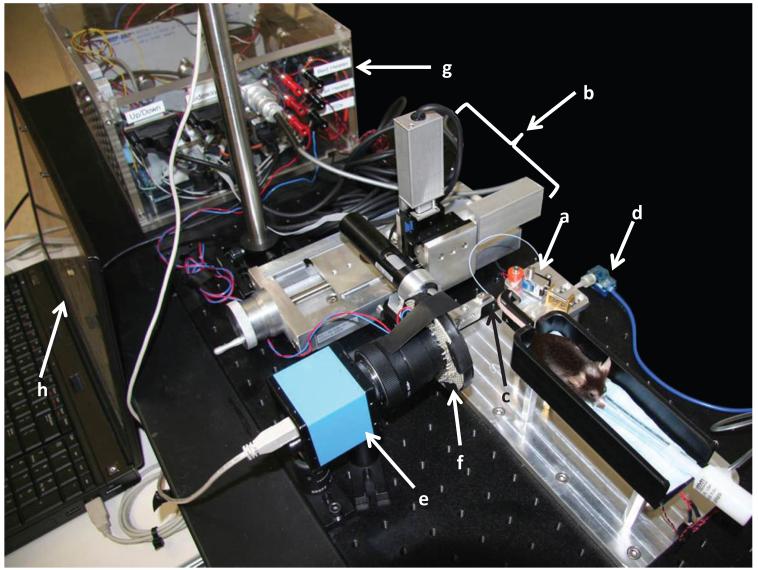
The VAS, depicted in Figure 8, was used to inject the radioactive positron emission tomography (PET) imaging probe FDG into five mice. PET imaging was used to quantify the amount of the injected probe left in the tail by comparing the PET signal from the tail versus the signal from theentire mouse body. Thirty minutes before the tail vein injection, the mice were each given a 200 μL subcutaneous saline injection to prevent them from being dehydrated and to increase blood pressure at the time of injection. Five to ten minutes before the tail injection, the mice were anaesthetized using a mixture of vaporized isoflurane-oxygen. The anaesthetized subjects were placed on the heated mouse bed and the tails were secured on the heated tail support using the tail clamp. Additional heat was applied to the tail with warm gauze. Live images were processed in real time and the vein location was overlaid onto the live images. A 30 G beveled stainless steel needlewas aligned to the tail vein using the computer controlled motors. The needle was inserted into the vein at a speed of 200 μm/sec. The needle automatically stopped its forward progression into the vein when a change in pressure was detected as part of the pressure feedback system. The readings from the needle pressure transducer after the needle entered the vein ranged from 12 mmHg to 58 mmHg. Based on the pressure reading, after it was verified that the needle remained in the vein after it came to a stop, the pressure transducer was disconnected from the needle and 3.7 MBq of FDG in 50 μL of saline were manually injected at an estimated rate of 50 μL/sec into the mouse tail via the needle placed by the VAS. Disconnecting the pressure transducer and injecting FDG takes approximately 5 seconds. The line was then manually flushed with 20 μL of saline and the needle was removed from the subject. One hour of unconscious uptake occurred before the entire subject was imaged for ten minutes using a PET scanner (Inveon, Siemens Preclinical Solutions, Knoxville, TN) followed by a CT scan (MicroCAT II, Siemens Preclinical Solutions, Knoxville, TN). CT data was reconstructed using a modified Feldkamp algorithm to 200 μm voxel size and calibrated using air and water to Hounsfield units. Based on the CT scan, the PET data were corrected for scatter and attenuation and reconstructed using filtered back projection (Budinger 1974) to a resolution of 1.5 mm. The PET images were then imported into the software program AMIDE (Loening & Gambhir 2003). Using the CT scan, 3D isocontour volumes of interest (VOIs) were drawn by setting the minimum CT value to −450 Hounsfield units. These VOIs were then overlaid on the PET images. Depending on the injection, the VOI might need to be manually enlarged around the injection site to include activity outside the region of interest due to spillover resulting from the limited PET resolution. This was done by using the VOI draw tool in AMIDE. The statistics of the whole body VOI were then analyzed. For the tail data, the tail of the mouse was erased in the CT and PET image. Another 3D isocontour was drawn on the data missing the tail using the same thresholds as were applied for the whole body VOI. The percentage of radioactivity in the tail compared to the entire body was calculated by the following equation:
| (1) |
where μNT is the mean value in the no tail VOI and VNT is the size (volume) of the no tail VOI. μW is the mean value of the whole body VOI and VW is the size of the whole body VOI.
Figure 8.
The VAS, including a. Tail holder, b. Motors, c. Needle, d. Pressure transducer, e. Camera, f. LEDS, g. Electronics, and h. Laptop
The percentage of radioactivity left in the tail after an injection for each study is shown in Table 1. Of the 5 mice that were injected, the average amount of radioactivity left in the tail was 3.4% with a standard deviation of 4.5. This data validates our proof-of-concept idea that a device can be built to perform tail vein injections and that it can compete with the traditional method of manual tail vein injections. Study 4 shows a higher than expected amount of radioactivity left in the tail. Reviewing the pressure data for this experiment, upon insertion of the needle into the vein, the pressure increased as expected and triggered the motor to stop. However, after the needle was disconnected from the pressure transducer a rapid decrease in pressure was not observed as expected. It is unclear why this happened or if it is indicative of a poor tail vein injection by the VAS and will need to be further investigated. With our proof-of-concept validated, we can continue to improve and test the VAS.
Table 1.
Mouse studies performed by the VAS
| Study # | Mouse Strain | Mouse Age (wks) |
Total Injected Volume (μL) |
Uptake Time Before Scan (min) |
% of Radioactivity in the Tail |
|---|---|---|---|---|---|
| 1 | C57BL/6 | 71 | 70 | 72 | 2.1 |
| 2 | C57BL/6 | 115 | 70 | 61 | 1.9 |
| 3 | C57BL/6 | 15 | 70 | 60 | 1.1 |
| 4 | C57BL/6 | 15 | 70 | 61 | 11.4 |
| 5 | C57BL/6 | 16 | 70 | 157 | 0.7 |
4. Conclusion and future work
We continue to increase the reliability and user-friendliness of VAS by working towards a fully-automated system where the needle movement is calibrated and fully controlled by algorithms. These algorithms will be solely based on the tail images and pressure transducer data, reducing the required user-inputs. We also aim to automate the infusion of the probe by adding electronic switches to the needle/pressure transducer/syringe connections and control the plunging of the syringe with a computer controlled syringe pump. These additions will move the current semi-automated VAS to a more fully-automated system. It is also conceivable to adapt the current VAS to accommodate other animal models, such as rats. This would require exploring the proper wavelengths needed to visualize the rat tail vein and optimizing the image processing parameters accordingly. The animal handling components of the VAS, including the tail holder and bed would need to be resized for the rat.
We have constructed and tested a VAS to semi-automatically insert a needle into the mouse tail vein for injections. The VAS uses a custom heated bed and tail support to secure the tail of an anaesthetized mouse. NIR light is used in conjunction with a standard CCD camera to image the tail and locate the tail vein. A needle is inserted into the vein using computer controlled motion. This process is monitored and verified via a pressure feedback system. The VAS leaves less probe in the tail than manual injections reported in the literature (Groman & Reinhardt 2004) and manual FDG injections we analyzed by trained injectors. By using a consistent and reliable device, such as the VAS, to perform tail vein injections, users can decrease the variation within their experimental design and the skill set required to perform tail vein injections with minimal training. Also, the experiments can become safer both for the animal and for the user.
Acknowledgments
The authors would like to acknowledge the histology and casting of mice tails by Dr. Steven Staelen’s group at Ghent University in Belgium. This work was supported by the National Institutes of Health under grant no. R24 CA92865, the Department of Energy under contract no. DE-FC03-02ER63420, by a donation from the Crump Family Foundation, NIH/NCRR/NCATS UCLA CTSI grant no UL1TR000124, and a Perkins Coie Innovative Minds award.
References
- Anderson RR. Arch Dermatol. 1991 Jul;127:1000–1005. [PubMed] [Google Scholar]
- Budinger T. IEEE Trans. Nucl. Sci. 1974;NS-21(3):2–20. [Google Scholar]
- Callewaert BL, Loeys BL, Casteleyn C, Willaert A, Dewint P, De Backer J, Sedlmeier R, Simoens P, De Paepe AM, Coucke PJ. genesis. 2008;46(8):385–389. doi: 10.1002/dvg.20409. [DOI] [PubMed] [Google Scholar]
- Collins FS. Science. 2010;327(5961):36–37. doi: 10.1126/science.1185055. [DOI] [PubMed] [Google Scholar]
- Demos SG, Alfano RR. Appl. Opt. 1997;36(1):150–155. doi: 10.1364/ao.36.000150. [DOI] [PubMed] [Google Scholar]
- Gordon CJ. Journal of Thermal Biology. 2012;37(8):654–685. [Google Scholar]
- Groman EV, Reinhardt CP. Journal of the American Association for Laboratory Animal Science. 2004;43(1):35–38. [PubMed] [Google Scholar]
- Hedrich H 2004 The Laboratory Mouse Elsevier Limited Amsterdam.
- Jacques SL, Ramella-Roman JC, Lee K. Journal of Biomedical Optics. 2002;7(3):329–340. doi: 10.1117/1.1484498. [DOI] [PubMed] [Google Scholar]
- Liu K, Chen YC, Tseng HR, Shen C, van Dam R. Microfluidics and Nanofluidics. 2010;9(4):933–943. doi: 10.1007/s10404-010-0617-0. [DOI] [PMC free article] [PubMed] [Google Scholar]
- Loening AM, Gambhir SS. Molecular Imaging. 2003;2(3):131–137. doi: 10.1162/15353500200303133. [DOI] [PubMed] [Google Scholar]
- Malako D. Science. 2000;288(5464):248–253. doi: 10.1126/science.288.5464.248. [DOI] [PubMed] [Google Scholar]
- Nixon M, Aguado A. Feature extraction and image processing. 2nd edn Elsevier; Oxford: 2008. [Google Scholar]
- Paquit VC, Ferrell TL, Meriaudeau F, Price JR, Seulin R, Tobin KW, Jr, Farahi RH. In: Medical Imaging 2006: Visualization, Image-Guided Procedures, and Display. Cleary KR, Robert J, Galloway L, editors. Vol. 6141. SPIE; San Diego, Ca: 2006. [ORNL] [Le2i, University of Burgundy] [Google Scholar]
- Shima H, Ohno K, Michi K i, Egawa K, Takiguchi R. Journal of Cranio-Maxillofacial Surgery. 1996;24(5):293–299. doi: 10.1016/s1010-5182(96)80062-x. doi: 10.1016/S1010-5182(96)80062-X. [DOI] [PubMed] [Google Scholar]
- Vines DC, Green DE, Kudo G, Keller H. Journal of Nuclear Medicine Technology. 2011 doi: 10.2967/jnmt.111.090951. [DOI] [PubMed] [Google Scholar]


