Abstract
Purpose
Xerostomia is a major complication of head and neck radiotherapy. Available xerostomia measures remain flawed. FDG-PET/CT is routinely used for staging and response assessment of head and neck cancer. We investigated quantitative measurement of parotid gland FDG uptake as a potential biomarker for post-radiotherapy xerostomia.
Methods and Materials
Ninety-eight locally advanced head and neck cancer patients receiving definitive radiotherapy underwent baseline and post-radiotherapy FDG-PET/CT on a prospective imaging trial. A separate validation cohort of 14 patients underwent identical imaging while prospectively enrolled onto a second trial collecting sialometry and patient-reported outcomes. Radiation dose and pre/post-RT SUVs for all voxels contained within parotid gland regions-of-interest were deformably registered.
Results
Average whole gland or voxel-by-voxel models incorporating parotid DMet (defined as the pre-treatment parotid SUV weighted by dose) accurately predicted post-treatment changes in parotid FDG uptake (e.g. fractional parotid SUV). Fractional loss of parotid FDG uptake closely paralleled early parotid toxicity defined by post-treatment salivary output (p < 0.01) and RTOG/EORTC xerostomia scores (p < 0.01).
Conclusions
In this pilot series, loss of parotid FDG uptake strongly associates with acute clinical post-radiotherapy parotid toxicity. DMet may potentially be used to guide function-sparing treatment planning. Prospective validation of FDG-PET/CT as a convenient, quantifiable imaging biomarker of parotid function is warranted and ongoing.
Keywords: Radiotherapy, IMRT, PET/CT, imaging, biomarker, normal tissue toxicity, xerostomia
Introduction
The potential of 18F-FDG-PET/CT to quantifiably assess tumor response to radiation treatment is well documented (1). However, less attention has been paid to identifying functional imaging biomarkers to quantify or predict normal tissue radiation toxicity.
Most patients treated for head and neck cancers experience some degree of xerostomia, which can be assessed subjectively with quality-of-life instruments (QOL) or objectively via measurement of saliva production (2). Clinician-based assessment has been shown to correlate poorly with patient-reported scores and to frequently underestimate clinical severity (3). The inconsistent performance of objective parotid toxicity measures detracts from their clinical utility.
Parotid gland function can be assessed non-invasively with specialized scintigraphic techniques (4, 5). Given the wide availability and use of 18F-FDG PET/CT for head and neck cancer management, incidental parotid gland 18F-FDG uptake may provide an opportunity to develop a quantifiable imaging-based biomarker of parotid gland function. The goals of this study were to 1) identify a relationship between parotid dose and metabolic imaging response, and 2) corroborate correlations between parotid SUV outcome measures and functional parotid toxicity.
Methods and Materials
Patient Cohort
Between 2005 and 2007, 107 consecutive locally advanced head and neck cancer patients receiving definitive radiotherapy were screened for enrollment onto a previously described prospective IRB-approved imaging trial (MDACC LAB 07-0043) (6, 7). Screened patients were eligible for enrollment if they were 18 years of age and had biopsy-proven American Joint Commission on Cancer (AJCC) version 6 stage II-IVb squamous cell carcinoma of the pharyngolaryngeal axis. Nine patients were ineligible for inclusion (two withdrew consent, five underwent surgical resection, and two had FDG-PET/CT scans performed outside the window of timing stipulated by protocol). This left an analyzable study cohort of 98 patients.
A separate cohort of 14 patients enrolled onto a separate IRB-approved trial (MDACC LAB 07-0050) prospectively collecting sialometry and patient-reported outcomes in head and neck IMRT patients. These 14 cases were used for pilot clinical validation of parotid FDG-PET/CT response measures.
IMRT Treatment Planning
Prescribed volumetric target doses ranged from 66 to 70 Gy in 30 to 35 fractions. IMRT was delivered via step-and-shoot multi-leaf collimation through a fixed gantry arrangement. Treatment planning was performed using a Pinnacle3 system (version 6.2b or later, Philips Medical Systems; Andover, MA). Mean dose to either parotid gland was limited to < 26 Gy when feasible. Institutional policy did not permit sparing of submandibular or sublingual glands. Most patients received concurrent systemic therapy (Table 1).
Table 1.
Study Cohorts
| Characteristic | Primary Cohort (n=98) |
Validation Cohort (n=14) |
|
|---|---|---|---|
| Age | 58 (36–79) | 54 (42–75) | |
| Sex | Male | 83 (85) | 13 (93) |
| Female | 15 (15) | 1 (7) | |
| Race | White | 82 (84) | 14 (100) |
| Black | 7 (7) | 0 | |
| Hispanic | 7 (7) | 0 | |
| Other | 2 (2) | 0 | |
| Tobacco History | Non-Smoker | 49 (50) | 7 (50) |
| Smoker | 49 (50) | 7 (50) | |
| AJCC Stage | I | 0 | 0 |
| II | 3 (4) | 0 | |
| III | 22 (22) | 0 | |
| IV | 73 (74) | 14 (100) | |
| T Stage | x | 4 (4) | 0 |
| 0 | 0 | 0 | |
| 1 | 8 (8) | 1 (7) | |
| 2 | 27 (28) | 6 (43) | |
| 3 | 37 (38) | 2 (14) | |
| 4 | 22 (22) | 5 (36) | |
| N Stage | x | 2 (2) | 0 |
| 0 | 16 (16) | 1 (7) | |
| 1 | 13 (13) | 0 | |
| 2a | 4 (4) | 2 (14) | |
| 2b | 39 (40) | 9 (65) | |
| 2c | 22 (22) | 2 (14) | |
| 3 | 2 (2) | 0 | |
| Site | Oropharynx | 77 (79) | 14 (100) |
| Larynx | 12 (12) | 0 | |
| Hypopharynx | 9 (9) | 0 | |
| Radiation | Dose (Gy) | 70 (66–72) | 70 (66–72) |
| Duration (Days) | 44 (30–57) | 43 (40–47) | |
| Chemotherapy | Platinum | 65 (66) | 10 (72) |
| None | 21 (21) | 2 (14) | |
| Cetuximab | 11 (11) | 1 (7) | |
| Taxane | (1) 1 | (7) | |
18F-FDG PET/CT Imaging
Each patient underwent two FDG-PET/CT scans: the first within 4 weeks prior to starting therapy, and the second during 7th–9th week following the end of treatment. FDG-PET/CT images were uniformly acquired and analyzed with a single instrument (Discovery ST-8; GE Medical Systems, Milwaukee, WI), as previously described (6).
Image Registration for Parotid Segmentation and Parotid Dose-SUV Correlations
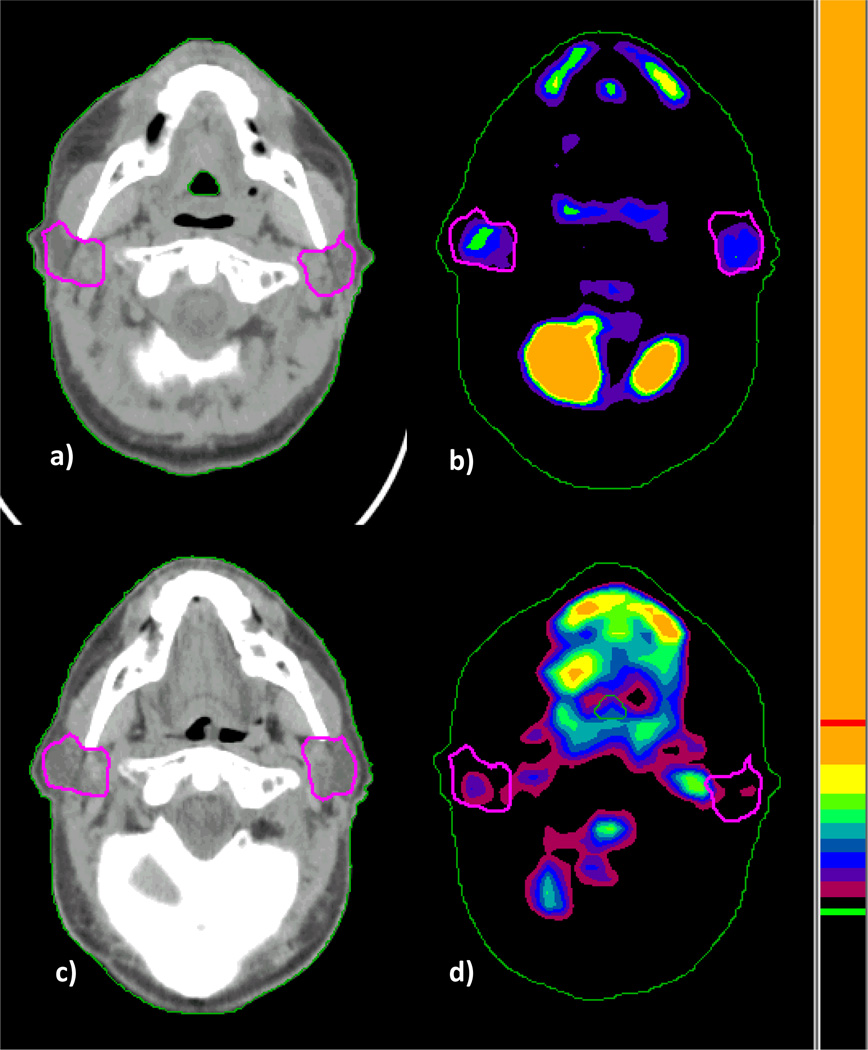
Physician-defined contours from radiotherapy treatment plans were used as regions-of-interest (ROI) to calculate parotid standard uptake value (SUV) (8). Intensity of parotid metabolic activity was analyzed using a semiautomated vendor-provided tool (GE Advantage workstation; GE Medical Systems, Milwaukee, WI). SUV was calculated according to the formula: SUV = measured activity within the volume of interest (mCi/mL)/injected dose of FDG (mCi)/body weight (g). A single observer (BC) calculated SUV for parotid ROIs on each study. To correlate radiation dose distribution with parotid FDG uptake before and after treatment, we used an in-house deformable image registration algorithm to create one-to-one correspondence between the planning CT and the PET/CT images (9). The spatial deformation field mapping, which was derived from the CT-to-CT deformable image registration, was used to map FDG activity voxel-by-voxel onto the treatment planning CT for analysis. In Figure 1, representative baseline and post-treatment FDG-PET/CT imaging with parotid gland segmentation is shown. Both parotid ROI-based and voxel-by-voxel-based dose-response analyses were performed. In the voxel-by-voxel analysis, scripting within the Pinnacle treatment planning system was developed to extract dose information for every voxel within parotid glands.
Figure 1.
To model functional relationships between parotid fractional SUV and parotid dose, we introduced a phenomenological figure of merit which we termed metabolic dose (DMet). This term was defined as:
whereby DMet represents the product of pre-treatment SUV (Pre-RT SUV in Kg/L) and physical dose (cGy) at each voxel. This term weights physical dose by baseline SUV. Thus, DMet models dose-damage by weighing voxels treated to higher dose in regions with highest baseline metabolic function as being at greatest risk for changes in post-treatment SUV.
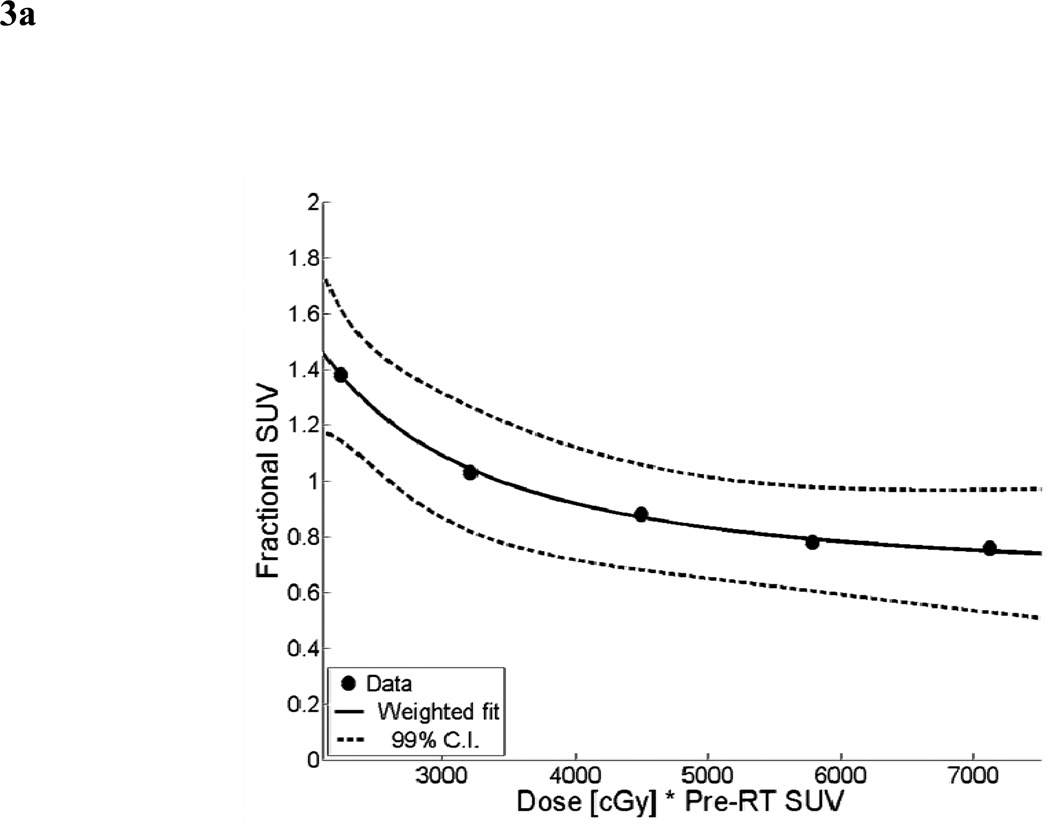
Rather than absolute baseline and post-treatment parotid SUV values, we focused on relative post-treatment change in SUV (i.e. ratio of post-RT SUV/pre-RT SUV, or fractional SUV). We reasoned that testing associations between parotid fractional SUV and DMet as continuous variables could improve upon older NTCP techniques that rely on dichotomized clinical endpoints (10). We took two approaches to model dose-metabolic response. First, a mean parotid dose-SUV model was assessed over a range of DMet values extending from a minimum of 2235 to a maximum of 7115. A power law with a constant offset was selected to model the data over the range of values found in this population. The functional form of this model is:
DMet is represented by x, and a, b, c are fitting parameters. From the primary cohort dataset, constant a was calculated to be 3.6 × 10⁵ with 95% confidence bounds of (−2.8 × 10⁶, 3.6 × 10⁶). Constant b was −1.7 with 95% confidence bounds of (−2.88, −0.52). Offset constant c was 0.65 with 95% confidence bounds of (0.42, 0.87). The adjusted R2 statistic for the fit was found to be 0.996. The sum of squares due to error (SSE) was 0.0004.
Second, a voxel-based parotid dose-SUV model was constructed. After co-registration of pre- and post-RT SUV with dose distribution, DMet data were binned in increments of 2000 cGy. A modified logistic function was used to model fractional SUV at the voxel level as a function of DMet. The functional form has been modified to prevent fractional SUV values of zero. At DMet = 0, a boundary condition was imposed whereby the fractional SUV was assumed to be one. The functional form of this model is:
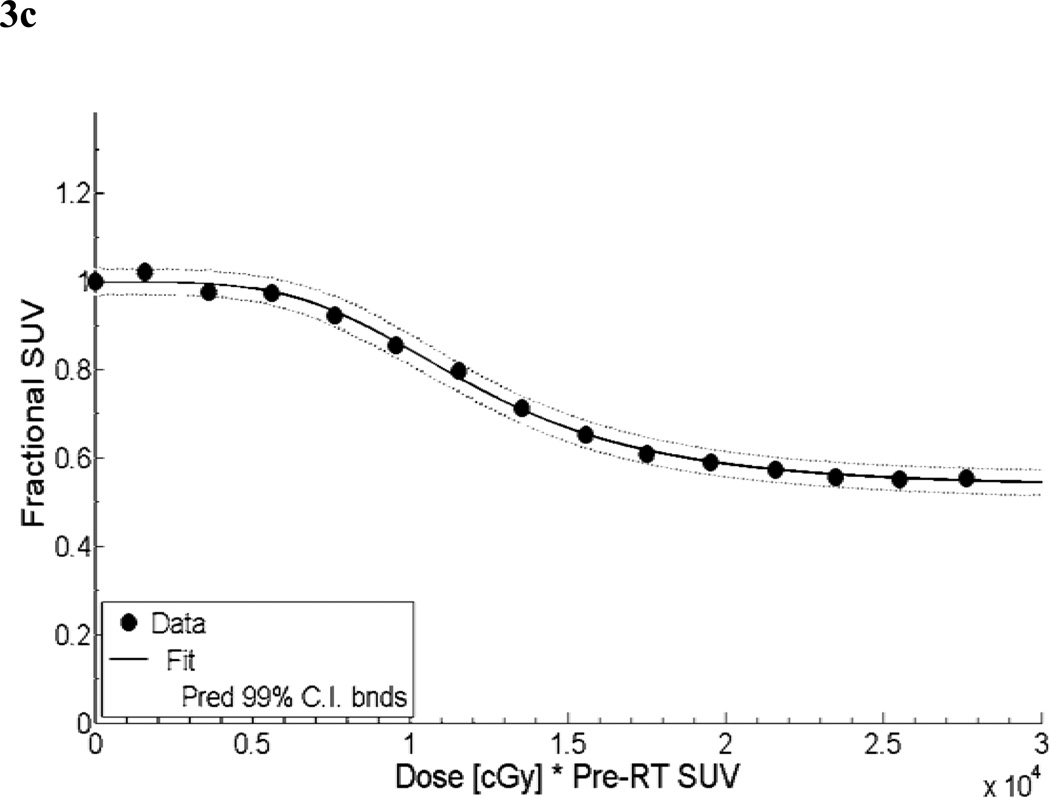
DMet is again represented by x, and a, b, c, d, e are fitting parameters. From the primary cohort dataset, constant a was calculated to be 0.4669 with 95% confidence bounds of (0.4434, 0.4905). Constant b value was 7.599 with 95% confidence bounds of (5.287, 9.912). Constant c served to scale DMet values and was 2.25 × 10⁴ with 95% confidence bounds of (2.1 × 10⁴, 2.8 × 10⁴). The power value, constant d, was 3.943 with 95% confidence bounds of (3.181, 4.706). Finally, the offset constant e was 0.5324 with 95% confidence bounds of (0.513, 0.5517). The adjusted R2 statistic for the fit was found to be 0.9987. The sum of squares due to error (SSE) was 0.0007.
Sialometry and Toxicity Assessment
Subjective and objective measures of salivary function in the validation cohort were collected at five time points. We performed baseline collection prior to the start of radiotherapy. Initial 6–8 week sialometry and RTOG time point scores were used for our current analysis. Insufficient follow-up for the second clinical trial precluded use of subsequent 4-6 month, 12 month, and 24 month post-radiotherapy time points. Although we analyzed all fourteen patients in this cohort for baseline correlations of saliva mass and SUV, we used only a subset of eight patients for post-RT analysis. We restricted analysis to patients who had undergone post-RT saliva collection as specified by protocol, to minimize confounding technical and/or collection timing factors.
Whole mouth stimulated and unstimulated saliva was collected at each time point. Unstimulated collection was performed first. Each empty vial was weighed prior to collection. Patients were instructed to let saliva accumulate in the mouth. Every sixty seconds the patient expectorated saliva into a 100 ml vial. After 5 minutes of collection the vial was weighed. The difference between the two measurements was recorded as saliva mass. Patients rested for five minutes before collection of stimulated whole mouth saliva. For this, 20 ml of a citric acid solution was held in the patient’s mouth for one minute. The same methodology was employed to collect stimulated salivary mass.
Patients filled out a self-reported late xerostomia-specific questionnaire (XQL) (2) prior to each sialometry collection. Patients completed a set of eight questions on the degree of difficulty talking, chewing, and swallowing due to perceived dryness. Each question received a score of 1– 10, with greater numerical value corresponding to greater perceived toxicity. A summary score was created by summing the results of each question to produce a value between 0 and 80. Observer-based assessment of salivary toxicity at each evaluation time point followed the EORTC/RTOG late effects toxicity scoring scale (11).
Statistical Analysis
For dose-SUV response models, plots of predicted versus observed parotid fractional SUV were constructed. Relative errors in modeling were computed as (Predicted – Observed)/Observed *100. Spearman’s ρ testing was used to assess correlations between predicted and observed values. Statistically significant results were defined as having p < 0.05. Fractional SUV was tested against continuous fractional stimulated salivary flow values via Pearson’s correlation and against ordinal xerostomia RTOG/EORTC late effects scores and patient-reported XQL scores by Spearman’s ρ testing. A p-value <0.05 was considered significant.
Results
Patient Characteristics
Characteristics for the primary and validation cohorts are summarized in Table 1.
Parotid Dosimetry and Fractional SUV Outcomes
The average dose delivered to the parotid glands for all study patients was 25.4 ± 6.0 Gy. Mean parotid dose ranged from 14.4 to 42.8 Gy. Mean parotid doses clustered below 26 Gy, in keeping with our intended treatment planning goals.
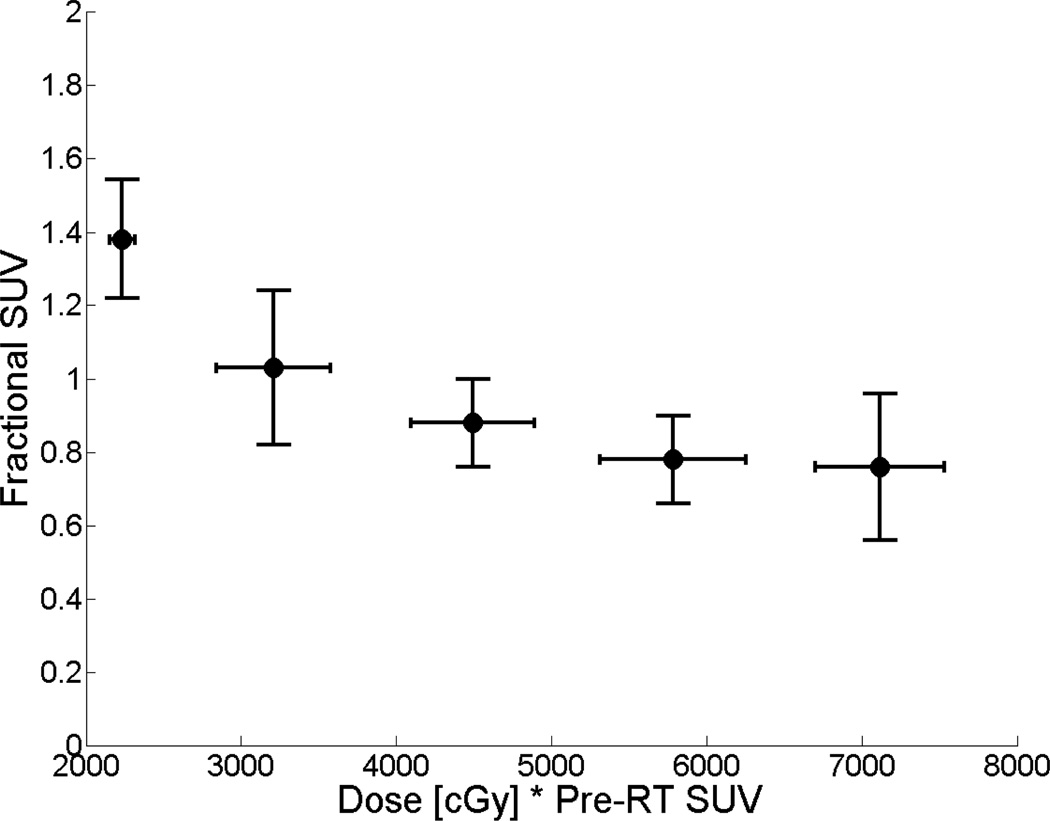
Our analysis focused on relative post-treatment change in SUV (or fractional SUV). Mean parotid fractional SUV for the cohort was 0.96 ± 0.24. Values ranged from 0.62 to 1.85, indicating variable tracer uptake across individual glands following treatment. The relationship between fractional SUV and parotid DMet for the primary study cohort is shown in Figure 2.
Figure 2.
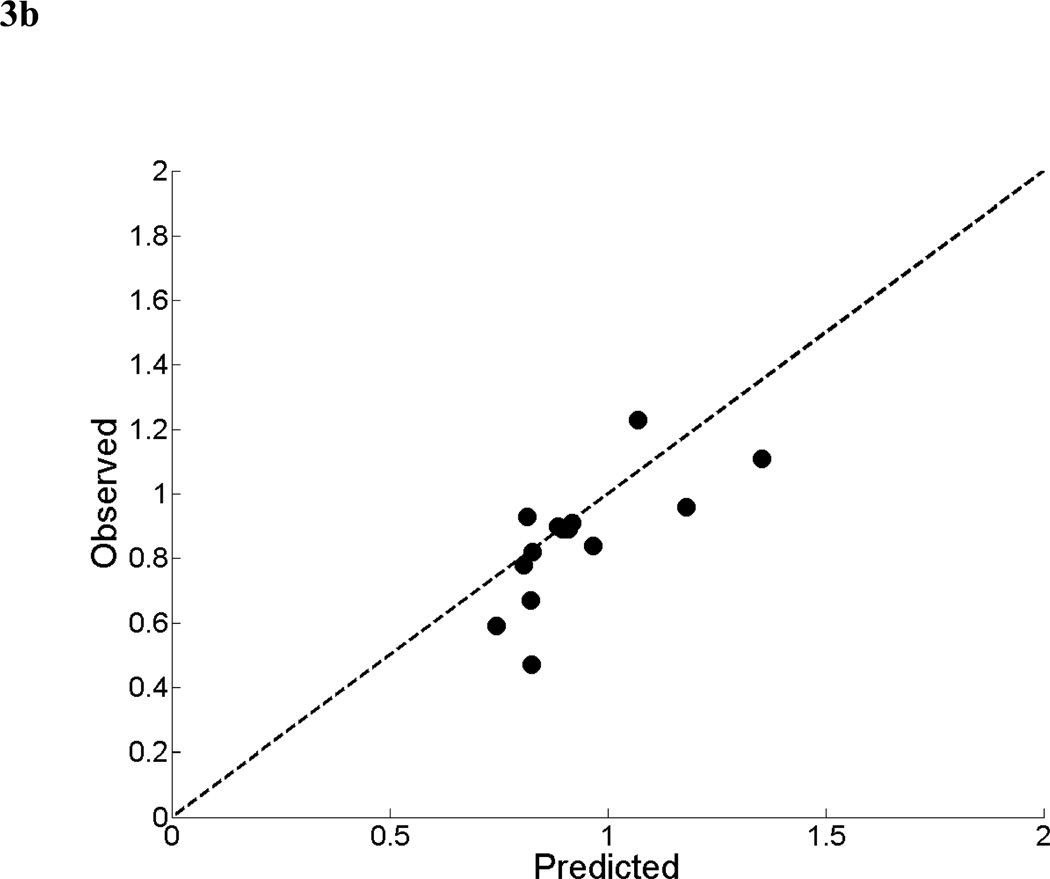
For the mean parotid dose-SUV model, the results of the non-linear least squares fit from the primary cohort are shown in Figure 3a. A scatter plot of observed fractional SUV values from the validation cohort versus predicted fractional SUV from the mean dose-SUV model is shown in Figure 3b. The dotted line represents ideal model performance. The mean relative error between the predicted and observed fractional SUV was 13% (range: −13 to 76%). Predicted and observed values were found to have a significant correlation (Spearman’s ρ = 0.71, p < 0.01).
Figure 3.
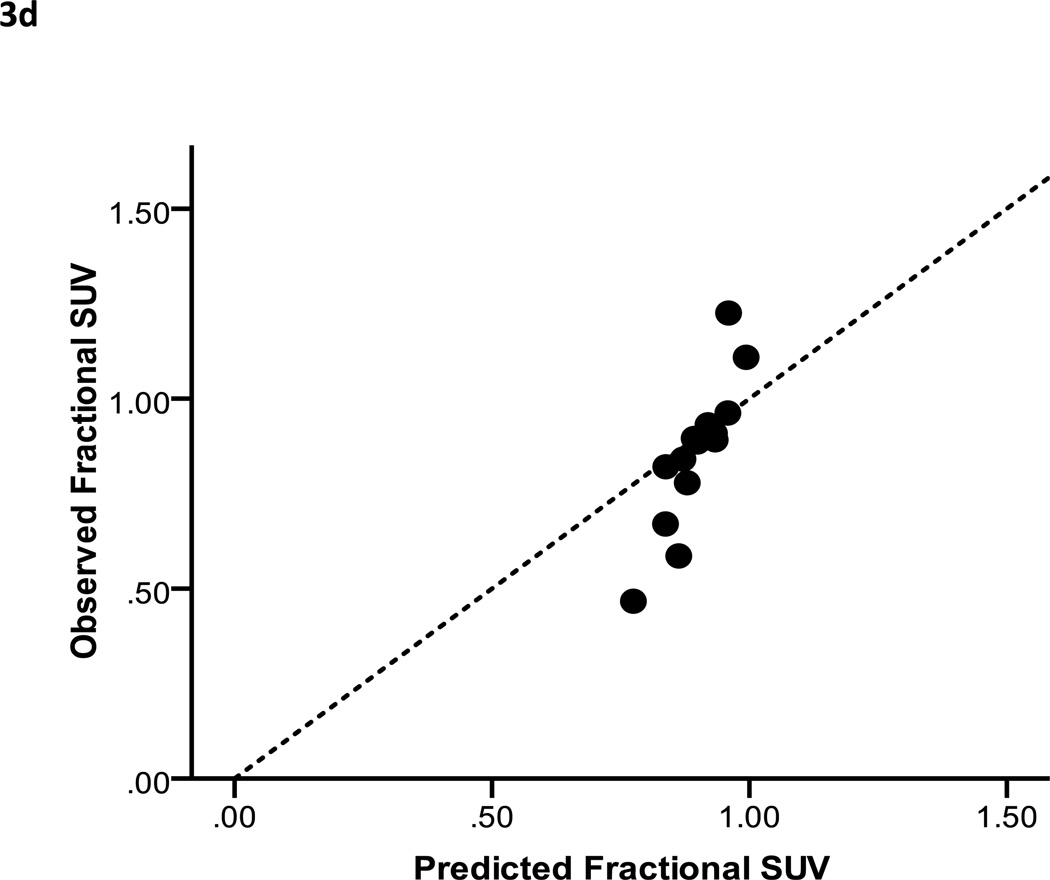
The results of the linear least squares fit from the primary cohort are shown in Figure 3c. A scatter plot of observed fractional SUV values from the validation cohort versus predicted fractional SUV is shown in Figure 3d. The mean relative error between the predicted and observed fractional SUV was 9.6% (range: −22 to 65%). Predicted and observed values correlated closely (Spearman’s ρ = 0.94, p < 0.005). The combination of the adjusted R2 and graphical analysis indicate that the voxel-based model performed at least as well, and in most cases better than the mean parotid dose-SUV model.
Baseline and Post-RT Salivary Function
Mean baseline unstimulated saliva flow in the validation cohort was 1.92 ± 1.04 g (range: 0.45 – 4.04 g). Mean baseline stimulated saliva production was 5.51 ± 2.4 g (range: 1.51 – 9.46 g). Average time to follow-up sialometry was 52 days post-RT (range: 42 – 62 days). Data from eight patients at this time point were available. The mean unstimulated saliva mass produced after RT was 1.16 ± 1.52 g (range: 0.47 – 4.90 g), and mean stimulated saliva production was 2.26 ± 2.08 g (range: 1.00 – 7.20 g).
Post-RT Stimulated Salivary Function and Fractional Parotid SUV Outcomes
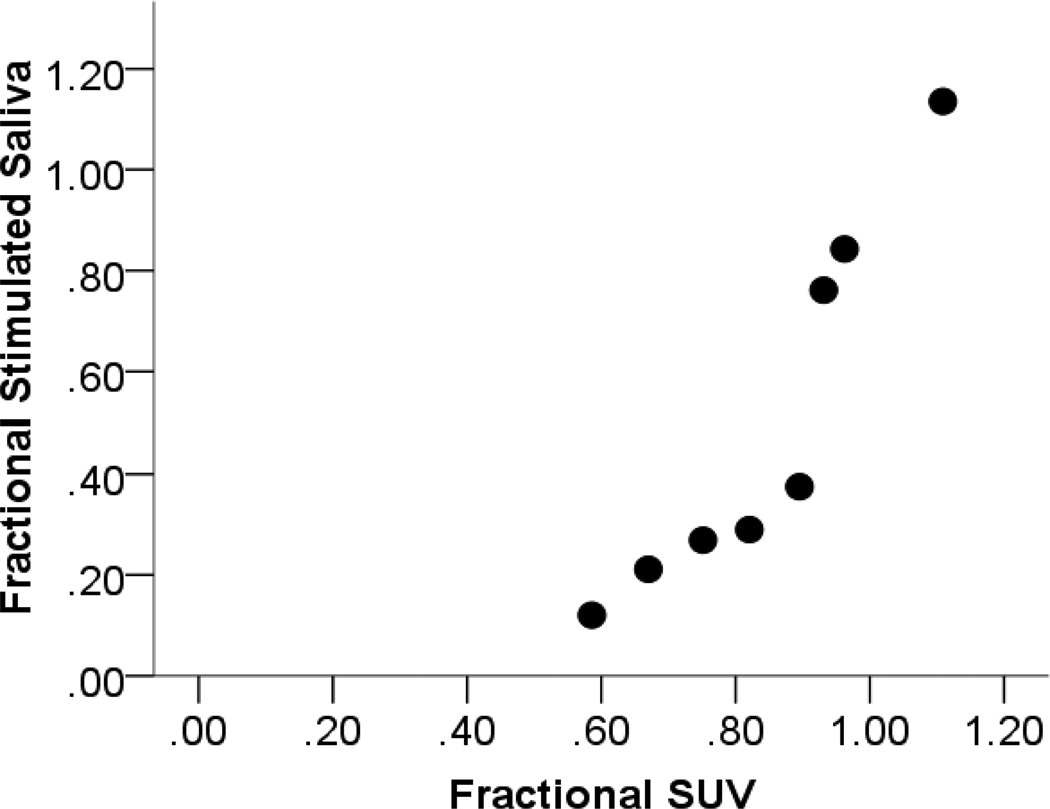
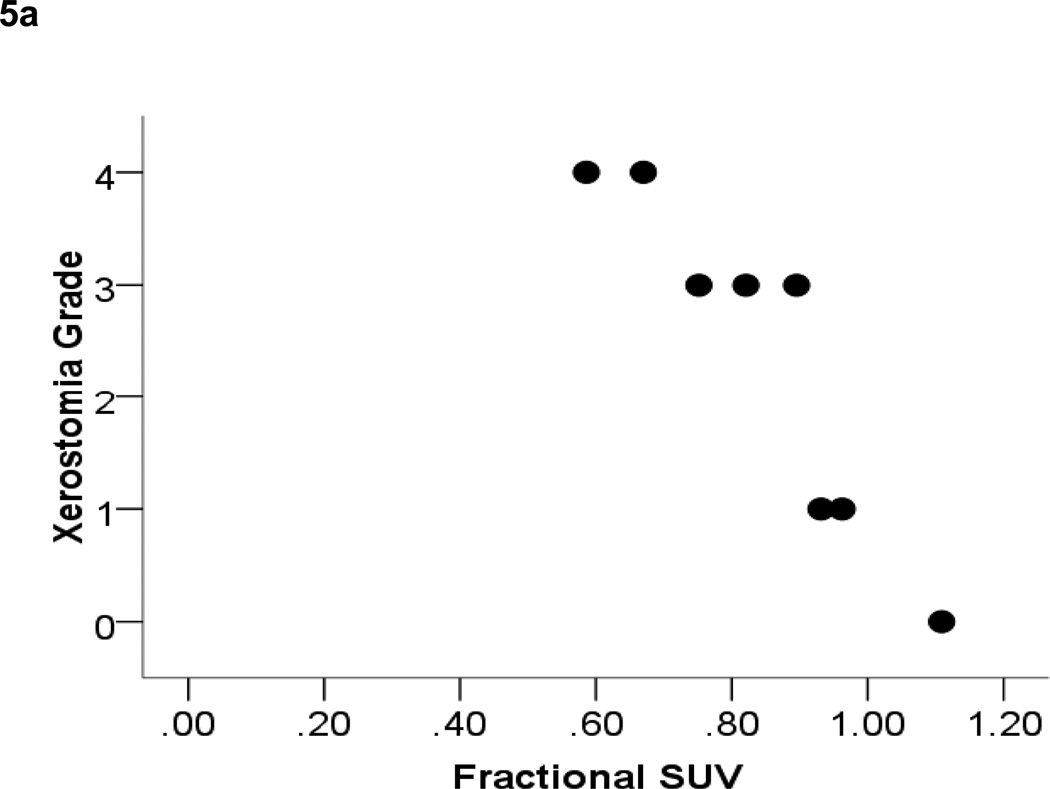
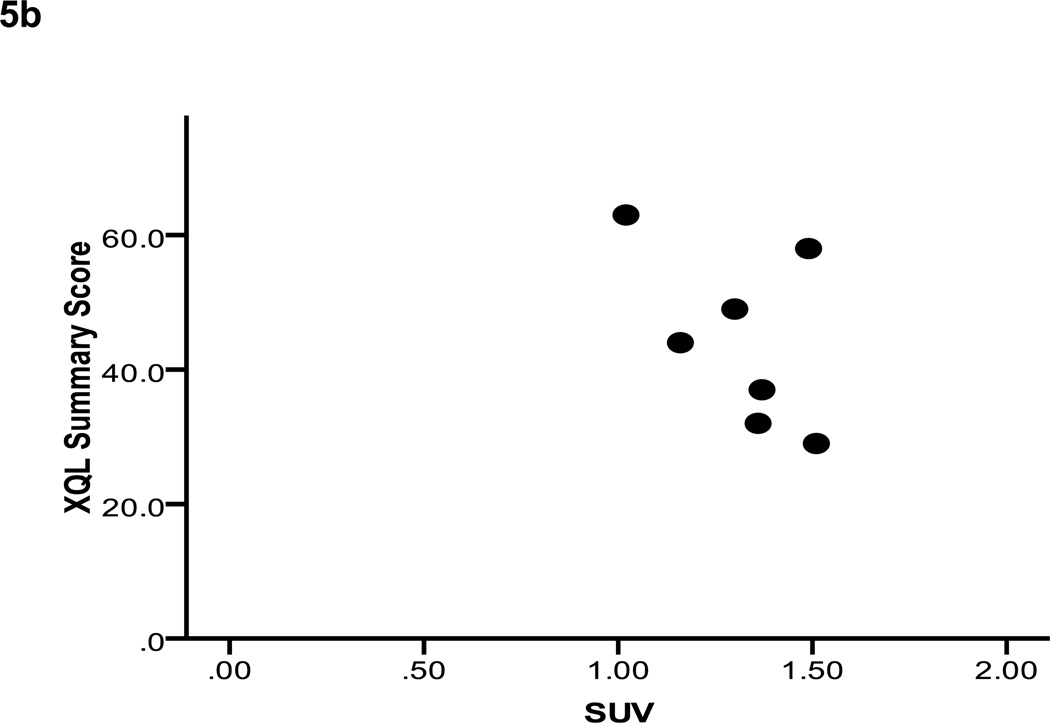
Residual stimulated saliva output relative to baseline for the validation cohort was 0.41 ± 0.28. Reductions in fractional parotid SUV (0.80 ± 0.14) paralleled those in parotid salivary output. These measures demonstrated a strong positive correlation (Pearson’s correlation = 0.93, p < 0.01) (Figure 4). Fractional parotid SUV correlated closely with RTOG/EORTC late xerostomia scores. Xerostomia grade negatively correlated with fractional parotid SUV (Spearman’s ρ = −0.964, p < 0.01) (Figure 5a). Interestingly, although a negative correlation was also seen between fractional parotid SUV and patient-reported XQL scores, this relationship did not retain significance (Spearman’s ρ = −0.56, p > 0.05) (Figure 5b).
Figure 4.
Figure 5.
Discussion
In vivo and in vitro studies have demonstrated tumor FDG uptake to be directly related to quantity of viable cancer cells. Such a relationship has been assumed but not well investigated for normal tissues. The parotid glands are responsible for the majority of reflexive salivary production stimulated by eating. Secretory acini comprise 80% of the parotid by volume. Following delivery of 30 Gy to a rodent parotid model, the volume occupied by acini is reduced to 20% of glands, paralleling a 90% reduction in salivary production (12). In humans, loss of acini 10 weeks after head and neck radiotherapy has been demonstrated histologically (13). In this study we confirm a 59% reduction in stimulated salivary flow in examined patients 7 weeks post-treatment. This parallels earlier work documenting significant volumetric reductions in parotid gland size during treatment (14).
The sum of these findings led us to hypothesize that parotid FDG uptake would be proportional to viable acini within parotid glands. This would afford novel application of FDG-PET/CT as a functional biomarker of normal tissue toxicity. Non-invasive, quantifiable biomarkers would be of particular value for predicting and serially measuring parotid gland toxicity from head and neck radiotherapy. Salivary flow outcome measures are impacted by age, gender, and baseline variations across individuals (15, 16). Temporal variation of measurements within the same individual is common. Furthermore, clinician-reported outcomes correlate poorly with patient-reported measures (emphasized by incongruous results we found between observer and patient-reported xerostomia outcomes in Figure 5) and frequently underestimate perceived xerostomia (3). Thus, validation of an objective imaging biomarker of parotid function may provide important improvement in reproducibility and clinical relevance of assessment.
Biomarker analysis of incidental parotid tracer uptake on routine serial FDG-PET/CT imaging is novel. One other series retrospectively analyzed 49 patients treated with head and neck IMRT and serially imaged with FDG-PET/CT (17). These authors reported absolute SUV rather than fractional measures and found post-treatment parotid SUVmean to decline by 5.2% ± 2.5% for every 10 Gy increase in mean dose (p = 0.04), and parotid SUVmax to decrease sigmoidally with increasing mean dose. Post-treatment parotid SUVmax decreased rapidly beyond a threshold of 32 Gy. No clinical correlates were available to validate these pilot results. In contrast, we found absolute SUV measures to be of no consistent utility, and observed only non-significant correlations between absolute SUV and baseline/post-treatment sialometry, observer-based measures, or patient-reported outcomes. Such lack of correlation reflects the potential importance of technical confounders, such as the low dynamic range of absolute parotid SUV values, patient preparation inconsistencies, incorrect cross-calibration of scanner and dose calibrator, variable tracer injection to imaging intervals, and imperfect correlations between SUV and actual FDG retention.
Absolute salivary production may not correlate well with perceived severity of xerostomia (16). Instead, relative change in an individual’s saliva production has been proposed to be more clinically relevant to subjective xerostomia outcomes. Likewise, we chose to focus on relative post-treatment changes in parotid SUV (i.e. fractional SUV) to minimize the effects of technical imaging uncertainties on our analysis. Fractional SUV outcomes correlated closely, and in the expected directions, with sialometry and observer-based xerostomia measures (Figures 4, 5). We also introduced DMet as a conceptual measure to weight physical dose delivered to the parotid glands according to baseline SUV. We reasoned that parotid tissues treated to greater dose and/or with highest baseline metabolic activity would be at risk for the largest decrements in viability detected by post-treatment SUV values. DMet requires further validation as a PET outcome measure for normal tissue. However, our data demonstrate promising pilot results using DMet to model parotid FDG-PET/CT outcome predictions (Figure 3). If validated, we envision that DMet may be used clinically to tailor dose painting and/or adaptive replanning techniques to individual head and neck radiotherapy patients.
This study is limited by small sample sizes and short longitudinal follow-up, particularly for corroborative sialometry and clinical xerostomia outcomes. Lack of correlation between fractional parotid SUV and patient-reported toxicity may indicate that XQL questionnaire scores are not valid in patients queried so soon after treatment. In addition, we measured whole mouth salivary output rather than collecting output from individual glands. This may have obscured relationships between salivary production and parotid SUV measures, particularly at baseline. Since our institutional policy is to not spare dose to submandibular or sublingual glands, this issue would be less relevant to post-RT measures, particularly since we used stimulated salivary production as our primary sialometry outcome measure. Finally, fractional parotid SUV and DMet will require further validation to support our hypothesis that these measures represent a more robust, mechanistically sophisticated evolution from straightforward absolute parotid SUV values. Prospective corroboration of all key results from this preliminary work is currently underway at our institution.
Acknowledgments
Grant Support: Supported in part by a sponsored research agreement with Varian Medical Systems (to LD), and a Career Development Award from the University of Texas M.D. Anderson Cancer Center Specialized Program of Research Excellence (SPORE) in Head and Neck Grant CA97007 and NCI grant CA132281 (to DLS).
Footnotes
Publisher's Disclaimer: This is a PDF file of an unedited manuscript that has been accepted for publication. As a service to our customers we are providing this early version of the manuscript. The manuscript will undergo copyediting, typesetting, and review of the resulting proof before it is published in its final citable form. Please note that during the production process errors may be discovered which could affect the content, and all legal disclaimers that apply to the journal pertain.
Disclosures of Potential Conflicts of Interest: None.
References
- 1.Weber WA. Positron emission tomography as an imaging biomarker. J Clin Oncol. 2006;24:3282–3292. doi: 10.1200/JCO.2006.06.6068. [DOI] [PubMed] [Google Scholar]
- 2.Eisbruch A, Kim HM, Terrell JE, et al. Xerostomia and its predictors following parotid-sparing irradiation of head-and-neck cancer. Int J Radiat Oncol Biol Phys. 2001;50:695–704. doi: 10.1016/s0360-3016(01)01512-7. [DOI] [PubMed] [Google Scholar]
- 3.Meirovitz A, Murdoch-Kinch CA, Schipper M, et al. Grading xerostomia by physicians or by patients after intensity-modulated radiotherapy of head-and-neck cancer. Int J Radiat Oncol Biol Phys. 2006;66:445–453. doi: 10.1016/j.ijrobp.2006.05.002. [DOI] [PubMed] [Google Scholar]
- 4.Roesink JM, Moerland MA, Hoekstra A, et al. Scintigraphic assessment of early and late parotid gland function after radiotherapy for head-and-neck cancer: a prospective study of dose-volume response relationships. Int J Radiat Oncol Biol Phys. 2004;58:1451–1460. doi: 10.1016/j.ijrobp.2003.09.021. [DOI] [PubMed] [Google Scholar]
- 5.Tenhunen M, Collan J, Kouri M, et al. Scintigraphy in prediction of the salivary gland function after gland-sparing intensity modulated radiation therapy for head and neck cancer. Radiother Oncol. 2008;87:260–267. doi: 10.1016/j.radonc.2008.02.017. [DOI] [PubMed] [Google Scholar]
- 6.Moeller BJ, Rana V, Cannon BA, et al. Prospective risk-adjusted [18F]Fluorodeoxyglucose positron emission tomography and computed tomography assessment of radiation response in head and neck cancer. J Clin Oncol. 2009;27:2509–2515. doi: 10.1200/JCO.2008.19.3300. [DOI] [PMC free article] [PubMed] [Google Scholar]
- 7.Moeller BJ, Rana V, Cannon BA, et al. Prospective imaging assessment of mortality risk after head-and-neck radiotherapy. Int J Radiat Oncol Biol Phys. 2010;78:667–674. doi: 10.1016/j.ijrobp.2009.08.063. [DOI] [PMC free article] [PubMed] [Google Scholar]
- 8.van de Water TA, Bijl HP, Westerlaan HE, et al. Delineation guidelines for organs at risk involved in radiation-induced salivary dysfunction and xerostomia. Radiother Oncol. 2009;93:545–552. doi: 10.1016/j.radonc.2009.09.008. [DOI] [PubMed] [Google Scholar]
- 9.Wang H, Dong L, O'Daniel J, et al. Validation of an accelerated 'demons' algorithm for deformable image registration in radiation therapy. Phys Med Biol. 2005;50:2887–2905. doi: 10.1088/0031-9155/50/12/011. [DOI] [PubMed] [Google Scholar]
- 10.Tucker SL, Cheung R, Dong L, et al. Dose-volume response analyses of late rectal bleeding after radiotherapy for prostate cancer. Int J Radiat Oncol Biol Phys. 2004;59:353–365. doi: 10.1016/j.ijrobp.2003.12.033. [DOI] [PubMed] [Google Scholar]
- 11.Pavy JJ, Denekamp J, Letschert J, et al. EORTC Late Effects Working Group. Late Effects toxicity scoring: the SOMA scale. Int J Radiat Oncol Biol Phys. 1995;31:1043–1047. doi: 10.1016/0360-3016(95)00059-8. [DOI] [PubMed] [Google Scholar]
- 12.Konings AW, Faber H, Cotteleer F, et al. Secondary radiation damage as the main cause for unexpected volume effects: a histopathologic study of the parotid gland. Int J Radiat Oncol Biol Phys. 2006;64:98–105. doi: 10.1016/j.ijrobp.2005.06.042. [DOI] [PubMed] [Google Scholar]
- 13.Fajardo LF, Berthrong M. Radiation injury in surgical pathology. Part III. Salivary glands, pancreas and skin. Am J Surg Pathol. 1981;5:279–296. doi: 10.1097/00000478-198104000-00008. [DOI] [PubMed] [Google Scholar]
- 14.Barker JL, Jr, Garden AS, Ang KK, et al. Quantification of volumetric and geometric changes occurring during fractionated radiotherapy for head-and-neck cancer using an integrated CT/linear accelerator system. Int J Radiat Oncol Biol Phys. 2004;59:960–970. doi: 10.1016/j.ijrobp.2003.12.024. [DOI] [PubMed] [Google Scholar]
- 15.Fischer D, Ship JA. Effect of age on variability of parotid salivary gland flow rates over time. Age Ageing. 1999;28:557–561. doi: 10.1093/ageing/28.6.557. [DOI] [PubMed] [Google Scholar]
- 16.Ship JA, Nolan NE, Puckett SA. Longitudinal analysis of parotid and submandibular salivary flow rates in healthy, different-aged adults. J Gerontol A Biol Sci Med Sci. 1995;50:M285–M289. doi: 10.1093/gerona/50a.5.m285. [DOI] [PubMed] [Google Scholar]
- 17.Roach MC, Turkington TG, Higgins KA, et al. FDG-PET Assessment of the Effect of Head and Neck Radiotherapy on Parotid Gland Glucose Metabolism. Int J Radiat Oncol Biol Phys. doi: 10.1016/j.ijrobp.2010.08.055. Epub.10/27/2010. [DOI] [PubMed] [Google Scholar]


