Abstract
The formation of R-loops is a natural consequence of the transcription process, caused by invasion of the DNA duplex by nascent transcripts. These structures have been considered rare transcriptional by-products with potential harmful effects on genome integrity, due to the fragility of the displaced DNA coding strand1. However R-loops may also possess beneficial effects as their widespread formation has been detected over CpG island promoters in human genes2,3. Furthermore we have previously shown that R-loops are particularly enriched over G-rich terminator elements. These facilitate RNA polymerase II (Pol II) pausing prior to efficient termination4. Here we reveal an unanticipated link between R-loops and RNA interference (RNAi)-dependent H3K9me2 formation over pause site termination regions of mammalian protein coding genes. We show that R-loops induce antisense transcription over these pause elements which in turn lead to the generation of double-strand RNA (dsRNA) and recruitment of Dicer, Ago1, Ago2, and G9a histone lysine methyltransferase (HKMT). Consequently an H3K9me2 repressive mark is formed and Heterochromatin Protein 1γ (HP1γ) is recruited, that reinforces Pol II pausing prior to efficient transcriptional termination. We predict that R-loops promote a chromatin architecture that defines the termination region for a substantial subset of mammalian genes.
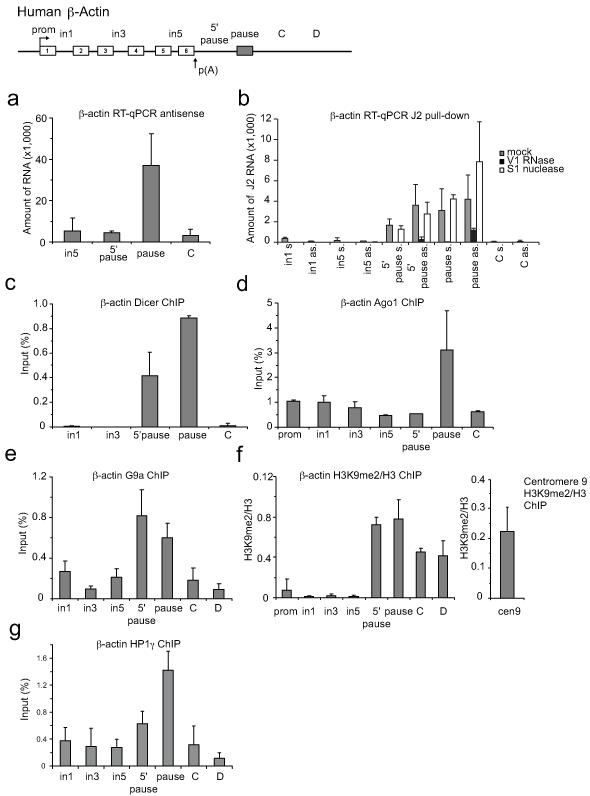
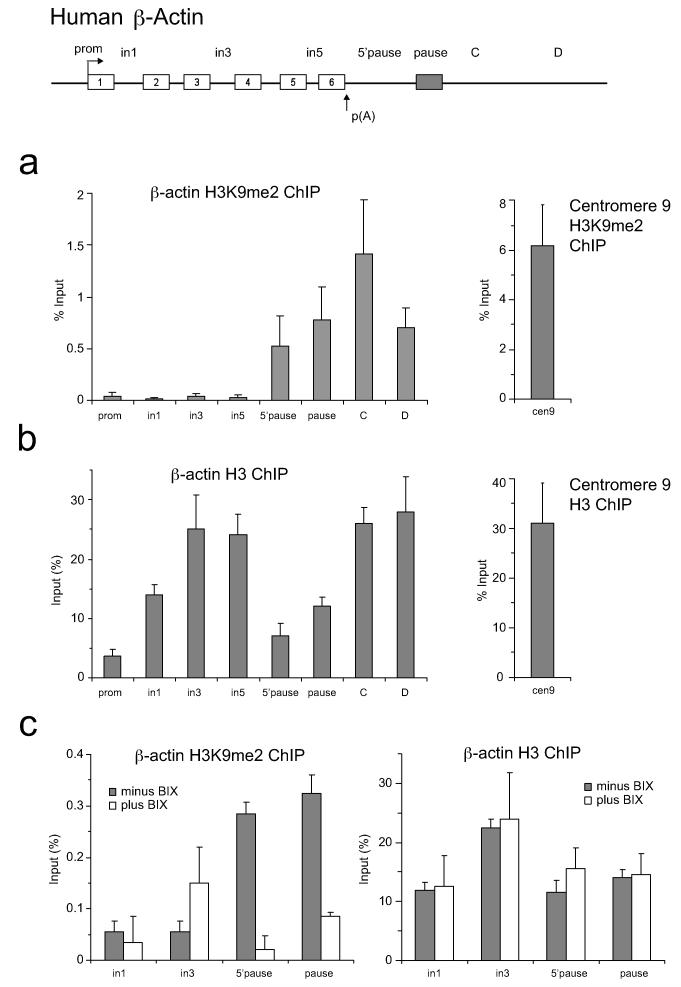
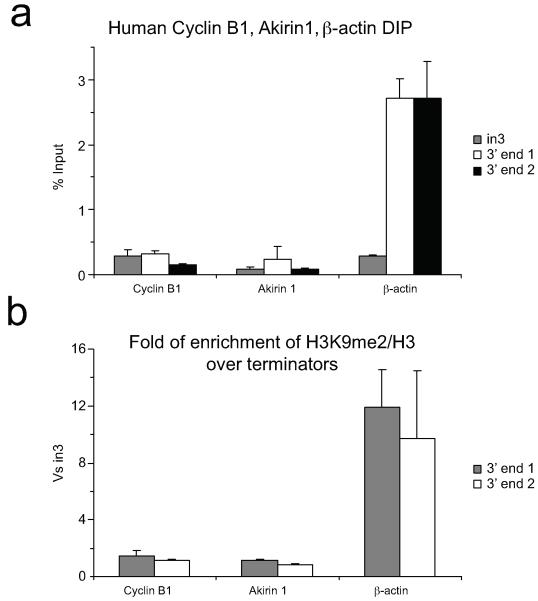
A connection between R-loops and heterochromatin formation was first made in fission yeast where removal of R-loops in centromeres caused a loss of heterochromatin structure5. An emerging theme is that heterochromatin and RNAi machinery act broadly across the genome to regulate gene expression6-7. Since processing of dsRNA is the trigger for RNAi-dependent gene silencing, a source for the generation of dsRNA could be the hybridisation of antisense transcripts with nascent pre-mRNA. We first detected localised antisense transcription over the termination region (pause site) of the human β-actin gene by Reverse Transcriptase (RT)-PCR analysis (Fig. 1a). Next we tested for the formation of dsRNA by immuno-precipitation from whole HeLa cell extracts with the dsRNA-specific antibody, J28. Selected RNA was analysed by strand-specific RT-qPCR. Positive signals for both sense and antisense transcripts were detected over 5′ pause and pause regions (grey bars), suggesting that dsRNA is formed over these regions (Fig. 1b). dsRNA specific V1, but not S1 nuclease treatments abolished sense and antisense signals, confirming dsRNA presence. Dicer and Ago1 RNAi factors were also enriched over this region, based on Chromatin Immunoprecipitation (ChIP) analysis (Fig. 1c,d). Methylation of H3K9 is known to be the most conserved epigenetic mark associated with transcriptional silencing9. Since G9a and GLP are considered the major H3K9me1 and H3K9me2 HKMTs of euchromatin10,11, we performed ChIP analysis using anti-G9a antibody which again showed G9a enrichment around the pause element (Fig. 1e). We also confirmed that H3K9me2 marks occur over the termination regions of the human β-actin gene (Fig. 1f, Extended Data Fig. 1a,b). H3K9me creates a binding site for the chromodomain of HP1 proteins (HP1α, β and γ). We further show that HP1γ is enriched over our heterochromatin terminator (Fig. 1g), consistent with the known association of HP1γ with active genes12-15. This suggests that HP1γ acts as heterochromatin ‘reader’ over the human β-actin R-loop termination region. Previously, we showed using transfected gene constructs that R-loops are associated with termination regions, comprising a functional poly(A) signal (PAS) and G-rich pause elements4. To investigate whether R-loops and H3K9me2 mark are specific features of the pause-dependent termination mechanism, we employed Cyclin B1 and Akirin 1 genes that utilise alternative CoTC terminators16. DNA Immunoprecipitation (DIP) and H3K9me2 ChIP analyses (Extended Data Fig. 2) showed no R-loop or H3K9me2 marks over these CoTC terminators, suggesting that such features are restricted to genes possessing pause site terminators.
Figure 1. RNAi-dependent H3K9me2 repressive mark formed over human β-actin terminator in HeLa cells.
a. RT-qPCR of β-actin antisense transcription. RT with region-specific forward primers. b. Sense and antisense transcripts levels by RT-qPCR from J2 immuno-selected dsRNA. Samples either untreated (grey bars), treated with V1 RNase (black bars) or S1 nuclease (white bars). All RT-qPCR values are average +/− SD from three to four biological repeats. c-e, g. ChIP analysis using Dicer, Ago1, G9a and HP1γ antibodies respectively. f. Ratio of H3K9me2 ChIP versus H3 on β-actin gene and centromere 9 (right panel). ChIP values +/− SD from three biological repeats.
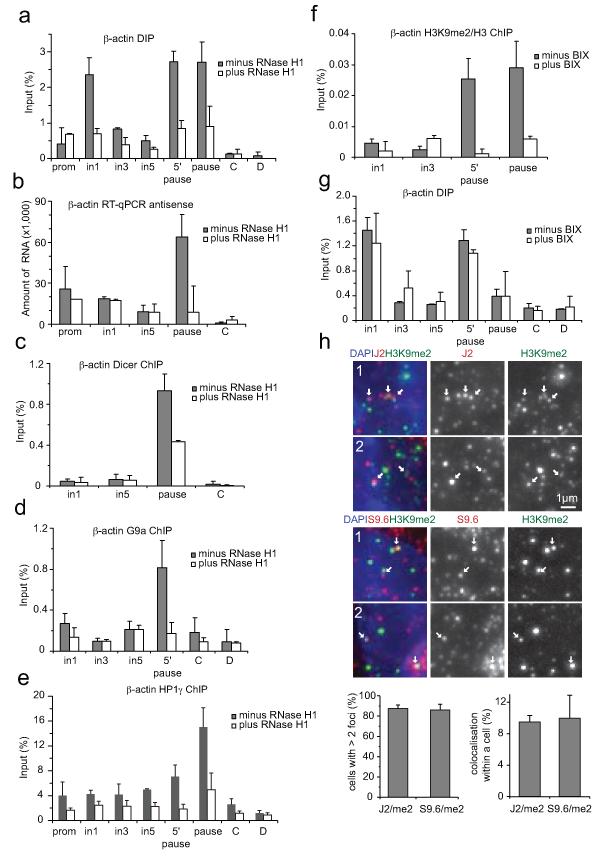
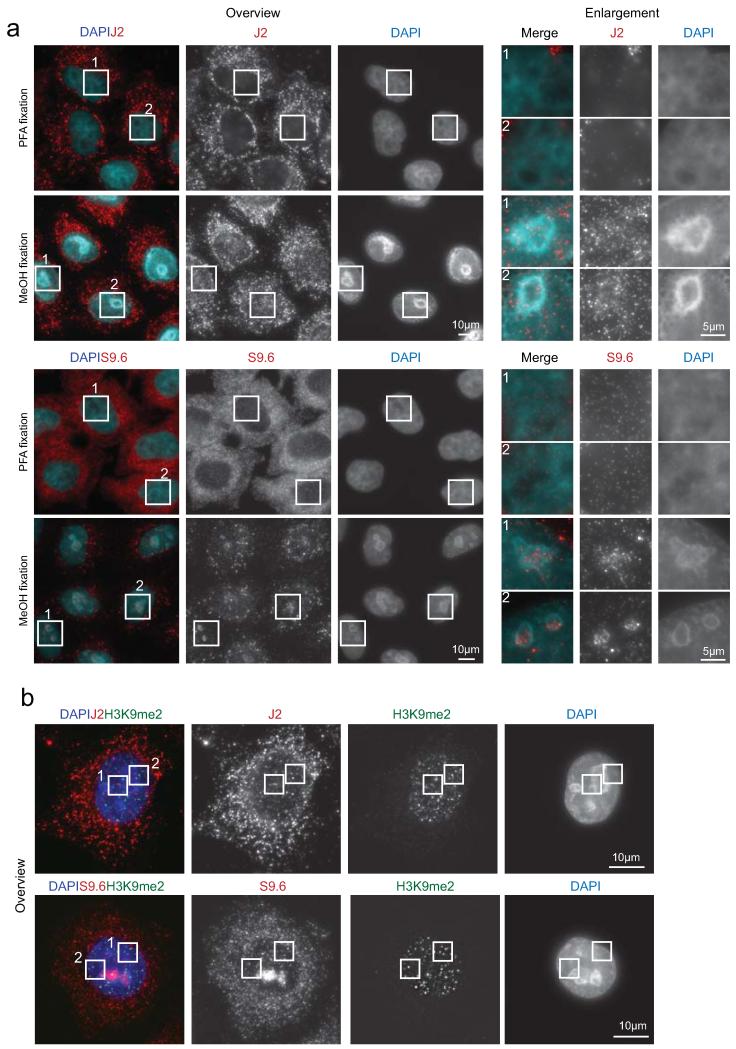
We investigated whether R-loops promote the recruitment of RNAi factors and H3K9me2 formation over the termination region of the β-actin gene by testing their sensitivity to RNase H1. Over-expression of this enzyme diminished R-loop levels over both gene body (intron 1 amplicon) and pause regions (Fig. 2a). Remarkably antisense RNA, Dicer, G9a and HP1γ occupancy were also diminished (Fig. 2b-e). To selectively remove the H3K9me2 repressive mark, we used the chemical inhibitor of G9a/GLP, BIX-01294 which induces transient reduction of H3K9me2 in mammalian chromatin17. BIX treatment decreased H3K9me2 signal over the 5′ pause and pause regions as compared to non-treated cells (Fig. 2f and Extended Data Fig. 1c). Finally, we investigated whether R-loops are the consequence or cause of H3K9me2 occurrence. Significantly, R-loop signals were unaffected by H3K9me2 reduction (Fig. 2g). This predicts that R-loops formed around the α-actin pause element trigger antisense transcription, assembly of the RNAi apparatus, the formation of an H3K9me2 repressive mark, and ultimately HP1γ recruitment. We confirmed the correlation of R-loops and dsRNA with H3K9me2 mark in single cells, using immunofluorescence. We first demonstrated the nuclear localisation of R-loops and dsRNA (Extended Data Fig. 3a). 90% of HeLa cell nuclei showed R-loops and dsRNA in close proximity with H3K9me2 foci. Interestingly 10% of either dsRNA or R-loop foci colocalised with H3K9me2 (Fig. 2h and Extended Data Fig. 3b). These data strongly suggest that at a cellular level, R-loops are associated with gene silencing.
Figure 2. Modulation of R-loop and G9a levels define mechanism of H3K9me2 formation on human α-actin terminator.
a. DIP with RNA:DNA hybrid antibody with/without RNase H1 over-expression. b. RT-qPCR with/without RNase H1 over-expression. c-e. ChIP analysis with/without RNase H1 over-expression using Dicer, G9a or HP1γ antibodies. f. H3K9me2 versus H3 ChIP values, +/− BIX treatment. g. DIP profile +/− BIX treatment. All ChIP and DIP values +/− SD from three biological repeats.h. Nuclear immunofluorescence of H3K9me2 with dsRNA (J2-top panel) and R-loops (S9.6-bottom panel). Arrows denote foci in close proximity. Whole cell images in Extended Data Fig. 3b. Cell numbers with >2 J2/H3K9me2 and S9.6/H3K9me2 foci (n=100) (lower left graph). Colocalising foci of J2 and S9.6 with H3K9me2 (n=1000), based on three independent experiments (lower right graph).
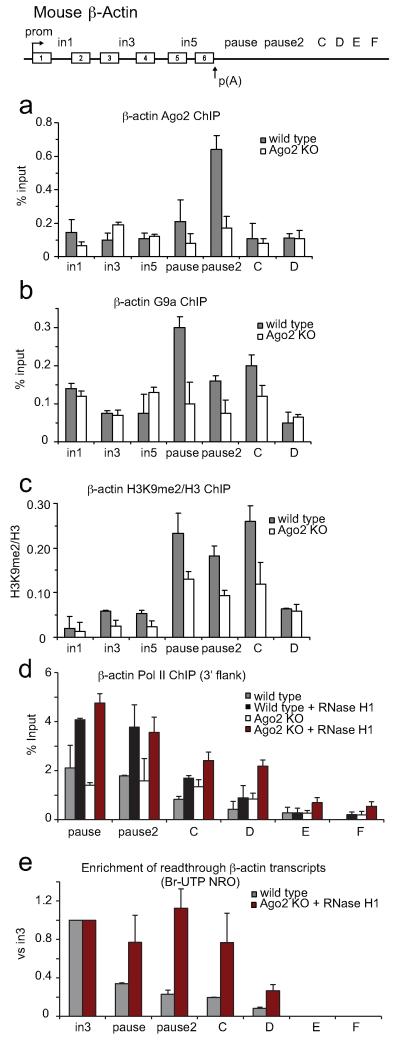
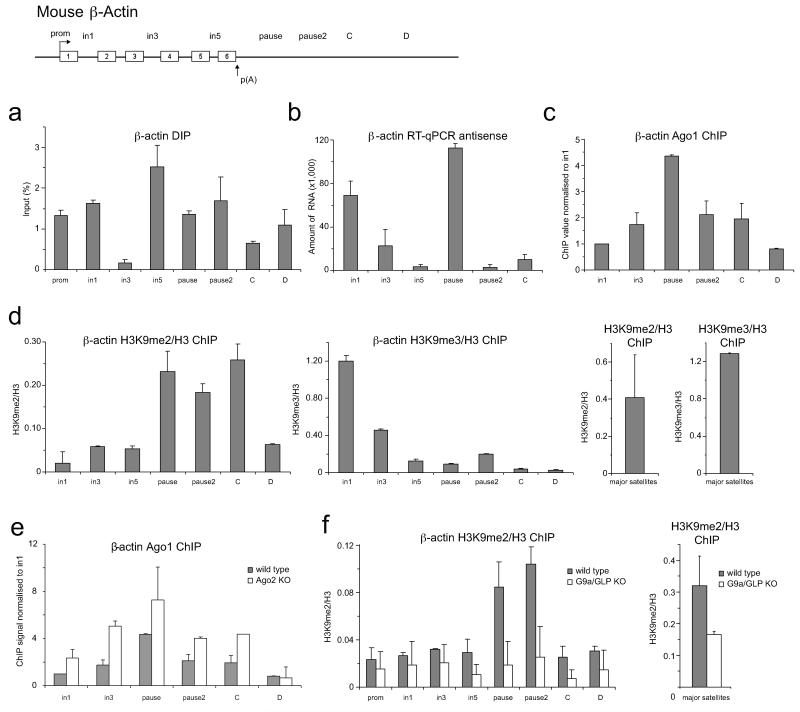
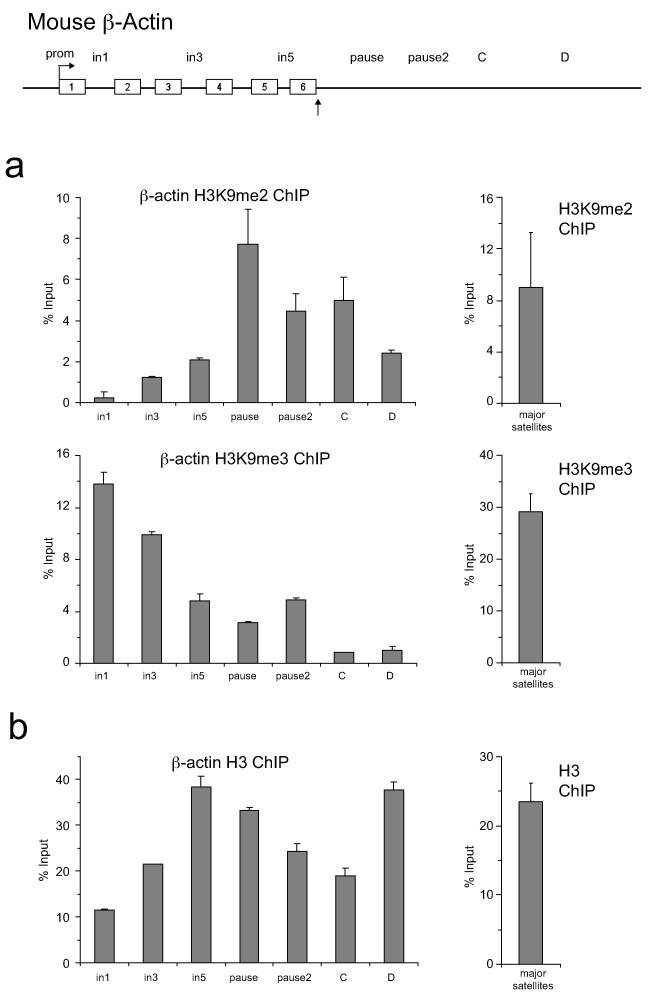
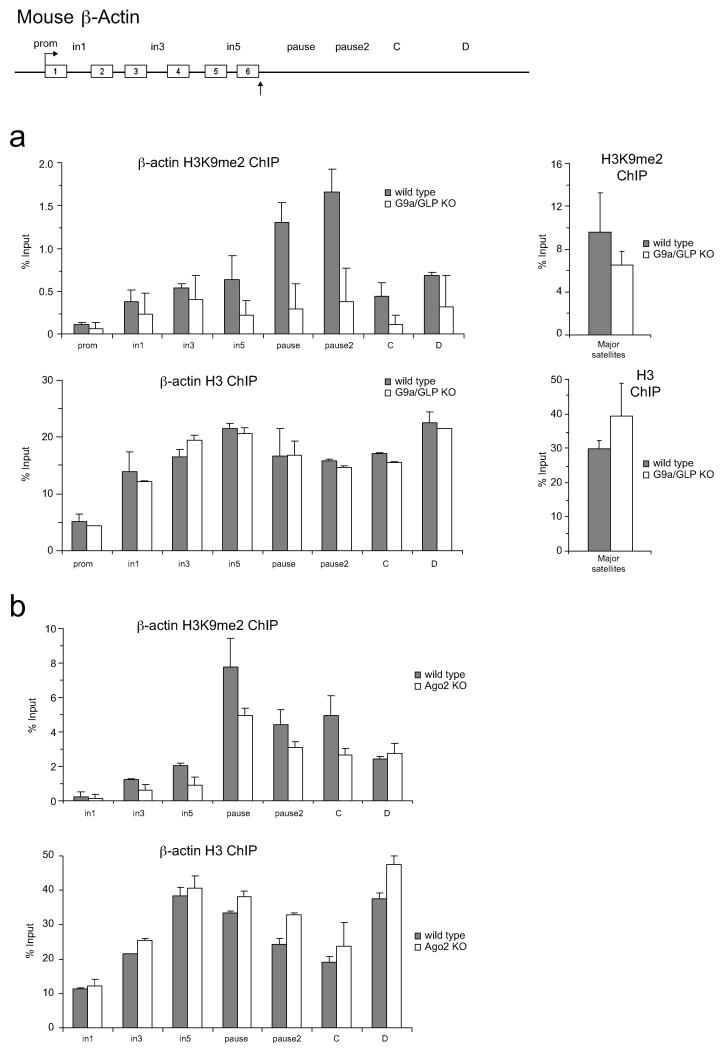
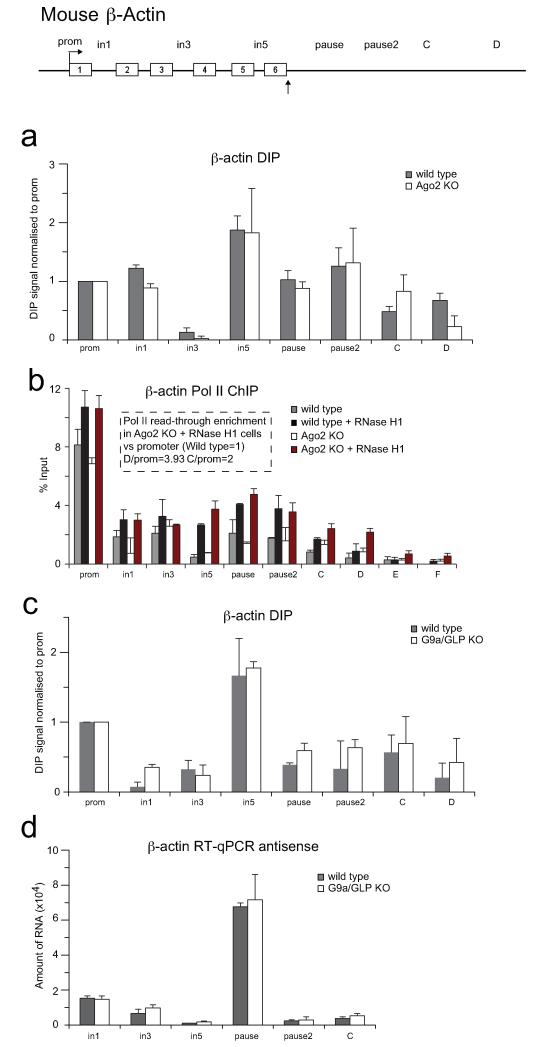
We next employed cell lines derived from mouse gene knock-outs (KO) for Ago2 and G9a/GLP factors to test their role in Pol II termination. We initially validated the data obtained with the human β-actin gene for its mouse homologue (Extended Data Figs. 4-6). Notably we observed that the repressive mark associated with the termination region of the mouse β-actin gene is specifically H3K9me2, and not H3K9me3 (Extended Data Fig. 4d). We then confirmed that Ago2, like Ago1, is specifically enriched at the termination region of mouse β-actin gene and its recruitment is reduced to background levels in Ago2 KO cells (Fig. 3a and Extended Data Fig. 4c). However Ago1 recruitment is enhanced in Ago2 KO cells, suggesting that Ago1 compensates for Ago2 depletion (Extended Data Fig. 4e). G9a (Fig. 3b) and H3K9me2 (Fig. 3c) ChIP analyses in Ago2 KO cells showed a decrease in ChIP signals over the gene termination region, suggesting that the observed H3K9me2 mark is Ago2-dependent. However the R-loop profile is Ago2-independent (Extended Data Fig. 7a), confirming that R-loops act upstream of the RNAi pathway. Similar results were obtained in G9a/GLP double KO cells (Extended Data Fig. 7c,d).
Figure 3. Ago2-dependent H3K9me2 mark and R-loop formation promote efficient termination on mouse β-actin gene.
a,b. ChIP in WT and Ago2 KO MEFs using Ago2 and G9a antibodies respectively. c. Ratio H3K9me2 versus H3 ChIP in WT and Ago2 KO MEFs. d. Pol II ChIP with probes downstream of the PAS with extended Y axis. in WT (grey bars), WT over-expressing RNase H1 (black bars), Ago2 KO (white bars) and Ago2 KO over-expressing RNase H1 (red bars) MEFs. Full gene profile in Extended Data Fig. 7b. All ChIP values +/− SD from three to four biological repeats. e. Br-UTP NRO analysis in WT (grey bars) and Ago2 KO MEFs over-expressing RNase H1 (red bars). Nascent Br-RNA over intron 3 probe set as 1. Fold of enrichment of read-through transcripts for pause, pause2 and C calculated relative to intron 3 signal. Values +/− SD from three biological repeats.
To investigate if both R-loops and H3K9me2 mark are needed for efficient transcriptional termination of mouse β-actin gene, we performed Pol II ChIP in wild type and Ago2 KO MEFs also over-expressing RNase H1. Pol II density increased especially over termination probes C and D, indicative of a defect in transcriptional termination (Fig. 3d, Extended data Fig. 7b). We also performed Br-UTP Nuclear Run-On (NRO) analysis (Fig. 3e) and detected significant enrichment of nascent read-through RNA signals over the termination region, relative to the gene body (intron 3 primer) in Ago2 KO cells over-expressing RNase H1, as compared to wild type cells. This suggests that R-loops and the H3K9me2 mark are both critical components of efficient pause-dependent Pol II termination. No nascent transcripts were detected over probes E and F, located 3.2 and 4 kilobases (kb) downstream of the PAS, suggesting that the effect of combined loss of H3K9me2 and R-loops promotes read-through transcription up to 3 kb downstream of the PAS.
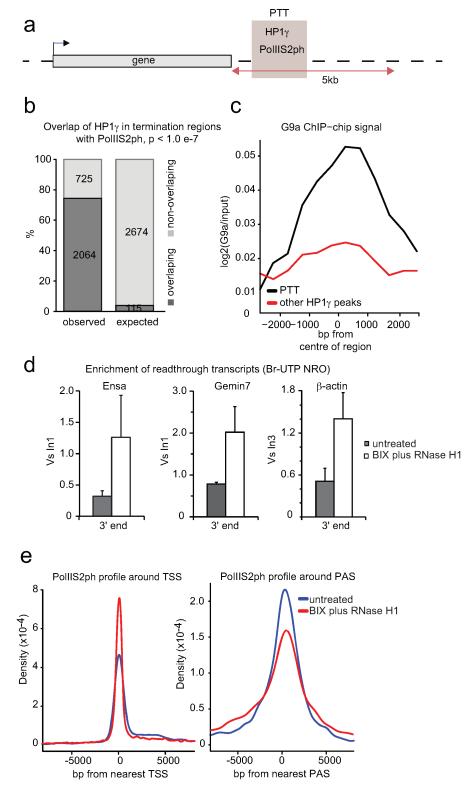
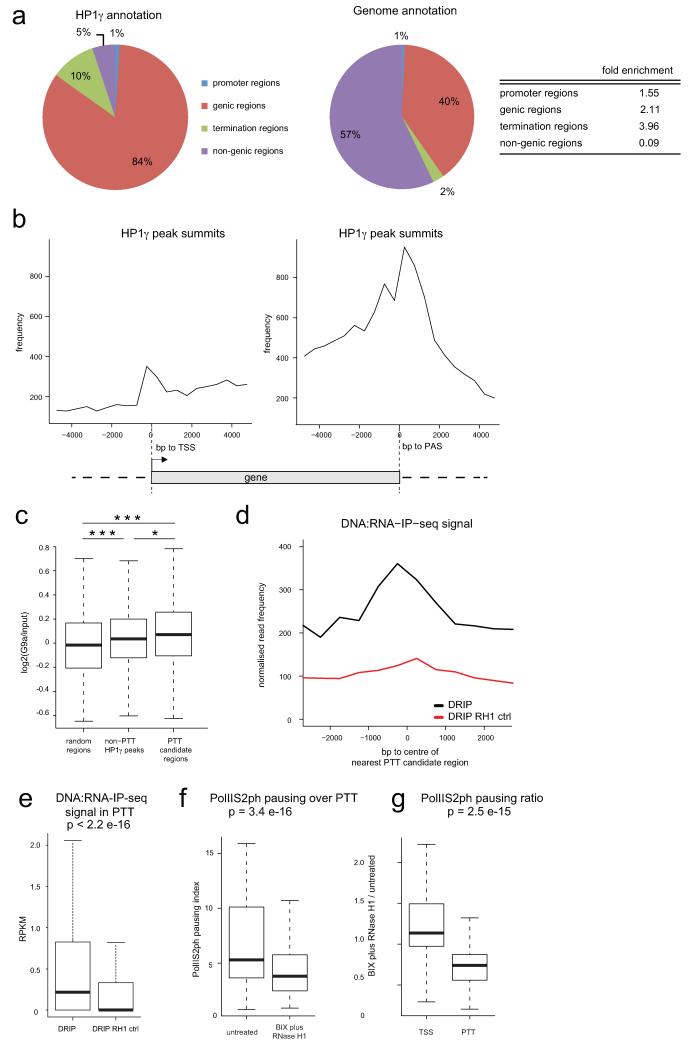
We considered the possibility that RNAi-mediated heterochromatin formation, induced by R-loop formation is a general termination mechanism at least for a subset of genes. We performed a genomic meta-analysis of ChIP-seq datasets to look for the coincidence of paused elongating form of Pol II phosphorylated on serine 2 of the CTD (PolIIS2ph, ENCODE18) with HP1γ enrichment15 within termination regions (Fig. 4a). We termed such regions of overlap pause-type termination (PTT) candidate regions. HP1γ was previously implicated in transcriptional elongation12-15. Indeed 84% of the summits of HP1γ peaks determined by ChIP-seq reside within gene bodies (Extended Data Fig. 8a15). However the highest-fold enrichment for HP1γ relative to genomic annotation is over termination regions and the highest density of HP1γ peak summits is detected downstream of PAS genome-wide (Extended Data Fig. 8a,b). Strikingly, 74% of HP1γ enriched regions in termination regions overlap with PolIIS2ph enrichment (Fig. 4b). PTT candidate regions show a statistically significant enrichment of G9a ChIP-chip signal19, both compared to randomly sampled genomic regions of the same size as well as to non-PTT HP1γ peaks (Fig. 4c and Extended Data Fig. 8c), implicating H3K9 methyltransferase activity at these locations. To investigate whether PTT candidate regions are associated with R-loop formation we compared the signal obtained by DNA:RNA-IP (DRIP) with DNA:RNA-IP treated with RNase H1 (DRIPRH1 control) from the previously published DRIP-seq data2. PTT candidate regions show a significant enrichment of DRIP signal as compared to DRIPRH1 (Extended Data Fig. 8d,e), implying R-loop formation over these regions. We conclude that PTTs associated with R-loops, G9a and HP1γ are widespread in the human genome.
Figure 4. HP1γ, G9a and R-loops are globally associated with PTT regions.
a. Diagram of pause-type termination (PTT) candidate regions. PTT candidate regions were defined as genomic intervals delineated by ChIP-seq peaks of PolIIS2ph (ENCODE18) overlapping with ChIP-seq peaks of HP1γ15 within termination regions (5 kb downstream of human RefSeq genes, not overlapping with any downstream gene or promoter). b. Bar graph displaying the observed (2064) and expected based on random sampling (115) overlap of HP1γ terminator peaks with PolIIS2ph peaks. c. G9a ChIP-chip profile over PTT candidate regions (black curve) and non-PTT associated HP1γ peaks (other HP1γ peaks, red curve). d. Br-UTP NRO analysis −/+ BIX treatment with RNase H1 over-expression on Ensa, Gemin7 and β-actin genes. -Fold of enrichment of read-through transcripts over gene 3′ end calculated relative to intronic signals (set as 1). Values +/− SD from three biological repeats. e. PolIIS2ph ChIP-seq enrichment profiles for untreated (blue curve) and BIX plus RNAse H1 (RH1) overexpression (red curve) in 15 kb regions over centre of TSS (left graph) and PAS (right graph).
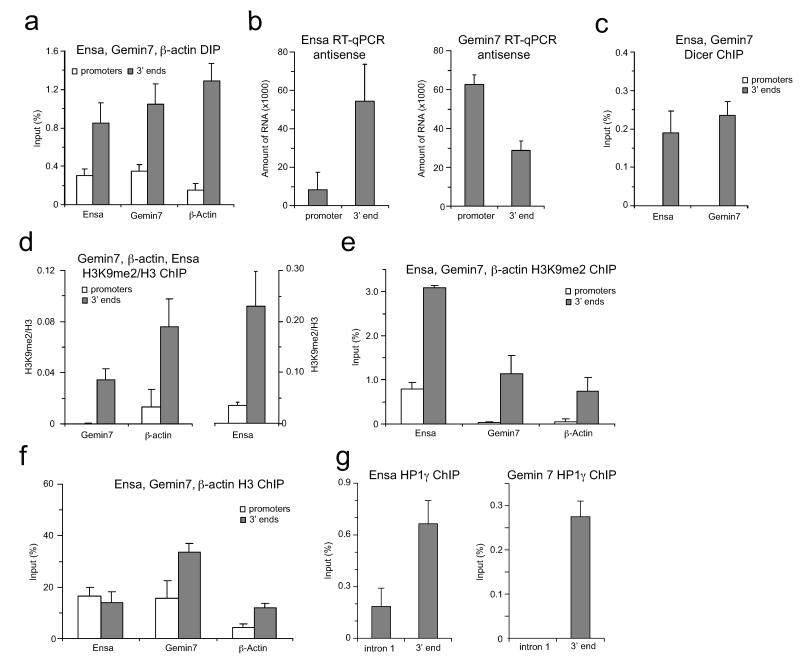
Two genes, Ensa and Gemin7, which show PolIIS2ph pausing coincident with HP1γ and DRIP-seq signal were used to validate our genomic analysis. R-loops, antisense transcription, Dicer, H3K9me2 and HP1γ was observed over their termination regions (Extended Data Fig. 9), similar to the β-actin terminator. Finally we performed Br-UTP NRO analysis following BIX treatment and RNase H1 over-expression on these non-actin genes again showing that their termination requires R-loops and H3K9me2 mark (Fig. 4d). The same effect was observed for human β-actin gene so validating the data obtained in mouse β-actin (Fig. 3d,e).
Finally to corroborate the role of R-loops and H3K9me2 on transcriptional termination genome-wide, we performed ChIP-seq using an antibody against PolIIS2ph on BIX-treated cells over-expressing RNase H1 and untreated cells. We observe a decrease in PolIIS2ph accumulation in the vicinity of PAS in the BIX RH1 sample versus the untreated sample (Fig. 4e, right panel). However an increase in PolIIS2ph accumulation around the transcription start site (TSS) is detected in the BIX RH1 sample versus the untreated condition (Fig. 4e, left panel). We then calculated the PolIIS2ph pausing index in PTT candidate regions relative to gene bodies and observed that the BIX RH1 sample shows a significantly lower value compared to the untreated (p=3.398e-16, Extended data Fig. 8f). This implies that efficient pausing in these locations depends on the presence of R-loops and H3K9me2. In contrast, PolIIS2ph pausing around TSS concurrently increases in BIX RH1 condition (Fig. 4e and Extended data Fig. 8g) suggesting that termination and promoter pausing mechanisms are distinct. This is consistent with the specific enrichment of Dicer, H3K9me2 and HP1γ over gene 3′ ends, but not promoter regions, of β-actin, Ensa and Gemin7 (Fig. 1f,g, Extended Data Fig. 9c,d,e). Overall we demonstrate that a termination mechanism mediated by Pol II pausing dependent on R-loop induced heterochromatin is shared by a subset of human genes.
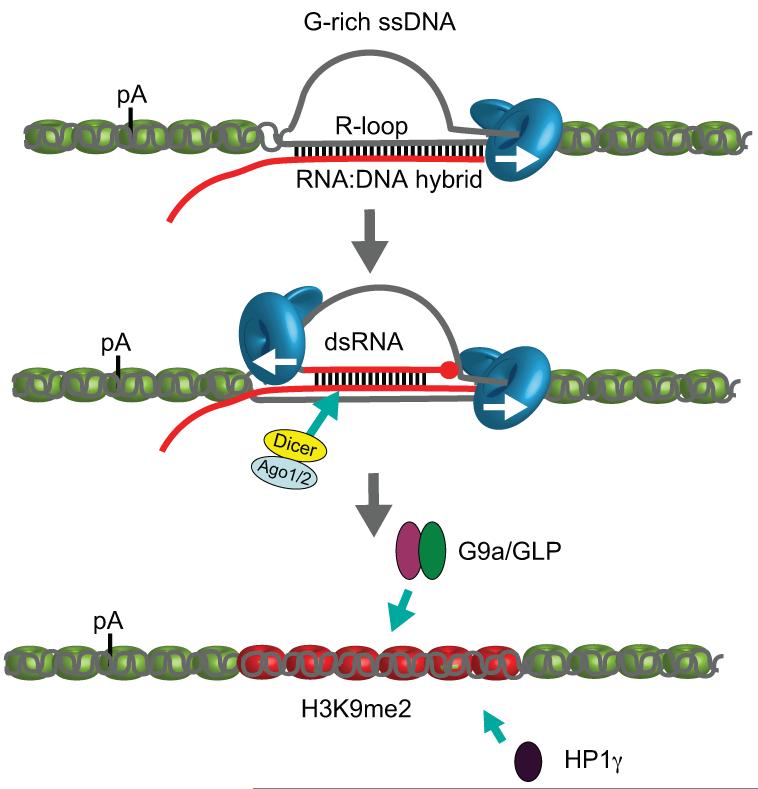
We reveal a molecular link between R-loop structures and the RNAi pathway. In particular we have uncovered an unanticipated mechanism of regulated transcriptional termination through combined R-loops over pause-type 3′ ends and epigenetic features. Our results predict a model for Pol II termination where G-rich sequence promotes R-loop formation leading to heterochromatin establishment through the synthesis of localised dsRNA and RNAi factors recruitment (Extended Data Fig. 10). Previous studies14,20 support a functional association between histone marks, Pol II pausing and pre-mRNA processing. We now reveal that chromatin regulation at the level of transcriptional termination is mediated by the formation of R-loops. This raises the intriguing possibility that R-loops, a natural outcome of the transcription process may more widely induce the formation of repressive chromatin marks to promote Pol II pausing.
Methods
Molecular and cell biology techniques
Transfections of GFP-RNase H1 plasmid into human HeLa and mouse embryonic fibroblasts (MEF) cells were carried out as described previously4. Ago2 KO and parental wild type cells are MEFs. G9a/GLP double KO and their parental wild type are mouse embryonic stem (mES) cells. Treatment with 10 μM of BIX-01294 inhibitor (Sigma) was performed as described20. Total RNA was isolated using TRIzol reagent (Invitrogen) and reverse transcribed with SuperScript III Reverse Transcriptase (Invitrogen) using gene-specific primers. J2 dsRNA pull-down was performed as described8. RT-qPCR levels are presented graphically as raw values x1000. Chromatin immuno-precipitation (ChIP) and genomic DNA immuno-precipitation (DIP) analyses were carried out as before4. The following antibodies were used for ChIP: anti-H3K9me2 (Abcam), anti-H3K9me3 (Abcam), anti-H3 (Abcam), anti-Dicer (13D6) (Abcam), anti-KMT1C/G9a (Abcam), anti-Ago1 (Millipore), anti-Ago2 (Abcam) and anti-Pol II (H-224) (Santa Cruz Biotechnology). S9.6 RNA:DNA hybrid specific antibody was used for DIP4
Genomic analysis
Genomic interval processing, overlap calculations, statistical analysis and occupancy profiles were performed using custom scripts within the R/Bioconductor environment21.
The following publicly available human datasets were used: G9a ChIP-chip (GSE2448019), Pol II ChIP-seq: ENCODE defined enriched regions (narrow peak) for HeLa-S3 using the phosphoS2 Pol II antibody ab5095 (GSE3147718), HP1γ ChIP-seq (GSE2811515) as well as R-loop locations delineated by DRIP-seq (SRA048940.12).
In order to obtain the HP1γ peaks coordinates, the mapped read coordinates were first lifted over from hg18 to hg19 using bedtools. The ChIP reads from two biological experiments GSM699727 and GSM699729 were pooled, as well as their corresponding input reads GSM699728 and GSM801616. The pooled ChIP and input raw reads were then used as input for peak calling using MACS2 with q=0.05.
For genomic annotation, the coordinates of human hg19 RefSeq genes were downloaded from UCSC table browser22 on 31.08.2012, and are synonymous with gene bodies throughout the manuscript. Promoter regions were defined as regions 1 kb upstream of RefSeq genes, excluding parts of intervals overlapping with any gene body. Terminator regions were defined as regions 5 kb downstream of genes, excluding regions showing any overlap with gene bodies or promoters. As the only exception, for more accurate HP1γ peak summit annotation (Extended Data Fig. 8a) a less stringent filtering approach for termination regions has been applied: in case of partial overlap of the 5 kb downstream region with a gene body or promoter, the non-overlapping sequence interval has been retained.
To calculate the p-value of the overlap between terminator HP1γ peaks and PolIIS2ph peaks (Fig. 4b) 107 random data sets have been generated based on PolIIS2ph peaks and none of them had the same number or more overlaps than the original data set, hence p-value < 107. The average number of overlaps in the random data sets was 115.
PTT candidate regions have been computed as genomic intervals corresponding to those ENCODE-defined PolIIS2ph peaks or their fragments that reside within termination regions, and show a minimum 1 bp overlap with a HP1γ peak15.
In order to obtain G9a, DRIP and HP1γ occupancy profiles, their distance to the feature of interest was computed, and only retained if <5 kb. Plotted is the frequency in 500 bp bins. In case of G9a ChIP-chip data the average log2 (G9a/input) signal was computed in 500 bp bins and subject to filtering using moving average over 6 bins before plotting. Deep sequencing of PolIIS2ph ChIP and input from BIX RH1 treated and untreated HeLa cells has been performed by the EMBL Genomics Core Facility in Heidelberg, Germany. The two ChIP and two input samples have been multiplexed, using NEBNext ChIP-Seq master-mix kit to prepare the libraries. The samples have been sequenced on a 50 bp single-end run on 3 lanes using the Illumina HiSeq 2000 platform. Alignment of the sequenced tags to the hg19 human genome was performed using the CASAVA pipeline 1.8.2, ELAND parameters were: unique matches, 32 base seed, 2 mismatches allowed. This yielded a total of 115.813.632 reads uniquely aligned to hg19 for the untreated IP sample, 126.051.048 for the BIX RH1 treated sample, 127.749.851 for the untreated input and 113.690.799 for the BIX RH1 treated input.
Peak calling has been performed on the IP samples vs. their input controls using MACS2 with the parameters:
This procedure delineated 2046 PolIIS2ph peaks (enriched regions) for the untreated sample and 7712 peaks for the BIX RH1 treated sample. We noted that the BIX RH1 treatment resulted in a higher overall PolIIS2ph enrichment, presumably reflecting a globally more open chromatin environment following the treatment. Therefore, to avoid potential bias we chose to base our analysis on pausing indices relative to gene body signal (see below).
In order to obtain the PolIIS2ph enrichment profiles over the TSS and PAS (Fig. 4e), the distance of the PolIIS2ph peaks to the nearest TSS (or PAS) was computed retaining only distances <10 kb away from the feature of interest, which were then subject to kernel density estimation using the Gaussian smoothing kernel and plotted.
We defined the PTT PolIIS2ph pausing index as a ratio of the normalized read density in PTT candidate regions to the normalized read density in its corresponding gene body. In more detail, we first re-computed the PTT candidate regions using the PolIIS2ph peaks found in the untreated sample in place of the ENCODE-dataset-derived peaks, and their corresponding gene body coordinates were extracted. The IP and input read number overlapping with each PTT and its corresponding gene body were counted and the IP and input RPKM read density for each region were computed as follows:
The RPKM value for input reads were then subtracted from the RPKM value for the IP reads for each region to yield the final normalized read density (NRD) for each region. Genes with low PolIIS2ph NRD over their gene body (NRD<0.1) were considered inactive and excluded from downstream analysis. The pausing index (PI) of each PPT/gene body pair was then computed as: PIPPT= NRDPPT/NRDgene_body
The pausing index for regions surrounding the TSSs of the PTT-linked genes by +-1 kb was computed analogously: PITSS = NRDTSS+-1kb/NRDgene_body
Those computations were done in parallel for the BIX RH1 and untreated sample, and finally the distribution of the -fold change in PolIIS2ph pausing index between the BIX RH1 and untreated samples was calculated.
For statistical tests, since the data in Extended Data Fig. 8c,e-g did not conform to normal distribution, non-parametric tests were employed: Wilcoxon signed-rank test for the paired samples in Extended Data Fig. 8e,f and Wilcoxon-Mann-Whitney for the unpaired samples in Extended Data Fig. 8c,g. In all cases two-sided tests were applied.
Data access
The sequencing data for PolIIS2ph ChIP and input from BIX RH1 treated and untreated HeLa cells are deposited in GEO under the accession number GSE59878.
Immunofluorescence/imaging analysis
Fixed cells samples were prepared and imaged exactly as described23. In summary, cells grown on coverslips were fixed with 2 ml of ice cold methanol or 3% paraformaldehyde in PBS for 15 min. Cells were quenched with 2 ml of 50 mM NH4Cl in PBS for 10 min. Coverslips were washed three times in 2 ml PBS before permeabilization in 0.2% Triton X-100 for 5 min. In all cases primary and secondary antibody staining was performed in PBS for 60 min at room temperature. S9.6 antibody was used in 1:250 dilution, whereas commercial H3K9me2 (Cell Signaling) and J2 (Scicon) antibodies were used as directed by the manufacturers. DAPI was added to the secondary antibody staining solution at 0.3 μg/ml. Coverslips were mounted in Mowiol 4-88 mounting medium (EMD Millipore). Fixed samples on glass slides were imaged using a 60×/NA 1.35 oil immersion objective on an upright microscope (BX61; Olympus) with filtersets for DAPI; GFP/Alexa Fluor 488, 555, 568, and 647 (Chroma Technology Corp.), a CoolSNAP HQ2 camera (Roper Scientific) and MetaMorph 7.5 imaging software (Molecular Dynamics, Inc.). Colocalisation foci were measured as foci <200nm apart.
J2 dsRNA pull-down
J2 antibody (Scicon, 10010200, diluted to 0.1 μg/1 μg of chromatin) was incubated with total cell extracts for 1.5 hr on a rotating wheel at 4 °C. Protein G-agarose beads (Millipore) were then added for an additional 1.5 hr. dsRNA was then isolated from washed beads using the TRIzol reagent (Invitrogen) and analysed by RT-qPCR for sense and antisense transcripts. Signals from immuno-precipitated samples were subtracted from signals arising from non-precipitated samples. V1 and S1 treatments were carried out for 2 hr at 37 °C after the dsRNA isolation.
Extended Data
ED Figure 1. H3K9me2 and H3 levels over human β-actin gene.
a. Left panel: H3K9me2 ChIP on β-actin gene. Right panel: H3K9me2 ChIP analysis on human centromere 9 (positive control). b. Left panel: H3 ChIP on β-actin gene. Right panel: H3 ChIP analysis on human centromere 9. c. Left panel: H3K9me2 ChIP +/− BIX treatment. Right panel: H3 ChIP +/− BIX treatment. ChIP values are +/− SD from three biological repeats.
ED Figure 2. R-loops and H3K9me2 repressive mark are not specifically enriched over the CoTC terminators of human Cyclin B1 and Akirin 1 genes.
a. DIP on endogenous Cyclin B1 and Akirin 1 genes. No detection of R-loops was observed over their CoTC terminators. Human β-actin gene was used as a positive control. For Cyclin B1 and Akirin 1 genes, 3′ end 1 and 3′ end 2 amplicons amplify two different regions within the CoTC terminator of each gene. 3′ end 1 and 3′ end 2 amplicons for β-actin gene amplify the 5′ pause and pause amplicons, respectively. b. Ratio of H3K9me2 signal over the 3′ ends versus intron 3 signal in Cyclin B1, Akirin 1 and β-actin human genes. DIP and ChIP values are +/− SD from three biological repeats.
ED Figure 3. Cellular localisation of R-loops, dsRNA and H3K9me2.
a. Immunofluorescence imaging of dsRNA (J2 antibody) and R-loops (S9.6 antibody), using paraformaldehyde (PFA) and methanol (MeOH) as fixing reagents. Fixation with methanol allowed visualisation of R-loops and dsRNA in HeLa cell nuclei. Enlarged boxes (1 and 2) shown in right panels. b. Whole cell images showing immunofluorescence of H3K9me2 with dsRNA (J2-top panel) and R-loops (S9.6-bottom panel). Enlarged versions (1 and 2) are shown in Fig. 2h.
ED Figure 4. R-loops and RNAi promote H3K9me2 mark over mouse β-actin terminator.
a. DIP performed on mouse β-actin gene in MEFs. b. RT-qPCR of total RNA from MEF cells on β-actin gene to detect antisense transcripts with region-specific forward primers. Average RT-qPCR values are +/− SD from four biological repeats. c. Ago1 ChIP performed on mouse β-actin gene in MEFs. ChIP signal is normalised to intron 1 signal. d. Left panel: Ratio of H3K9me2 ChIP signal versus H3 on mouse β-actin in MEFs. Middle panel: Normalised H3K9me3 to total H3 levels. Right panel: Ratio of H3K9me2 and H3K9me3 signal versus H3 signal on major satellites in MEFs. e. Ago1 ChIP in wild type (grey bars) and Ago2 KO (white bars) cells. Ago1 recruitment over mouse β-actin is enhanced upon Ago2 depletion. f. Left panel: Ratio of H3K9me2 ChIP signal versus total H3 on β-actin gene in wild type and G9a/GLP KO mouse ES cells. Right panel: H3K9me2/H3 ratio on the mouse major satellites in wild type and G9a/GLP KO cells. Average ChIP and DIP values are +/− SD from three biological repeats.
ED Figure 5. H3K9me2, H3K9me3 and H3 levels over the endogenous mouse β-actin gene.
a. H3K9me2 and H3K9me3 ChIP on mouse β-actin gene in MEF cells. Right panel: H3K9me2 and H3K9me3 ChIP on mouse major satellites (positive control). b. Total H3 ChIP on mouse β-actin gene. Major satellites were used as a positive control. ChIP values are +/− SD from three biological repeats.
ED Figure 6. H3K9me2 and H3 levels over mouse β-actin gene in G9a/GLP double KO mouse ES cells and Ago2 KO MEFs.
a. Top and bottom panels: H3K9me2 and H3 ChIP performed on mouse β-actin gene in wild type and G9a/GLP double KO ES cells. H3K9me2 occupancy depends on presence of G9a/GLP HKMTs. Right panels: H3K9me2 and H3 ChIP performed on mouse major satellites in wild type and G9a/GLP KO cells. b. ChIP analyses using H3K9me2 (top panel) and H3 (bottom panel) antibodies performed on mouse β-actin gene in wild type and Ago2 KO cells. ChIP values are +/− SD from three biological repeats.
ED Figure 7. R-loop formation and antisense transcription are Ago2 and G9a/GLP-independent.
a-c DIP performed on mouse β-actin gene in wild type, Ago2 KO (a) and G9a/GLP KO (c) cells. b. Pol II ChIP in wild type (grey bars), wild type over-expressing RNase H1 (black bars), Ago2 KO (white bars) and Ago2 KO over-expressing RNase H1 (red bars) MEFs. Hatched box quantifies Pol II read-through transcription versus promoter signal. d. RT-qPCR analysis of total RNA from wild type and G9a/GLP KO cells for the mouse β-actin gene. RT reaction was performed with specific forward primers. Average DIP and RT-qPCR values are +/− SD from three biological repeats.
ED Figure 8. HP1γ, G9a and R-loops are globally associated with paused Pol II over pause-type termination regions (PTTs).
a. Genomic annotation of HP1γ based on ChIP-seq peaks summit localization (HP1γ annotation, pie chart on the left) and the fold enrichment of HP1γ over the indicated genomic regions (table on the right) as compared to their bp coverage in the human genome (genome annotation, pie chart in the middle). Genic regions have been defined by RefSeq gene coordinates (hg19). Promoter regions were defined as regions 1 kb upstream of RefSeq gene TSS excluding intervals overlapping with any genic regions. Termination regions were defined as regions 5 kb downstream of RefSeq genes excluding intervals overlapping with any genic region or promoter. b. HP1γ ChIP-seq enrichment profile in 10 kb regions surrounding the TSS (left graph) and PAS (right graph). HP1γ peaks summits frequency are plotted in 500 bp bins.c. Box plot showing the average log2 (G9a/input) ChIP-chip signal distribution in PTT candidate regions (right box), randomly sampled regions of the same size and number as PTT candidate regions (random regions, left box), and in HP1γ peaks outside of PTT candidate regions (non-PTT HP1γ peaks, middle box). In all box plots the horizontal line in the box shows the median, the lower and upper limits of the box show respectively the first and third quartile, and the whiskers extend to the non-outlier extreme data points. The log2 (G9a/input) signal is significantly higher in the PTT candidate regions compared to random regions (p=0.0001067) as well as compared to non-PTT HP1γ peaks (p=0.02213). The log2 (G9a/input) signal is also significantly higher in non-PTT HP1γ peaks compared to random regions (p=0.0.0009337). The Wilcoxon-Mann-Whitney test has been applied in all cases. d. DRIP-seq profile over centre of PTT candidate regions. Read frequencies of DNA:RNA-IP sample (DRIP, black curve) are plotted and DNA:RNA-IP sample treated with RNase H1 (DRIP RH1, red curve) in 500 bp bins, both normalized to million mapped reads. e. Box plot showing DRIP-seq2 read density (RPKM) of DNA:RNA-IP (DRIP) sample compared with DRIP sample treated with RNase H1 (DRIP RH1 control) in PTT candidate regions. P<2.2e-16 determined by Wilcoxon signed-rank test. Horizontal line in the box shows median, box lower and upper limit show first and third quartile, whiskers extend to non-outlier extreme data points. f. Box plot of PolIIS2ph pausing index over PTTs (relative to gene bodies) in the BIX RH1 sample (right) with the untreated sample (left). P=3.398e-16 using Wilcoxon signed-rank test. g. Box plot displaying ratio of PolIIS2ph pausing index in the BIX RH1 to untreated sample in TSS regions (+/−1 kb, left) and in PTT regions (right). P=2.468e−15 using Wilcoxon-Mann-Whitney test.
ED Figure 9. Ensa and Gemin7 share features of R-loop mediated pause-type termination.
a. DIP on Ensa and Gemin7 genes. R-loops specifically enriched over 3′ ends (grey bars), compared to promoter regions (white bars). Human β-actin gene is positive control. Values +/− SD for three biological repeats. b. RT-qPCR of total RNA from HeLa cells performed on indicated gene. RT reaction was performed with promoter or 3′ end-specific forward primer to detect antisense transcript. Average RT-qPCR values are +/− SD from four biological repeats. c. Dicer ChIP of Ensa and Gemin7 genes over promoters and termination regions. d. Left panel: Ratio of H3K9me2 ChIP signal versus H3 on Gemin7 and β-actin genes. Right panel: Ratio of H3K9me2 signal versus H3 on Ensa gene. e,f. H3K9me2 and H3 ChIP for Ensa and Gemin7 genes over promoter (white bars) and pause terminators (grey bars). β-actin gene was used as a positive control. g. HP1γ ChIP for Ensa and Gemin7 genes over intronic and 3′ end regions. ChIP values are +/− SD from three biological repeats.
ED Figure 10. Model for how R-loops and RNAi-dependent H3K9me2 chromatin mediate pause-dependent transcriptional termination in mammalian genes.
Mammalian genes possessing pause elements downstream of their PAS form R-loops in termination regions. This facilitates generation of an antisense transcript that hybridises with the sense transcript to form dsRNA. This triggers recruitment of the RNAi factors, Dicer, Ago1 and Ago2. G9a/GLP HKMTs and HP1γ are then recruited forming and maintaining H3K9me2 repressive marks. R-loops and H3K9me2 facilitate Pol II pausing prior to termination. DNA is shown as grey lines and RNA as a red line. Points of contact between the DNA strand and nascent RNA indicates R-loop formation, whereas points of contact between sense and antisense RNA indicate dsRNA formation. Pol II is shown as a blue icon with arrow indicating transcription direction. Nucleosomes are shown in green except over H3K9me2 region where they are coloured red.
Acknowledgements
This work was supported by a Wellcome Trust Programme grant (091805/Z/10/Z) and a European Research Council Advanced grant (339270-polyloop) to N.J.P. and a Marie Curie Actions grant from EU FP7 (REA grant agreement, 327985) to K.K.-G. We are grateful to Ricardo Nunes Bastos (Department of Biochemistry, University of Oxford, UK) for valuable help with immunofluorescence/imaging analysis and figure formatting. We also thank Qianwen Sun (JIC, Norwich, UK) for helpful discussions and advice. We thank R. J. Crouch (NIH, Bethesda, Maryland, USA) for the gift of GFP-RNase H1 expression plasmid, G. Hannon (CSHL, USA) for the Ago2 KO mouse cell line and Y. Shinkai (Kyoto University, Japan) for the G9a/GLP double KO mouse ES cells.
References
- 1.Aguilera A, Garcia-Muse T. R loops: from transcription byproducts to threats to genome stability. Mol Cell. 2012;46:115–124. doi: 10.1016/j.molcel.2012.04.009. [DOI] [PubMed] [Google Scholar]
- 2.Ginno PA, Lott PL, Christensen HC, Korf I, Chedin F. R-loop formation is a distinctive characteristic of unmethylated human CpG island promoters. Mol Cell. 2012;45:814–825. doi: 10.1016/j.molcel.2012.01.017. [DOI] [PMC free article] [PubMed] [Google Scholar]
- 3.Ginno PA, Lim YW, Lott PL, Korf I, Chedin F. GC skew at the 5′ and 3′ ends of human genes links R-loop formation to epigenetic regulation and transcription termination. Genome Res. 2013 doi: 10.1101/gr.158436.113. [DOI] [PMC free article] [PubMed] [Google Scholar]
- 4.Skourti-Stathaki K, Proudfoot NJ, Gromak N. Human senataxin resolves RNA/DNA hybrids formed at transcriptional pause sites to promote Xrn2-dependent termination. Mol Cell. 2011;42:794–805. doi: 10.1016/j.molcel.2011.04.026. [DOI] [PMC free article] [PubMed] [Google Scholar]
- 5.Nakama M, Kawakami K, Kajitani T, Urano T, Murakami Y. DNA-RNA hybrid formation mediates RNAi-directed heterochromatin formation. Genes Cells. 2012;17:218–233. doi: 10.1111/j.1365-2443.2012.01583.x. [DOI] [PubMed] [Google Scholar]
- 6.Gullerova M, Proudfoot NJ. Cohesin complex promotes transcriptional termination between convergent genes in S. pombe. Cell. 2008;132:983–995. doi: 10.1016/j.cell.2008.02.040. [DOI] [PubMed] [Google Scholar]
- 7.Zofall M, Fischer T, Zhang K, Zhou M, Cui B, Veenstra TD, Grewal SI. Histone H2A.Z cooperates with RNAi and heterochromatin factors to suppress antisense RNAs. Nature. 2009;461:419–422. doi: 10.1038/nature08321. [DOI] [PMC free article] [PubMed] [Google Scholar]
- 8.Schönborn J, Oberstrass J, Breyel E, Tittgen J, Schumacher J, Lukacs N. Monoclonal antibodies to double-stranded RNA as probes of RNA structure in crude nucleic acid extracts. Nucleic Acids Res. 1991;19:2993–3000. doi: 10.1093/nar/19.11.2993. [DOI] [PMC free article] [PubMed] [Google Scholar]
- 9.Jenuwein T. The epigenetic magic of histone lysine methylation. FEBS J. 2006;273:3121–3135. doi: 10.1111/j.1742-4658.2006.05343.x. [DOI] [PubMed] [Google Scholar]
- 10.Tachibana M, Ueda J, Fukuda M, Takeda N, Ohta T, Iwanari H, Sakihama T, Kodama T, Hamakubo T, Shinkai Y. Histone methyltransferases G9a and GLP form heteromeric complexes and are both crucial for methylation of euchromatin at H3-K9. Genes Dev. 2005;19:815–826. doi: 10.1101/gad.1284005. [DOI] [PMC free article] [PubMed] [Google Scholar]
- 11.Rice JC, Briggs SD, Ueberheide B, Barber CM, Shabanowitz J, Hunt DF, Shinkai Y, Allis CD. Histone methyltransferases direct different degrees of methylation to define distinct chromatin domains. Mol Cell. 2003;12:1591–1598. doi: 10.1016/s1097-2765(03)00479-9. [DOI] [PubMed] [Google Scholar]
- 12.Vakoc CR, Mandat SA, Olenchock BA, Blobel GA. Histone H3 lysine 9 methylation and HP1gamma are associated with transcription elongation through mammalian chromatin. Mol Cell. 2005;19:381–391. doi: 10.1016/j.molcel.2005.06.011. [DOI] [PubMed] [Google Scholar]
- 13.Mateescu B, Bourachot B, Rachez C, Ogryzko V, Muchardt C. Regulation of an inducible promoter by an HP1beta-HP1gamma switch. EMBO Rep. 2008;9:267–272. doi: 10.1038/embor.2008.1. [DOI] [PMC free article] [PubMed] [Google Scholar]
- 14.Saint-André V, Batsché E, Rachez C, Muchardt C. Histone H3 lysine 9 trimethylation and HP1γ favor inclusion of alternative exons. Nat Struct Mol Biol. 2012;18:337–344. doi: 10.1038/nsmb.1995. [DOI] [PubMed] [Google Scholar]
- 15.Smallwood A, Hon GC, Jin F, Henry RE, Espinosa JM, Ren B. CBX3 regulates efficient RNA processing genome-wide. Genome Res. 2012;22:1426–1436. doi: 10.1101/gr.124818.111. [DOI] [PMC free article] [PubMed] [Google Scholar]
- 16.Nojima T, Dienstbier M, Murphy S, Proudfoot NJ, Dye MJ. Definition of RNA Polymerase II CoTC Terminator Elements in the Human Genome. Cell Rep. 2013 doi: 10.1016/j.celrep.2013.03.012. doi: 10.1016/j. [DOI] [PMC free article] [PubMed] [Google Scholar]
- 17.Kubicek S, et al. Reversal of H3K9me2 by a small-molecule inhibitor for the G9a histone methyltransferase. Mol Cell. 2007;25:473–481. doi: 10.1016/j.molcel.2007.01.017. [DOI] [PubMed] [Google Scholar]
- 18.Rosenbloom KR, et al. ENCODE Data in the UCSC Genome Browser: year 5 update. Nucleic Acids Res. 2012 doi: 10.1093/nar/gks1172. doi: 10.1093/nar/gks1172. [DOI] [PMC free article] [PubMed] [Google Scholar]
- 19.Frietze S, O’Geen H, Blahnik KR, Jin VX, Farnham PJ. ZNF274 recruits the histone methyltransferase SETDB1 to the 3′ ends of ZNF genes. PLoS One. 2010 doi: 10.1371/journal.pone.0015082. [DOI] [PMC free article] [PubMed] [Google Scholar]
- 20.Allo M, Buggiano V, Fededa JP, Petrillo E, Schor I, de la Mata M, Agirre E, Plass M, Eyras E, Elela SA, Klinck R, Chabot B, Kornblihtt AR. Control of alternative splicing through siRNA-mediated transcriptional gene silencing. Nat Struct Mol Biol. 2009;16:717–724. doi: 10.1038/nsmb.1620. [DOI] [PubMed] [Google Scholar]
Extended Data References
- 21.Gentleman RC, et al. Bioconductor: open software development for computational biology and bioinformatics. Genome Biol. 2004;5:R80. doi: 10.1186/gb-2004-5-10-r80. [DOI] [PMC free article] [PubMed] [Google Scholar]
- 22.Karolchik D, et al. The UCSC Table Browser data retrieval tool. Nucleic Acids Res. 2004;32(Database issue):D493–6. doi: 10.1093/nar/gkh103. [DOI] [PMC free article] [PubMed] [Google Scholar]
- 23.Bastos RN, Penate X, Bates M, Hammond D, Barr FA. CYK4 inhibits Rac1-dependent PAK1 and ARHGEF7 effector pathways during cytokinesis. J. Cell Biol. 2012;198:865–880. doi: 10.1083/jcb.201204107. [DOI] [PMC free article] [PubMed] [Google Scholar]


