

Abstract
This study addresses the in vivo and in vitro expression pattern of three genes that are operative in the thyrotroph subpopulation of anterior pituitary cells: glycoprotein α-chain (Cga), thyroid-stimulating hormone β-chain (Tshb), and TRH receptor (Trhr). In vivo, the expression of Cga and Tshb was robust, whereas the expression of Trhr was low. In cultured pituitary cells, there was a progressive decline in the expression of Cga, Tshb, and Trhr. The expression of Tshb could not be reversed via pulsatile or continuous TRH application in variable concentrations and treatment duration or by the removal of thyroid and steroid hormones from the sera. In parallel, the expression of CGA and TSHB proteins declined progressively in pituitary cells from both sexes. The lack of the effect of TRH on Tshb expression was not related to the age of pituitary cultures and the presence of functional TRH receptors. In cultured pituitary fragments, there was also a rapid decline in expression of these genes, but TRH was able to induce transient Tshb expression. In vivo, thyrotrophs were often in close proximity to each other and to somatotroph and folliculostellate cell networks and especially to the lactotroph cell network; such an organization pattern was lost in vitro. These observations suggest that the lack of influence of anterior pituitary architecture and/or intrapituitary factors probably accounts for the loss of basal and TRH-stimulated Tshb expression in dispersed pituitary cells.
The anterior pituitary gland contains at least five secretory cell subpopulations specialized to synthesize and secrete hormones in response to the activation of numerous receptor- and channel-dependent signaling pathways: corticotrophs, gonadotrophs, lactotrophs, somatotrophs, and thyrotrophs (1). This gland also contains the glia-like folliculostellate (FS) cells, and the relationship between these and secretory cells resembles glia-neuron interactions in the brain (2, 3). Somatotrophs and lactotrophs are also organized as homogeneous networks throughout the anterior pituitary gland; the functional characterization of these networks revealed a role in gene regulation, the plasticity of pituitary hormone output, and the ability to memorize altered demand (3, 4). Other secretory pituitary cells may also form networks, and further studies are needed to clarify the physiological relevance of such organizations (5).
The focus in our ongoing work is on thyrotrophs, which synthesize and secrete TSH, a hormone composed of two subunits: the glycoprotein α-subunit (CGA), also synthesized by gonadotrophs, and the thyrotroph-specific β-subunit (TSHB), which provides the biological hormonal activity and is rate limiting in the formation of mature TSH (6–9). The understanding of thyrotroph functions comes from numerous in vivo experiments (10). Different in vitro models have also been used, including cultured anterior pituitary cells from hypothyroid rats (11–13), thyrotrophic tumor tissues (7), and immortalized TαT1 thyrotrophs and GH3 lactosomatotrophs transfected with Tshb promoter (14–17). These cell models helped us to advance understanding of the transcriptional regulation of the TSH genes.
TSH controls thyroid functions by stimulating the synthesis and secretion of thyroid hormones, which in turn exert a negative feedback by transcriptional and posttranscriptional mechanisms, rapidly reducing Cga and Tshb expression, synthesis of two subunits, and TSH release (10, 18, 19). The main positive regulator of TSH release is hypothalamic TRH (20), which activates the Gq/11-coupled TRH receptor-1 (TRHR1), also expressed in lactotrophs and a fraction of somatotrophs (21, 22). TRH not only stimulates the release of prestored TSH and accounts for pulsatile and circadian patterns of TSH secretion but also stimulates Cga, Tshb, and Trhr expression and contributes to the posttranslational maturation of the TSH oligosaccharide chains, which guarantee the full biological activity of TSH (23–28). However, the mechanism by which TRH/TRHR1 controls transcription has not been fully characterized (29–32).
Here we studied the expression of three genes that are essential for thyrotroph functions: Cga, Tshb, and Trhr. Experiments were performed with pituitaries from developing and postpubertal female and male rats in vivo and in vitro. The main focus in study was on basal and TRH-stimulated gene expression and the relevance of pituitary cell organization in these processes.
Materials and Methods
Chemicals
Anti-TSHB, anti-GH, antiprolactin (PRL), and guinea pig anti-CGA antisera were obtained from Dr A. Parlow (National Institute of Diabetes and Digestive and Kidney Diseases, National Hormone and Peptide Program, Torrance, California). Mouse monoclonal anti-S100 antibody was purchased from Chemicon. Alexa goat antirabbit, anti-guinea pig, and antimouse IgG-horseradish peroxidase conjugated were purchased from Santa Cruz Biotechnology, Inc; SC-2004, SC-2903, and SC-2354). Primary antibody details are given in Supplemental Table 1. Fura 2-AM, polyvinylidene difluoride-blotting membrane, medium 199, serums, and NuPAGE electrophoresis system were purchased from Life Technologies, Inc. RNeasy Plus minikit was purchased from QIAGEN. Transcriptor first-strand cDNA synthesis kit and LightCycler TaqMan master mix were obtained from Roche Applied Science. The protein molecular weight marker was obtained from Bionexus Inc. SuperSignal West Femto chemiluminescent substrate kit was purchased from Thermo Fisher Scientific. For the RIA analysis of the sample PRL content, the 125I-PRL tracer was purchased from PerkinElmer Life Sciences. A TSH ELISA kit was purchased from Endocrine Technologies. Unless stated otherwise, all other chemicals were obtained from Sigma.
Animals and primary culture of anterior pituitary cells
Experiments were performed with anterior pituitary tissues, cultured tissue pieces, or cultured anterior pituitary cells from normal female and male Sprague Dawley rats of different ages obtained from Taconic Farms. Animals were housed under constant conditions of temperature and humidity, with light on between 6:00 am and 8:00 pm. In postpubertal females, the estrous cycle was monitored via vaginal smears, and only females exhibiting regular 4- or 5-day cycle were used in experiments, which were performed with pituitaries from mixed stages of estrous cycle. Euthanasia was done via asphyxiation with CO2, and the anterior pituitary glands were removed after decapitation within 30 minutes. Glands were used for histological preparations and mRNA/protein extraction or cut into approximately 1-mm3 cubes and used for in vitro incubation or for cell dispersion, the latter done after treatment with trypsin and EDTA as previously described (33). During dispersion of cells, a procedure that requires 2 hours, pituitary fragments were kept on ice, ie, incubations with pituitary fragments and freshly dispersed pituitary cells started at the same time point (about 2.5 h after removal of the glands from animals). Furthermore, incubations of pituitary fragments and dispersed cells were done under identical experimental conditions. Briefly, prewarmed (37°C) medium 199 containing Earle's salts, sodium bicarbonate, 100 U/mL penicillin, 100 μg/mL streptomycin, and 0.1% of BSA-fraction V, or charcoal-treated serum was added to tissue fragments and dispersed cells, both placed in 24-well plates and incubated at 37°C in a water-saturated atmosphere of 5% CO2 in air for 15 minutes to 8 hours.
Dispersed pituitary cells were also used for experiments during prolonged (up to 72 h) incubation; depending on the experiment performed, cells were cultured in medium 199 containing 10% heat-inactivated horse serum (HS), 10% fetal bovine serum (FBS), 10% charcoal-treated FBS, or 0.1% of BSA-fraction V. In some experiments, dispersed cells were cultured in 10% HS-containing medium 199 for 24 hours, washed, and incubated for up to 6 hours in the fresh medium 199 containing 0.1% BSA-fraction V. At the end of incubation, the medium was removed and fragments/cells were used for mRNA extraction, as described below. Experimental protocols and media used for single cell calcium recordings and secretory studies are also described below. The experiments were approved by the National Institute of Child Health and Human Development Animal Care and Use Committee (animal protocol 14-041).
Quantitative RT-PCR (qRT-PCR) analysis of Tshb, Cga, and Trhr
Total RNA was extracted from pituitary tissue of cultured cells using an RNeasy Plus minikit (QIAGEN) and reverse transcribed with Transcriptor first-stand cDNA synthesis kit (Roche Applied Science). An analysis of the relative gene expression was performed using quantitative real-time PCR and the comparative cycle threshold method (34, 35). For this, the LightCycler TaqMan master mix and Lightcycler 2.0 real-time PCR system (Roche Applied Science) were used. To compare the relative expression levels of the studied transcripts, they were calibrated against Gapdh, the housekeeping gene whose expression did not significantly differ in vitro (Supplemental Figure 1A) and in vivo (data not shown). Applied Biosystems predesigned Taq-Man gene expression assays were used for Gapdh, Rn01462662_g1; Tshb, Rn01534458_g1 and Rn00565424_m1; Cga, Rn02532426_s1; and Trhr, Rn00564882_m1. The linear regression shown in Supplemental Figure 1B indicates the specificity of the Tshb primers.
Western blotting analysis
Anterior pituitary tissues and primary pituitary cells in culture were lysed using radioimmunoprecipitation assay buffer (50 mM Tris-HCl, pH 7.4; 150 mM NaCl; 1% Triton X-100; 1% sodium deoxycholate; 0.1% sodium dodecyl sulfate, and 1 mM EDTA) supplemented with protease inhibitors. The samples were separated on 4%-12% NuPAGE Novex Bis-Tris gel and transferred onto a polyvinylidene difluoride membrane. The membrane was blocked for 2 hours at room temperature and then incubated overnight at 4°C with one of the following primary antibodies: anti-TSHB, anti-CGA, anti-GH, or anti-β-actin protein expression (ACTB) (see Supplemental Table 1). All incubations were performed in 5% milk in a buffer of 0.5 M Tris base, 9% NaCl, and 1.5% Tween 20 (pH 8.4). After incubation with peroxidase-conjugated secondary antibody diluted to 1:10 000, the blots were incubated with the SuperSignal West Femto chemiluminescent substrate, and the bands were visualized on a FluorChem E digital imaging system (ProteinSimple).
Intracellular calcium measurements
The measurements of the intracellular calcium concentrations ([Ca2+]i) in freshly dispersed and in cultured single pituitary cells were performed as previously described (36, 37). Briefly, immediately after dispersion, anterior pituitary cells were plated on poly-L-lysine-coated coverslips. For recording in freshly dispersed pituitary cells, phenol red-free medium 199 containing Earle's salts, sodium bicarbonate, 100 U/mL penicillin and 100 μg/mL streptomycin, and 2.5 μM Fura 2-AM was added to dishes with coverslips, and the cells were incubated at 37°C in a water-saturated atmosphere of 5% CO2 in air for 60 minutes. For recording in cultured cells, regular medium 199 containing Earle's salts, sodium bicarbonate, penicillin, streptomycin, and 10% HS was added to dishes with coverslips, and cells were incubated overnight at 37°C in a water-saturated atmosphere of 5% CO2 in air. After that, the cells were washed and bathed in Krebs-Ringer-like medium containing 2.5 μM Fura 2-AM for 1 hour at room temperature. In both experimental protocols, the coverslips were washed in Krebs-Ringer-like media and were mounted on the stage of an inverted Observer-D1 microscope (Carl Zeiss) attached to an ORCA-ER camera (Hamamatsu Photonics) and a Lambda DG-4 wavelength switcher (Sutter). Hardware control and image analysis were performed using Metafluor software (Molecular Devices). Experiments were performed under a ×40 oil immersion objective during exposure to alternating 340- and 380-nm excitation beams, and the intensity of light emission at 520 nm was followed simultaneously in approximately 20 single cells. The changes in [Ca2+]i are presented by the ratio of fluorescence intensities F340 to F380. After the intracellular calcium measurements, immunocytochemistry was performed to identify thyrotrophs and lactotrophs, as described below.
Perifusion studies
Immediately after the cell preparation, the primary pituitary cells were cultured on Cytodex-1 beads (15 × 106 cells per 300 μL of preswollen beads) as previously described (38). Briefly, 300 μL of preswollen cytodex-1 bead suspension, 15 × 106 cells, and 5 mL regular medium 199 containing Earle's salts, sodium bicarbonate, penicillin, streptomycin, and 10% HS were mixed in uncoated 60-mm petri dishes and incubated at 37°C in a water-saturated atmosphere of 5% CO2 in air overnight. Columns of beads carrying 1-day cultured cells were loaded in 0.5 mL temperature-controlled chamber and perifused with warm (37°C) medium 199 containing Hanks' salts, 25 mM HEPES, 0.1% BSA, and antibiotics for 90 minutes at a flow rate of 0.6 mL/min to stabilize basal hormone secretion (Supplemental Figure 2). After that, TRH was applied once for 15 minutes (for PRL and TSH release) or two times per hour for 5 minutes over a 6-hour period (for Tshb expression). Fractions were collected every 1 or 5 minutes and stored at −20°C, and the samples were analyzed for the content of PRL and TSH.
Tissue preparation, immunohistochemistry, and immunocytochemistry
Adult rat pituitaries were fixed in Bouin's solution for 48 hours, dehydrated in alcohol, immersed in xylene, and embedded in paraffin. Five-micrometer-thick coronal sections were cut on a microtome and mounted on glass slides. GH, PRL, and TSHB rabbit antirat antisera were used at 1:1000 dilutions. A mouse monoclonal anti-S100 antibody was used at a 5 mg/mL dilution. Sections were labeled for GH, PRL, or S100 protein overnight at 4°C and then for TSHB. To perform a reliable double-immunofluorescence labeling for two rabbit antibodies, the procedure according to Toth and Mezey (39) was used. Briefly, after labeling the first primary antibody using a tyramide signal amplification kit (with horseradish peroxidase-goat antirabbit IgG and Alexa Fluor 488 tyramide; Invitrogen), a microwave treatment was applied as described previously (40). Sections were then incubated with TSHB antisera for 1 hour at room temperature, followed by donkey antirabbit Alexa Fluor 555 (2 h at 1:400 dilution; Invitrogen).
The same procedure was used for double labeling of the cells in the primary cultures. Omission of primary antibodies resulted in the absence of an immune reaction. Sections were mounted in Mowiol and visualized under an inverted confocal microscope (Zeiss LSM 510). Z stacks of pituitary tissue sections were used to analyze thyrotroph contacts with lactotrophs, somatotrophs, and FS cells. Only thyrotrophs bodies in which nuclei could be clearly identified were taken into account. For immunocyto/histochemistry, the anterior pituitary cells or the pituitary slices were fixed with cold paraformaldehyde 4% for 20 minutes, and the nonspecific binding sites were blocked with 3% normal goat serum in PBS for 2 hours at room temperature. Incubation with rabbit primary antibody against rat TSHB (1:400) or PRL (1:500) was performed overnight at 4°C. After washing the slides and coverslips with PBS, they were incubated with the secondary goat antirabbit horseradish peroxidase-conjugated antibody (1:200) (Santa Cruz Biotechnology) diluted in blocking solution for 2 hours at room temperature. Labeling was performed with 0.05% diaminobenzidine tetrahydrochloride and 0.03% hydrogen peroxide. Images were acquired using an Olympus BX61 microscope. Brightness and contrast were adjusted in Adobe Photoshop CS4.
Data analysis
All numerical data in the text are reported as means ± SEM values. Significant differences between means were determined by an ANOVA accompanied with the post hoc Student-Newman-Keuls test when variables were equal and by nonparametric Mann-Whitney U test when variables were not equal across groups. Analysis was done separately for males and females except for results shown in Table 1. The r coefficient of correlation was used to estimate significance in linear regression analysis (Supplemental Figure 1). All statistics was done using the KaleidaGraph Program (Synergy Software). Values of at least P < .05 were considered significant.
Table 1.
In Vivo Expression of Cga, Tshb, and Trhr in the Rat Anterior Pituitary Gland During Development
| Age |
Cga |
Tshb |
Trhr |
|||
|---|---|---|---|---|---|---|
| Female | Male | Female | Male | Female | Male | |
| Juvenile | 1594 ± 53 (12) | 651 ± 30 (9)a | 1161 ± 78 (13) | 1141 ± 65 (9) | 2.1 ± 0.3 (13) | 0.8 ± 0.1 (9)a |
| Peripubertal | 1724 ± 307 (7) | 2070 ± 253 (15) | 835 ± 96 (7)b | 1199 ± 73 (15)a | 1.9 ± 0.4 (7) | 2.1 ± 0.1 (14)b |
| Adult | 873 ± 96 (18)b | 751 ± 104 (12)b | 478 ± 24 (19)b | 660 ± 51 (13)a,b | 1.6 ± 0.3 (10) | 1.3 ± 0.2 (4) |
Glands were removed between 8:00 and 10:00 am and mRNA was extracted for the qRT-PCR analysis of the expression of Cga, Tshb, and Trhr. Data shown are the means ± SEM values relative (percentage) to Gapdh expression. Juvenile period: from day 21 to day 30 in females and from day 21 to day 35 in males; peripubertal period from day 30 to day 40 in females and day 35 to day 60 in males; adult period from day 40 in females and day 60 in males. Numbers in parentheses indicate the number of animals per group.
P < .05 when compared between males and females of the same developmental group.
P < .05 when compared with juvenile animals.
Results
In vivo expression of Cga, Tshb, and Trhr
To study the developmental changes in expression of these genes, which are critical for thyrotroph functions, anterior pituitary glands were collected from juvenile, peripubertal, and adult female and male rats between 8:00 and 10:00 am, and mRNA was extracted for qRT-PCR analysis. Experiments revealed a robust expression of Cga and Tshb, 6- to 20- and 4- 11-fold higher than the expression of Gapdh in three developmental stages, respectively, and much lower expression of Trh, reaching less than 2% of Gapdh expression. In both males and females, there were significant differences in the expression of Cga and Tshb during development. There were also significant sex differences in the expression of the three genes during development (Table 1).
Down-regulation of Cga, Tshb, and Trhr in pituitary fragments and dispersed cells
The status of expression of these genes in vitro in the absence TRH was examined in tissue fragments and dispersed pituitary cells cultured under identical experimental conditions for variable times prior to mRNA extraction and the qRT-PCR analysis of Cga, Tshb, and Trhr expression (see Materials and Methods). In cultured pituitary fragments from adult males, there was a significant drop in the expression of these genes after 4 hours of incubation, followed by a further decline during an additional 4-hour incubation. At the end of the incubation, the expression of Cga, Tsb, and Trhr was 11% ± 2%, 9% ± 1%, and 20% ± 1%, respectively, of that observed in pituitary tissue immediately after removal from the body (Figure 1, A–C).
Figure 1. The time course of gene expression in cultured rat pituitary fragments and dispersed cells in the absence of TRH and T3.

A–C, Decay in Cga (A), Tshb (B), and Trhr (C) expression in cultured pituitary tissues from adult males. D–F, Anterior pituitaries from 7-week-old females and males were used for cell dispersion, and the residual pituitaries were used for mRNA extraction from tissue. Immediately after dispersion, a fraction of the cells were used for mRNA extraction (0 h group), and the residual cells were cultured for 18–72 hours prior to the mRNA extraction and qRT-PCR analysis of Cga (D), Tshb (E), and Trhr (F) expression. The data shown are the means ± SEM values relative to Gapdh (100%) from a single (panels A–C) and three experiments (panels D–F), each done with at least five dishes per time point in males (black bars) and females (white bars). Asterisks indicate significant differences (P < .05) between compared groups for both females and males, calculated separately.
At a 0 time point, ie, at the end of the cell dispersion procedure, the expression of the Tshb and Trhr genes in pituitary cells from 7-week-old females and males were already reduced when compared with that observed in pituitary tissue immediately after removal. In both male and female cell cultures, a significant (3-fold) reduction in Cga expression was observed 18 hours after cell preparation, and no further reduction was detected up to 72 hours (Figure 1D). In contrast, there was an exponential decline in Tshb expression during 72 hours of incubation, reaching approximately 1% of that observed in vivo (Figure 1E). The Trhr mRNA content was significantly decreased by the end of the cell dispersion procedure, and the decrease continued until 18 hours after cell preparation. At the end of the incubation, a partial recovery of Trhr expression was observed (Figure 1F).
Time-dependent decrease in CGA and TSHB content in cultured pituitary cells
In parallel to the time course of the decrease in gene expression, there was a decline in the CGA protein cell content with the age of the cultures, reaching 20% ± 11% and 35% ± 9% in 72-hour-old male and female cultures, respectively (Figure 2, A and B). The TSHB protein content decreased progressively with the age of the cultures, reaching 14% ± 5% and 4% ± 2% in 72-hour-old male and female cultures, respectively, when compared with the cell content of these proteins in freshly dispersed pituitary cells (Figure 2, A and C). In contrast, there was no visible decrease in the cell content of GH over time in both female and male pituitary cultures (Figure 2, A and D), indicating that the expression of GH gene was not inhibited in vitro. ACTB was also comparable in female and male pituitary cells during the 72-hour incubation (Figure 2A). These results indicate that the prestored TSH in secretory vesicles is gradually released from cells and only partially replaced by de novo synthesized TSHB and CGA proteins due to the progressive reduction in their expression.
Figure 2. The down-regulation of CGA and TSHB proteins in cultured rat pituitary cells.
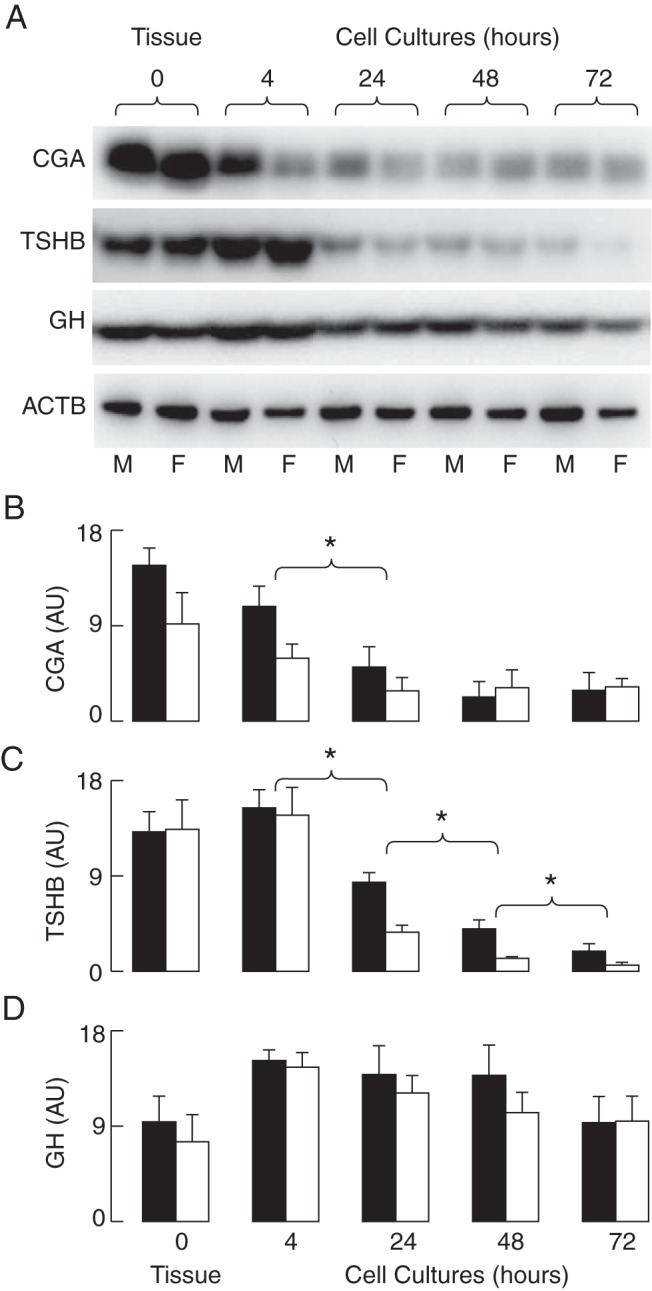
Tissue samples and the fraction of cells obtained immediately after cell preparation (4 h) were used for protein extraction; the residual cells were cultured for 24–72 hours prior to protein extraction and Western blot analysis of the CGA and TSHB content. The GH and ACTB content served as controls. A, Representative blots. B–D, The means ± SEM values of arbitrary units obtained via a densitometry analysis of CGA (B), TSHB (C), and GH (D) for males (M; black bars) and females (F; white bars) from six experiments. Asterisks indicate significant differences (P < .05) between compared groups for both females and males.
Down-regulation of Tshb and the status of T3 in media
We cultured pituitary cells from females in HS-, FBS-, BSA- or charcoal-treated FBS-containing medium and examined the expression of Tshb during 30 hours of incubation. Filtered FBS contained 12.7 μg/dL (163 nM) T4 and 44.7 ng/dL (0.6 nM) T3, whereas FBS stripped with charcoal contained 0.798 μg/dL T4 (10 nM) and T3 was not detectable. The removal of T3/T4 from FBS with charcoal pretreatment had a transient positive effect on Tshb expression when compared with two other media containing T3/T4 (Figure 3A). Further incubation resulted in a progressive decrease in Tshb expression independent of the type of medium used; the Tshb expression in 24-hour cultures was reduced to 7%–14% of that observed immediately after the dispersion of cells (Figure 3A). BSA fraction V does not contain T3/T4 and represents an established system allowing for the calculation of the free T3/T4 concentration (41). Pituitary cells from females and males cultured for 24 hours in medium containing 0.1% BSA also showed a significant reduction in Tshb expression (Figure 3B). However, T3 applied in a 10-nM concentration further inhibited Tshb expression in all experimental conditions; Figure 3C illustrates the effects of T3 applied for 24 hours immediately after the dispersion and after a 24-hour incubation. Thus, the direct negative effect of T3 on Tshb expression is operative in cultured cells but does not entirely account for the progressive in vitro down-regulation of Tshb.
Figure 3. Effect of culture conditions on Tshb expression in rat pituitary cells.

A, The down-regulation of basal Tshb expression in pituitary cells from females is independent of the type of serum used: charcoal-treated fetal bovine serum (FBS + Char), charcoal-untreated FBS, or charcoal-untreated HS. B, The down-regulation of basal Tshb expression in cells bathed in medium containing 0.1% BSA only. In both panels, zero represents samples from cells immediately after cell dispersion. C, T3 down-regulates the basal Tshb expression in female pituitary cells. D, The lack of an effect of 6 hours of application of TRH in different concentrations on Tshb expression in 24-hour-old pituitary static cultures. E, The lack of an effect after continuous application of 10 nM TRH for indicated times on Tshb expression in male and female pituitary cells in 24-hour-old cultures. F, The lack of an effect of a pulsatile 10-nM TRH application (2 × 5 min/h for 6 h of incubation) on Tshb expression in perifused male and female pituitary cells cultured on beads for 24 hours. Data points are means ± SEM values from a single (panels A and B) and from a representative of three similar experiments (panels C–E) (n = 4 per time point). In panels B–F, cells were bathed in 0.1% BSA-containing medium 199. Asterisks indicate significant differences (P < .05) between compared groups for both females and males.
The lack of TRH effect on Tshb expression in cultured pituitary cells
Because Tshb expression depends on TRH (42), we treated cells with this agonist in different experimental conditions. However, in none of them we observed stimulation of gene expression. TRH applied to 24-hour-old cultures of male and female pituitary cells in three concentrations (1, 10, and 100 nM) for 6 hours was unable to increase Tshb expression (Figure 3D). The time course study (0–8 h) on 24-hour-old cultures also indicated the lack of response to continuous application of 10 nM TRH application (Figure 3E). In perifused pituitary cells, application of 10 nM TRH for 5 minutes every 30 minutes during a 6-hour incubation was also ineffective (Figure 3F). Under similar experimental conditions, we observed comparable PRL secretion profiles (Supplemental Figure 2), arguing against the desensitization of TRHR1 during pulsatile short-term TRH application. Thus, both pulsatile and continuous applications of TRH were unable to reverse the down-regulation of Tshb expression in cultured pituitary cells.
Expression and functionality of TRHR1 in cultured pituitary cells
The lack of TRH-induced Tshb expression in dispersed pituitary cells could reflect the loss of functional TRHR1 in cultured cells. To address this hypothesis, TRH-induced single cell calcium signaling was tested in 24-hour-old cultures. At the end of the measurements, immunocytochemistry was performed using anti-TSHB and anti-PRL antibodies to identify TRHR1-bearing thyrotrophs and lactotrophs, respectively. We also tested the ability of TRH to trigger TSH and PRL secretion in perifused pituitary cells. Experiments were performed with cells from females because the number of lactotrophs and TRH-induced PRL release in male cultures are significantly lower (43).
The immunocytochemical analysis revealed that approximately 8%–10% and 25% of the identified cells were thyrotrophs and lactotrophs, respectively, a finding that is consistent with the literature (44). Figure 4 shows the labeling for TSHB-positive cells (Figure 4A) and PRL-positive cells (Figure 4B) in gridded coverslips used for intracellular calcium measurements studies prior to fixing. Approximately 55% of the identified thyrotrophs responded to the application of 100 nM TRH: 23% of the TSHB-positive cells presented an intermediary plateau response to TRH (Figure 4C), approximately 14% showed a larger initial response to TRH followed by fluctuations from a plateau level (Figure 4D), and approximately 18% of the thyrotrophic-positive cells demonstrated the third pattern, which represented a huge response to TRH characterized by a single peak not accompanied by a plateau (Figure 4E). The residual thyrotrophs did not respond to TRH application (Figure 4F). None of the TSHB-positive cells responded to dopamine application (Figure 4, C–F). Approximately 50% of the PRL-positive cells responded to TRH application with a spike response accompanied with sustained plateau response, which was abolished via the application of dopamine, whereas 50% of the identified lactotrophs showed no response or only a small increase in [Ca2+]i (Figure 4G).
Figure 4. TRH-induced calcium signaling and hormone secretion in female rat thyrotrophs and lactotrophs.

A and B, Imunocytochemically identified thyrotrophs (A) and lactotrophs (B) in mixed populations of anterior pituitary cells. C–G, Typical patterns of calcium signaling induced via 100 nM TRH and 10 μM dopamine in immunocytochemically identified thyrotrophs (panels C–F) and lactotrophs (panel G). The numbers above the traces indicate the percentage of cells responding to TRH with particular patterns of calcium signaling from 26 immunopositive thyrotrophs derived from four different cell preparations and 18 immunopositive lactotrophs from two different cell preparations. H and I, TRH-induced TSH secretion (H) and PRL secretion (I) in perifused pituitary cells. Traces shown are representative from two (H) and 10 (I) independent experiments. All experiments were performed 24 hours after cell dispersion.
In perifused female pituitary cells, the primary difference between the thyrotroph and lactotroph secretory response was in the basal release; the basal TSH secretion was low (1.30 ± 0.07 ng/mL), whereas the basal PRL release was high (100 ± 2.2 ng/mL). Both thyrotrophs and lactotrophs responded to a transient application of 100 nM TRH with a biphasic secretory response composed of an early spike response and a sustained plateau response (Figure 4, H and I). Thus, in contrast to the loss of TRH-dependent Tshb expression, TRH-dependent calcium signaling and secretion were preserved in greater than 50% of cultured pituitary cells, ie, it is not the lack of functional TRHR1 that accounts for inefficiency of TRH to stimulate Tshb expression.
Effects of TRH and T3 on Tshb expression in pituitary fragments and freshly dispersed cells
Incubation of pituitary fragments and freshly dispersed cells was done under identical experimental conditions as described in Materials and Methods. Application of TRH increased the expression of Tshb in pituitary fragments from females. Figure 5A illustrates a short time stimulatory effect of 10 nM TRH on Tshb expression during the first 60 minutes of stimulation. The stimulatory effect of 100 nM TRH on Tshb expression was also observed during 4 and 6 hours of stimulation (Figure 5B). In the absence of TRH, there was a down-regulation in Tshb expression, which was facilitated in the presence of 10 nM T3 (Figure 5C). Comparison of the action of 100 nM TRH in female and male pituitary fragments during 6 hours of incubation revealed that TRH treatment significantly enhanced the Tshb expression, whereas 10 nM T3 inhibited basal gene expression (Figure 5D).
Figure 5. Comparison of effects of TRH and T3 on Tshb expression in pituitary fragments and freshly dispersed cells incubated under identical experimental conditions.

A–D, The up- and down-regulation of Tshb in rat pituitary fragments. A, Rapid up-regulation of Tshb expression by 10 nM TRH. B, A transient nature of TRH (100 nM)-induced Tshb expression in pituitary tissues. C, Additive effects of 10 nM T3 on the down-regulation of Tshb expression. D, Modulation of Tshb expression in pituitary fragments by TRH (100 nM) and T3 (10 nM) applied for 6 hours. Data points are means ± SEM (n = 4) in one from two experiments. *, P < .05. E and F, The lack of TRH effect on Tshb expression in freshly dispersed cells from female (E) and male (F) rats. G, Inhibitory effect of 10 nM T3 on Tshb expression. Data points are mean ± SEM values from three independent experiments (panels E and F) and a single experiment (panel G).
In contrast, TRH was unable to reverse the down-regulation in Tshb expression in female and male pituitary cells (Figure 5, E and F), whereas negative effect of T3 was preserved (Figure 5G). To examine the functionally of TRHR1 receptors in freshly dispersed cells, single-cell calcium measurements were done 1–2.5 hours after dispersion. TRH-induced calcium response was observed in 23% of female pituitary cells (64 of 280 cells from 14 coverslips) and in 16% of male cells (46 of 294 cells from 15 coverslips). The next day, cells from the same preparation similarly responded to TRH application: 26% cells from females (31 of 119; seven coverslips) and 20% from males (28 of 140 cells; seven coverslips). Together these data indicate that the in vitro down-regulation of Tshb expression could be reversed, at least partially, in pituitary fragments but not in dispersed pituitary cells and that the lack of TRH action is not a consequence of the loss of functional TRHR1.
In vivo and in vitro organization of thyrotrophs
In further studies, we examined the organization of the thyrotroph subpopulation of pituitary cells in intact pituitary tissue and dispersed pituitary cells. Figure 6 illustrates the immunohistochemical labeling of TSHB in male and female pituitary sections from postpubertal rats. Most of the thyrotrophs are located in the middle central and middle lateral portions of the gland. They appear as large, triangularly shaped cells distributed around capillaries and are solitary or are in small clusters close to each other. Furthermore, no apparent differences in cell shape, number, or morphology were observed between males (Figure 6, left panels) and females (Figure 6, right panels).
Figure 6. Immunohistochemical labeling of TSHB in male and female pituitary sections.
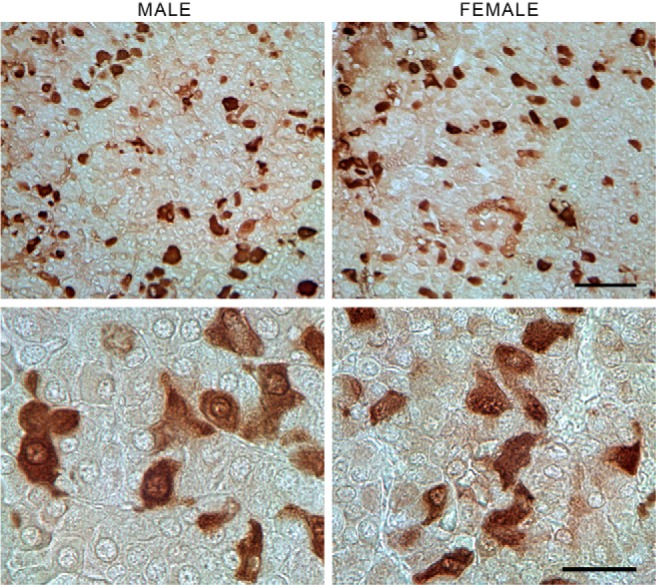
No apparent differences were observed in the size, shape, or number of TSHB-positive cells between sexes. Most of the thyrotrophs were located in the middle central and middle lateral portions of the gland near the capillaries (upper panel). Although most of the TSHB-positive cells were solitary, small clusters of cells near each other could also be seen (lower panel). Scale bar, upper panel, 50 μm; lower panel, 20 μm.
To examine the thyrotroph associations with the three proposed pituitary cellular networks, sections were double labeled for TSHB and S100 (a marker of FS cells), GH, or PRL. Figure 7 shows that S100-positive processes were in touch with each other and that thyrotrophs were occasionally close to FS cell processes (Figure 7, left panels). Analysis of Z stacks revealed that 70% of identified thyrotrophs (23 of 33) were in close proximity with FS cells. Somatotrophs made up the dominant population of secretory cell types; they were round with a large nucleus and were in contact with each other. However, a large portion of the cell body remained available to contact other pituitary cells. Some thyrotrophs were situated very close to somatotroph cell bodies, whereas others were apparently not in contact with the GH network (Figure 7, middle panels). Analysis of Z stacks showed that about 64% of thyrotrophs were in close proximity of GH-positive cells. PRL-positive cells were more closely interconnected compared with FS cells and somatotrophs (Figure 7, right top panel) because most of the TSHB-positive cells were surrounded with two or more lactotrophs. Thyrotrophs frequently appeared to be completely immersed in a lactotroph cell network (Figure 7, right bottom panel). Practically every thyrotroph (79 of 80) was located very near to lactotrophs, as revealed by analysis of Z stacks.
Figure 7. Double-immunofluorescent labeling for TSHB (red fluorescence) and S100, GH, or PRL (green fluorescence) in anterior pituitary sections of postpubertal female rats.
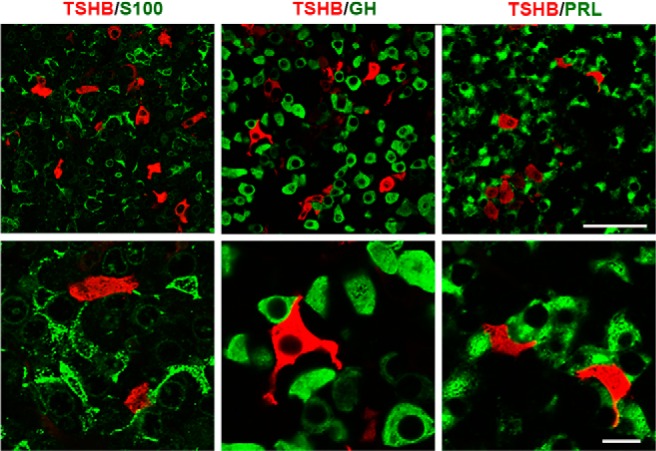
Left panel, Organization of S100-positive cells and their relationship with thyrotrophs. Middle panel, Dominance of GH-positive cells in anterior pituitary tissue and their interactions with thyrotrophs. Right panel, Interconnections between PRL-positive cells and their physical closeness to thyrotrophs. Scale bar, upper panel, 50 μm; lower panel, 10 μm.
In anterior pituitary cells cultured for 24 hours with a density used for the evaluation of the expression of Tshb, Cga, and Trhr, there was no obvious connection between the cells. The expression of S100 was lower compared with that of the intact tissue (Supplemental Figure 3, left panel). As in the tissue, somatotrophs were round shaped (Supplemental Figure 3, middle panel), but, in contrast with tissue, lactotrophs were also round (Supplemental Figure 3, right panel).
Discussion
Here we studied the in vivo and in vitro patterns of the expression of three genes critical for thyrotroph functions: Cga, Tshb, and Trhr. Two of these genes are expressed in other cell types as well, Cga in gonadotrophs and Trhr in lactotrophs and a fraction of somatotrophs (1, 22), meaning that the observed mRNA expression patterns were also related to cell populations expressing these genes. In contrast, the expression of Tshb is thyrotroph specific. We consistently observed the robust and sex-specific expression of Tshb and Cga during development, whereas the expression of Trhr was lower, representing 1%-2% of the expression of Gapdh, the housekeeping gene, whose expression did not significantly differ during development and in vitro without or with TRH.
In vitro, there was a relatively rapid down-regulation of the expression of these genes in both dispersed pituitary cells and pituitary fragments, and Tshb expression was most dramatically affected. In parallel with mRNA measurements, the analysis of protein content showed a significant drop in the TSHB content in cultured pituitary cells. Under continuous TRH (10 nM) stimulation, there was a rapid but transient stimulation of Tshb expression in pituitary fragments lasting for approximately 6 hours. The transient activation of gene expression by native agonist is not unique for thyrotrophs; GnRH-induced Dmp1 expression in gonadotrophs is also transient (45). The inhibitory effect of T3 on Tshb expression was preserved in pituitary fragments as well as in freshly dispersed and cultured pituitary cells. Such results are consistent with the functional organization of the hypothalamic-pituitary-thyroid axis, with feed-forward effects of TRH and TSH on thyroid hormone synthesis and secretion and negative feedback action of thyroid hormones on Trh, Trhr, Cga, and Tshb expression (10, 18, 19, 23, 42, 46).
In contrast to experiments with pituitary fragments, TRH applied in different concentrations periodically and continuously was unable to stimulate Tshb expression in freshly dispersed and in cultured pituitary cells. Single-cell calcium measurements and secretory studies with perifused pituitary cells showed that TRHR1 were functional at least in a fraction of thyrotrophs. Because calcium is one of the intracellular messengers accounting for the TRH stimulation of Tshb expression via TRHR1 receptors (47), it would be reasonable to expect that TRH stimulates Tshb expression in dispersed pituitary cells. Our experiments excluded the possibility that T3 content in media used in experiments blocks TRH action. In similar experimental conditions with cultured pituitary cells, the stimulatory action of GnRH on Cga and Fshb expression was preserved (45), further arguing against the side effect of cell dispersion on calcium-mobilizing receptors/pathways.
The loss of the stimulatory effect of TRH on Tshb expression in freshly dispersed and cultured pituitary cells indicates that additional factors contribute to the TRH induction of Tshb expression in situ. There are two major differences between pituitary fragments and dispersed cells that could account for such difference in response: the intrapituitary organization and the intrapituitary secretion. In accordance with the first hypothesis, several recent studies have suggested the importance of tissue organization in intracellular communication in other pituitary endocrine responses (4, 48–50). The latter hypothesis includes the relevance of paracrinicity in TRH-induced gene expression, a growing story of cellular pituitary cross talk (51).
The architecture of the anterior pituitary gland is dominated by three cellular networks, two composed of endocrine cells, lactotrophs (52), and somatotrophs (53) and one of FS cells (2). Our immunohistological analysis was also consistent with the star-shaped FS cells and irregularly polygonal lactotrophs being organized as morphological networks. Somatotrophs, the most common cells in the anterior pituitary, are round shaped, suggesting that this network is differently organized. Here we also showed that thyrotrophs in vivo were frequently grouped in small clusters of interconnected-like cells. Our results further indicated that thyrotrophs in vivo are close to somatotrophs and FS cells and especially to lactotrophs. Practically, all thyrotrophs appear to be completely immersed in a lactotroph cell network.
We may speculate that connections among thyrotrophs and/or electrical or chemical interactions between thyrotrophs and other cellular networks are critical for thyrotroph function and the proper action of TRH on gene expression. Certainly the enzymatic dispersion of anterior pituitary cells destroys pituitary cell networks, and, at the cell density used in our studies on gene expression and calcium signaling, the thyrotrophs and most other cell types were seeded as solitary cells, without physical contact to other cells. It is also reasonable to conclude that the paracrinicity is abolished or dramatically attenuated in freshly dispersed and cultured cells. To this end, the immortalized TαT1 thyrotrophs (15) may provide a useful cell model to study the expression of three genes critical for thyrotroph function in the absence of other pituitary cell types. Additional studies should also be conducted with different densities of pituitary cells to examine whether the stimulatory action of TRH can be rescued at higher cell densities. This may also provide a rationale as to why some investigators observed a stimulatory action of TRH on Tshb expression in cultured pituitary cells from normal rats (54).
Acknowledgments
We are grateful to Dr David Klein for his help with animals, Daniel Abebe for his excellent assistance with the animal procedures, and to Vincent Schram for his help with the microscopy studies.
E-mail addresses of other authors include the following: P.B.-S., paulascj@gmail.com; M.K., mkucka@gmail.com; I.B., bjelobabai@mail.nih.gov; M.T., tomicm@mail.nih.gov; M.M.J., marija.janjic@nih.gov; and M.T.N. mtnunes@icb.usp.br.
This work was supported by the São Paulo Research Foundation (the Fundação de Amparo à Pesquisa do Estado de São Paulo Procedure 12/06643-8) through a grant to P.B.-S. and by a grant from the Intramural Research Program of the Eunice Kennedy Shiver National Institute of Child Health and Human Development, National Institutes of Health (to I.B., M.K., M.T., and S.S.S.). M.T.N. is the recipient of a fellowship from the Conselho Nacional de Desenvolvimento Científico e Tecnológico.
Disclosure Summary: The authors have nothing to disclose.
Footnotes
- ACTB
- β-actin protein expression
- [Ca2+]i
- intracellular calcium concentrations
- CGA
- glycoprotein α-subunit
- FS
- folliculostellate
- HS
- horse serum
- FBS
- fetal bovine serum
- PRL
- prolactin
- qRT-PCR
- quantitative RT-PCR
- TRHR1
- TRH receptor-1
- TSHB
- thyrotroph-specific β-subunit.
References
- 1. Stojilkovic SS, Tabak J, Bertram R. Ion channels and signaling in the pituitary gland. Endocr Rev. 2010;31(6):845–915. [DOI] [PMC free article] [PubMed] [Google Scholar]
- 2. Fauquier T, Guerineau NC, McKinney RA, Bauer K, Mollard P. Folliculostellate cell network: a route for long-distance communication in the anterior pituitary. Proc Natl Acad Sci USA. 2001;98(15):8891–8896. [DOI] [PMC free article] [PubMed] [Google Scholar]
- 3. Hodson DJ, Romano N, Schaeffer M, et al. Coordination of calcium signals by pituitary endocrine cells in situ. Cell Calcium. 2012;51(3–4):222–230. [DOI] [PubMed] [Google Scholar]
- 4. Le Tissier PR, Hodson DJ, Lafont C, Fontanaud P, Schaeffer M, Mollard P. Anterior pituitary cell networks. Front Neuroendocrinol. 2012;33(3):252–266. [DOI] [PubMed] [Google Scholar]
- 5. Mollard P, Hodson DJ, Lafont C, Rizzoti K, Drouin J. A tridimensional view of pituitary development and function. Trends Endocrinol Metab. 2012;23(6):261–269. [DOI] [PubMed] [Google Scholar]
- 6. Chin WW, Habener JF. Thyroid-stimulating hormone subunits: evidence from endoglycosidase-H cleavage for late presecretory glycosylation. Endocrinology. 1981;108(5):1628–1633. [DOI] [PubMed] [Google Scholar]
- 7. Chin WW, Maloof F, Habener JF. Thyroid-stimulating hormone biosynthesis. Cellular processing, assembly, and release of subunits. J Biol Chem. 1981;256(6):3059–3066. [PubMed] [Google Scholar]
- 8. Pennathur S, Madison LD, Kay TW, Jameson JL. Localization of promoter sequences required for thyrotropin-releasing hormone and thyroid hormone responsiveness of the glycoprotein hormone alpha-gene in primary cultures of rat pituitary cells. Mol Endocrinol. 1993;7(6):797–805. [DOI] [PubMed] [Google Scholar]
- 9. Pierce JG, Parsons TF. Glycoprotein hormones: structure and function. Annu Rev Biochem. 1981;50:465–495. [DOI] [PubMed] [Google Scholar]
- 10. Zoeller RT, Tan SW, Tyl RW. General background on the hypothalamic-pituitary-thyroid (HPT) axis. Crit Rev Toxicol. 2007;37(1–2):11–53. [DOI] [PubMed] [Google Scholar]
- 11. Shupnik MA, Greenspan SL, Ridgway EC. Transcriptional regulation of thyrotropin subunit genes by thyrotropin-releasing hormone and dopamine in pituitary cell culture. J Biol Chem. 1986;261(27):12675–12679. [PubMed] [Google Scholar]
- 12. Ashworth R, Hinkle PM. Thyrotropin-releasing hormone-induced intracellular calcium responses in individual rat lactotrophs and thyrotrophs. Endocrinology. 1996;137(12):5205–5212. [DOI] [PubMed] [Google Scholar]
- 13. Koenig RJ, Watson AY. Enrichment of rat anterior pituitary cell types by metrizamide density gradient centrifugation. Endocrinology. 1984;115(1):317–323. [DOI] [PubMed] [Google Scholar]
- 14. Alarid ET, Windle JJ, Whyte DB, Mellon PL. Immortalization of pituitary cells at discrete stages of development by directed oncogenesis in transgenic mice. Development. 1996;122(10):3319–3329. [DOI] [PubMed] [Google Scholar]
- 15. Yusta B, Alarid ET, Gordon DF, Ridgway EC, Mellon PL. The thyrotropin β-subunit gene is repressed by thyroid hormone in a novel thyrotrope cell line, mouse TαT1 cells. Endocrinology. 1998;139(11):4476–4482. [DOI] [PubMed] [Google Scholar]
- 16. Chiamolera MI, Sidhaye AR, Matsumoto S, et al. Fundamentally distinct roles of thyroid hormone receptor isoforms in a thyrotroph cell line are due to differential DNA binding. Mol Endocrinol. 2012;26(6):926–939. [DOI] [PMC free article] [PubMed] [Google Scholar]
- 17. Abe H, Murao K, Imachi H, et al. Thyrotropin-releasing hormone-stimulated thyrotropin expression involves islet-brain-1/c-Jun N-terminal kinase interacting protein-1. Endocrinology. 2004;145(12):5623–5628. [DOI] [PubMed] [Google Scholar]
- 18. Bargi-Souza P, Romano RM, Salgado Rde M, et al. Triiodothyronine rapidly alters the TSH content and the secretory granules distribution in male rat thyrotrophs by a cytoskeleton rearrangement-independent mechanism. Endocrinology. 2013;154(12):4908–4918. [DOI] [PubMed] [Google Scholar]
- 19. Goulart-Silva F, de Souza PB, Nunes MT. T3 rapidly modulates TSHβ mRNA stability and translational rate in the pituitary of hypothyroid rats. Mol Cell Endocrinol. 2011;332(1–2):277–282. [DOI] [PubMed] [Google Scholar]
- 20. Harris AR, Christianson D, Smith MS, Fang SL, Braverman LE, Vagenakis AG. The physiological role of thyrotropin-releasing hormone in the regulation of thyroid-stimulating hormone and prolactin secretion in the rat. J Clin Invest. 1978;61(2):441–448. [DOI] [PMC free article] [PubMed] [Google Scholar]
- 21. Hinkle PM, Gehret AU, Jones BW. Desensitization, trafficking, and resensitization of the pituitary thyrotropin-releasing hormone receptor. Front Neurosci. 2012;6:180. [DOI] [PMC free article] [PubMed] [Google Scholar]
- 22. Konaka S, Yamada M, Satoh T, et al. Expression of thyrotropin-releasing hormone (TRH) receptor mRNA in somatotrophs in the rat anterior pituitary. Endocrinology. 1997;138(2):827–830. [DOI] [PubMed] [Google Scholar]
- 23. Persani L. Hypothalamic thyrotropin-releasing hormone and thyrotropin biological activity. Thyroid. 1998;8(10):941–946. [DOI] [PubMed] [Google Scholar]
- 24. Beck-Peccoz P, Amr S, Menezes-Ferreira MM, Faglia G, Weintraub BD. Decreased receptor binding of biologically inactive thyrotropin in central hypothyroidism. Effect of treatment with thyrotropin-releasing hormone. N Engl J Med. 1985;312(17):1085–1090. [DOI] [PubMed] [Google Scholar]
- 25. Faglia G, Bitensky L, Pinchera A, et al. Thyrotropin secretion in patients with central hypothyroidism: evidence for reduced biological activity of immunoreactive thyrotropin. J Clin Endocrinol Metab. 1979;48(6):989–998. [DOI] [PubMed] [Google Scholar]
- 26. Taylor T, Weintraub BD. Thyrotropin (TSH)-releasing hormone regulation of TSH subunit biosynthesis and glycosylation in normal and hypothyroid rat pituitaries. Endocrinology. 1985;116(5):1968–1976. [DOI] [PubMed] [Google Scholar]
- 27. Pekonen F, Carayon P, Amr S, Weintraub BD. Heterogeneous forms of thyroid-stimulating hormone in mouse thyrotropic tumor and serum: differences in receptor-binding and adenylate cyclase-stimulating activity. Horm Metab Res. 1981;13(11):617–620. [DOI] [PubMed] [Google Scholar]
- 28. Weintraub BD, Stannard BS, Meyers L. Glycosylation of thyroid-stimulating hormone in pituitary tumor cells: influence of high mannose oligosaccharide units on subunit aggregation, combination, and intracellular degradation. Endocrinology. 1983;112(4):1331–1345. [DOI] [PubMed] [Google Scholar]
- 29. Rabeler R, Mittag J, Geffers L, et al. Generation of thyrotropin-releasing hormone receptor 1-deficient mice as an animal model of central hypothyroidism. Mol Endocrinol. 2004;18(6):1450–1460. [DOI] [PubMed] [Google Scholar]
- 30. Kim KK, Song SB, Kang KI, Rhee M, Kim KE. Activation of the thyroid-stimulating hormone β-subunit gene by LIM homeodomain transcription factor Lhx2. Endocrinology. 2007;148(7):3468–3476. [DOI] [PubMed] [Google Scholar]
- 31. Nakajima Y, Yamada M, Taguchi R, et al. NR4A1 (Nur77) mediates thyrotropin-releasing hormone-induced stimulation of transcription of the thyrotropin β gene: analysis of TRH knockout mice. PLoS One. 2012;7(7):e40437. [DOI] [PMC free article] [PubMed] [Google Scholar]
- 32. Ohba K, Sasaki S, Matsushita A, et al. GATA2 mediates thyrotropin-releasing hormone-induced transcriptional activation of the thyrotropin β gene. PLoS One. 2011;6(4):e18667. [DOI] [PMC free article] [PubMed] [Google Scholar]
- 33. Kretschmannova K, Kucka M, Gonzalez-Iglesias AE, Stojilkovic SS. The expression and role of hyperpolarization-activated and cyclic nucleotide-gated channels in endocrine anterior pituitary cells. Mol Endocrinol. 2012;26(1):153–164. [DOI] [PMC free article] [PubMed] [Google Scholar]
- 34. Livak KJ, Schmittgen TD. Analysis of relative gene expression data using real-time quantitative PCR and the 2[δ[delta C(T)] method. Methods. 2001;25(4):402–408. [DOI] [PubMed] [Google Scholar]
- 35. Pfaffl MW. A new mathematical model for relative quantification in real-time RT-PCR. Nucleic Acids Res. 2001;29(9):e45. [DOI] [PMC free article] [PubMed] [Google Scholar]
- 36. He ML, Zemkova H, Koshimizu TA, Tomic M, Stojilkovic SS. Intracellular calcium measurements as a method in studies on activity of purinergic P2X receptor channels. Am J Physiol Cell Physiol. 2003;285(2):C467–C479. [DOI] [PubMed] [Google Scholar]
- 37. Cox DP, White CC, Kavanagh TJ. Fluorescent assessment of intracellular calcium in individual cells. Methods Mol Biol. 2011;758:239–251. [DOI] [PubMed] [Google Scholar]
- 38. Izumi S, Stojilkovic SS, Catt KJ. Calcium mobilization and influx during the biphasic cytosolic calcium and secretory responses in agonist-stimulated pituitary gonadotrophs. Arch Biochem Biophys. 1989;275(2):410–428. [DOI] [PubMed] [Google Scholar]
- 39. Toth ZE, Mezey E. Simultaneous visualization of multiple antigens with tyramide signal amplification using antibodies from the same species. J Histochem Cytochem. 2007;55(6):545–554. [DOI] [PubMed] [Google Scholar]
- 40. Li S, Bjelobaba I, Yan Z, Kucka M, Tomic M, Stojilkovic SS. Expression and roles of pannexins in ATP release in the pituitary gland. Endocrinology. 2011;152(6):2342–2352. [DOI] [PMC free article] [PubMed] [Google Scholar]
- 41. Christoffolete MA, Ribeiro R, Singru P, et al. Atypical expression of type 2 iodothyronine deiodinase in thyrotrophs explains the thyroxine-mediated pituitary thyrotropin feedback mechanism. Endocrinology. 2006;147(4):1735–1743. [DOI] [PubMed] [Google Scholar]
- 42. Costa-e-Sousa RH, Hollenberg AN. Minireview: the neural regulation of the hypothalamic-pituitary-thyroid axis. Endocrinology. 2012;153(9):4128–4135. [DOI] [PMC free article] [PubMed] [Google Scholar]
- 43. Tong YA, Zhao HF, Labrie F, Pelletier G. Ontogeny of prolactin mRNA in the rat pituitary gland as evaluated by in situ hybridization. Mol Cell Endocrinol. 1989;67(1):11–16. [DOI] [PubMed] [Google Scholar]
- 44. Van Goor F, Zivadinovic D, Martinez-Fuentes AJ, Stojilkovic SS. Dependence of pituitary hormone secretion on the pattern of spontaneous voltage-gated calcium influx. Cell type-specific action potential secretion coupling. J Biol Chem. 2001;276(36):33840–33846. [DOI] [PubMed] [Google Scholar]
- 45. Kucka M, Bjelobaba I, Clokie SJ, Klein DC, Stojilkovic SS. Female-specific induction of rat pituitary dentin matrix protein-1 by GnRH. Mol Endocrinol. 2013;27(11):1840–1855. [DOI] [PMC free article] [PubMed] [Google Scholar]
- 46. Costa-e-Sousa RH, Astapova I, Ye F, Wondisford FE, Hollenberg AN. The thyroid axis is regulated by NCoR1 via its actions in the pituitary. Endocrinology. 2012;153(10):5049–5057. [DOI] [PMC free article] [PubMed] [Google Scholar]
- 47. Carr FE, Galloway RJ, Reid AH, et al. Thyrotropin-releasing hormone regulation of thyrotropin β-subunit gene expression involves intracellular calcium and protein kinase C. Biochemistry. 1991;30(15):3721–3728. [DOI] [PubMed] [Google Scholar]
- 48. Hodson DJ, Molino F, Fontanaud P, Bonnefont X, Mollard P. Investigating and modelling pituitary endocrine network function. J Neuroendocrinol. 2010;22(12):1217–1225. [DOI] [PubMed] [Google Scholar]
- 49. Sanchez-Cardenas C, Hernandez-Cruz A. GnRH-Induced [Ca2+]i-signalling patterns in mouse gonadotrophs recorded from acute pituitary slices in vitro. Neuroendocrinology. 2010;91(3):239–255. [DOI] [PubMed] [Google Scholar]
- 50. Waite E, Lafont C, Carmignac D, et al. Different degrees of somatotroph ablation compromise pituitary growth hormone cell network structure and other pituitary endocrine cell types. Endocrinology. 2010;151(1):234–243. [DOI] [PubMed] [Google Scholar]
- 51. Denef C. Paracrinicity: the story of 30 years of cellular pituitary crosstalk. J Neuroendocrinol. 2008;20(1):1–70. [DOI] [PMC free article] [PubMed] [Google Scholar]
- 52. Hodson DJ, Schaeffer M, Romano N, et al. Existence of long-lasting experience-dependent plasticity in endocrine cell networks. Nat Commun. 2012;3:605. [DOI] [PMC free article] [PubMed] [Google Scholar]
- 53. Bonnefont X, Lacampagne A, Sanchez-Hormigo A, et al. Revealing the large-scale network organization of growth hormone-secreting cells. Proc Natl Acad Sci USA. 2005;102(46):16880–16885. [DOI] [PMC free article] [PubMed] [Google Scholar]
- 54. Chowdhury I, Chien JT, Chatterjee A, Yu JY. Effects of leptin and neuropeptide-Y on transcript levels of thyrotropin β and common α subunits of rat pituitary cells in vitro. Life Sci. 2004;75(24):2897–2909. [DOI] [PubMed] [Google Scholar]