Abstract
The effect of high pressure on the OH stretch of dilute HOD in D2O was examined using high pressure FTIR. It was found that at pressures directly above the ice VI to ice VII transition, ice VII displays a splitting in the OH absorption indicative of differing hydrogen bonding environments. This result is contrary to published structures of ice VII in which each OH oscillator should experience an identical electronic environment. The anomalous band was found to decrease in absorbance and finally disappear at ~43.0 kbar. In addition, the pressure response of the amide I′ and II′ bands of three small model peptides was examined. Analysis of these bands’ response to increased pressure indicates significant side chain dependence of their structural rearrangement, which may play a role in the composition of full length proteins of barophilic organisms.
Index Headings: FTIR, OH stretch, water structure, ice VII, ice polymorphs, high pressure, barophiles
Introduction
The effect of pressure on liquids and solids has long been of interest to researchers. In the case of water, pressure is known to cause crystallization of the liquid into forms not observed in natural settings on Earth other than as inclusions in some minerals, including diamonds.1 These high pressure ice forms are compelling for the reason that no other single molecule is known to exist in so many different solid states. Also, some of the ice forms have recently come under renewed investigation for the reason that they may indeed exist naturally on icy moons or on other planets and may play an important role in the thermodynamics of those bodies.2
The effects of high pressures are also of great interest in the realm of biochemistry. While the majority of proteins irreversibly denature at pressures of a few kbar, there are numerous examples of proteins that maintain their structures at well over 10 kbar of pressure.3–4 Likewise, barophilic organisms have been collected in even the deepest parts of the ocean and below the ocean floor, and many microbes are capable of surviving and growing at pressures of over 10 kbar.5 As more research is done on deep sea environments it is becoming clear that barophilic organisms may be the rule rather than the exception, and that life may exist and even thrive far below even the deepest parts of the ocean. Even some organisms that have not evolved to thrive at high pressures have been found to survive exposure to very extreme pressures,5 and other organisms require high pressures in order to survive.6–7
Though the pressures at which living organisms have thus far been found are relatively small compared to those that can be achieved experimentally, the effects of extremely high pressures on biomolecular structure and function are still very interesting because they may help us in defining the theoretical boundaries within which amino acid and liquid water based life can exist. While most of the pressure/temperature phase diagram of water up to several hundred K is either gaseous or solid, the liquid water regime is still rather large, and as of now there are still no known regions of the liquid water phase where life is known to be chemically impossible.
As our laboratory has interests in both water structure and biomolecular structure and function, in the present study we have recorded high quality Fourier transform infrared (FTIR) spectra of the OH stretch of ices VI and VII in a dilute mixture of HOD in D2O. Though spectra of these ices have appeared in the literature in the past,8–12 the modern FTIR instrument yields considerably more spectral detail than was previously available. In addition, we have examined the effect of increasing hydrostatic pressure on the amide I′ and II′ spectra of three simple, blocked peptide derivatives that have been studied extensively utilizing other theoretical and experimental methods, N-acetyl-glycine-methylamide (NAGMA), N-acetyl-L-leucine-N′-methylamide (NALMA), and N-acetyl-L-alanine-N′-methylamide (NAAMA).13–18 Though Measey et al. determined the effect of side chain identity on the amide I′ spectra of numerous dipeptides,19 there does not appear to be any systematic examination of the pressure and side chain identity dependence of the amide I′ and II′ bands as is presented here.
Materials and Methods
Materials
99.98% D2O was obtained from Sigma-Aldrich and used for preparing all samples. NAGMA and NALMA were also purchased from Sigma-Aldrich. NAAMA was purchased from Chem-Impex International, Inc. Before experimental use, each of the peptide derivatives was deuterated by being dissolved in a large excess of D2O followed by rapid freezing and lyophilization. Barium sulfate (99.998% purity) was purchased from Sigma-Aldrich as well.
The Diacell® LeverDAC-Mini diamond anvil cell (DAC) was purchased from EasyLab Technologies Ltd. The DAC housing was fitted to a 3x focusing apparatus by Bruker Optics, which was then installed and aligned in our Bruker IFS66 FTIR instrument (Bruker Optics, Brookline, MA). Fifty μm thick stainless steel sheets used for making gaskets for the DAC were purchased from Advent Research Materials Ltd. MATLAB 7.6 (Mathworks, Natick, MA) was used for plotting, and final figures were assembled using Adobe Illustrator CS4.
Sample Preparation
Samples of the small peptide derivatives were prepared simply by dissolving the already deuterated and lyophilized powders in D2O to yield final concentrations of 0.25 m. This particular concentration was chosen to yield strong absorption of both the amide I′ and amide II′ vibrational bands.
The DAC was assembled in an actively dried room (relative humidity < 30%) using a long working range microscope with 40x magnification. Gaskets for the DAC were made by punching 600 μm wide holes in 50 μm thick stainless steel sheets and then trimming the gaskets to a size convenient for placing in the DAC. OH stretch spectra were obtained at high pressure using the very small amount of H contributed to the samples by atmospheric exchange in the time that it took to assemble the DAC after the sample was pipetted into the sample hole of the gasket. OH stretch spectra were collected at atmospheric pressure using a 95% D2O/5% H2O solution and calcium fluoride windows. The sulfate stretch band of a fine barium sulfate powder placed in the sample hole before the sample was added was used to monitor pressure inside of the DAC.20
Spectra Collection and Processing
All spectra were collected in a Bruker IFS66 FTIR instrument purged with dry nitrogen and equipped with a liquid nitrogen cooled MCT detector. All high pressure spectra were collected at ambient temperature, approximately 22 °C. The OPUS 5.0 software program (Bruker Optics, Brookline, MA) was used to collect and process spectra. All spectra were collected in transmission mode, at 2 cm−1 resolution. A final, raw spectrum was generated by coadding the interferograms of 512 scans. All spectra were corrected for H2O atmospheric contribution, baseline corrected, and converted to absorbance. The liquid water and some of the amide I′ spectra were normalized to assist in visual comparison. Second-degree Savitsky-Golay smoothing was applied to some of the spectra. A 25 point span was used for the liquid OH stretch spectra, a 5 point span was used for the high pressure ice OH stretch spectra, and a 5 point span was used for the atmospheric pressure ice. Smoothing was not used at all for the amide I′ and II′ spectra.
Results
OH Stretch Spectra
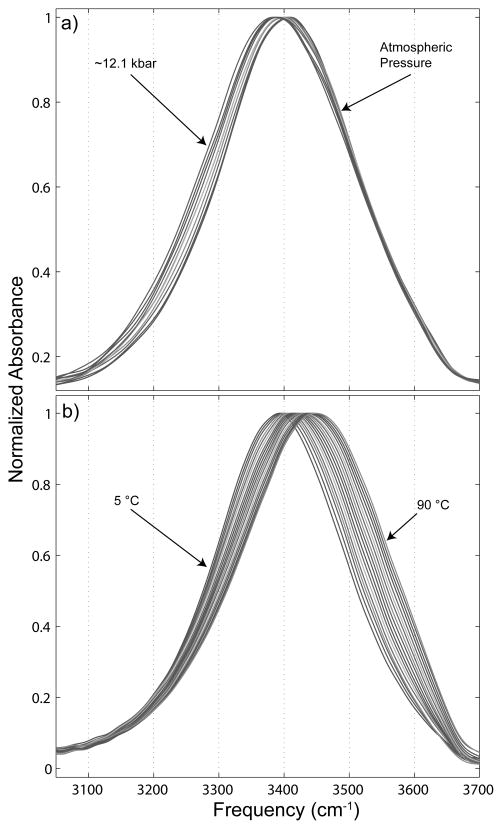
The liquid water OH stretch spectra are shown in Figure 1. In Figure 1a we show the response of the OH stretch spectrum of liquid water to the application of hydrostatic pressure, and in Figure 1b the influence of temperature on the same spectrum at atmospheric pressure. Unlike the application of increased temperature, which has the effect of broadening the OH stretch spectrum considerably and shifting it to higher frequency, increased hydrostatic pressure broadens the spectrum only slightly and instead shifts it to lower frequency. It can also be noted that increased pressure, like some solutes,21 has very little effect on the high frequency portion of the spectrum. At the highest pressures obtained before the pressure-induced transition to ice VI the OH stretch spectrum is shifted to an even lower frequency than that which can be brought on by lowering the temperature of the liquid state.
Figure 1.
Normalized OH stretch spectra of liquid water under the influence of a) hydrostatic pressure and b) temperature, applied at atmospheric pressure.
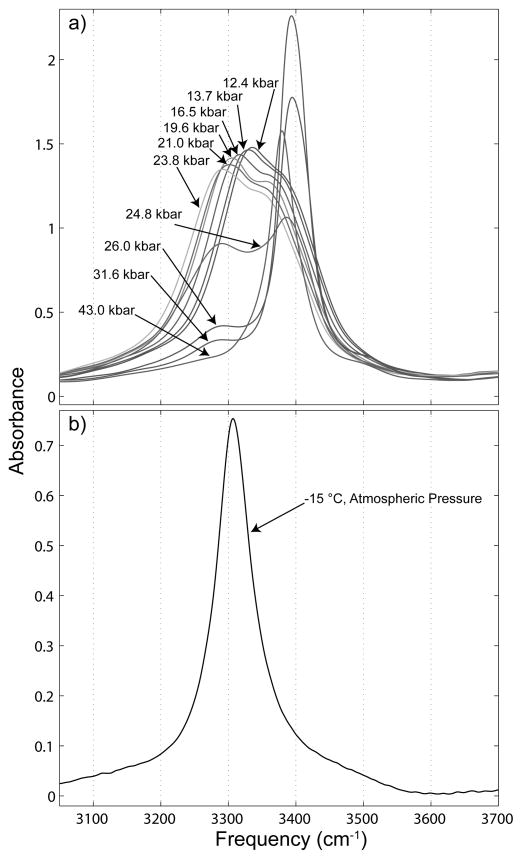
OH stretch spectra of ices are shown in Figure 2. In Figure 2a we show the formation of ice VI and its transition into ice VII, and in Figure 2b ice Ih at atmospheric pressure and −15 °C is shown for comparison. Ice VI has a strong and broad absorption with evidence of multiple H-bonding species, which overlaps but otherwise has little in common with ice Ih at 3306 cm−1. The ice VI spectrum does not appear to change much qualitatively with increased pressure, aside from a slight decrease in absorbance and red shift of the entire spectrum. The ice VII spectrum, however, alters considerably with increased pressure. The ice VII OH stretch spectrum starts out with two separated bands upon transition from ice VI, with one band being centered at ~3380 cm−1 and the other at ~3290 cm−1. As pressure is increased above the transition point the band at ~3290 cm−1 decreases in absorbance until it disappears entirely from the spectrum, at approximately 43.0 kbar. The band at ~3380 cm−1 first increases in absorbance then decreases in absorbance as pressure is increased, and the band shifts slightly to lower frequency with increasing pressure.
Figure 2.
OH stretch spectra of water ices under the influence of a) increasing pressure at ~22 °C and b) at atmospheric pressure and −15 °C
To investigate the possibility that both ices VI and VII existed in the DAC at pressures right above the ice VI to VII transition we generated difference spectra to attempt removal of a pure ice VI component. Each of the putative ice VII spectra (at 24.8 kbar, 26.0 kbar, and 31.6 kbar) had their ~3290 cm−1 band normalized to the 3290 cm−1 band of ice VI at 23.8 kbar. This normalization was then followed by subtraction of the 23.8 kbar ice VI spectrum. The difference spectra as generated are shown in Figure 3.
Figure 3.
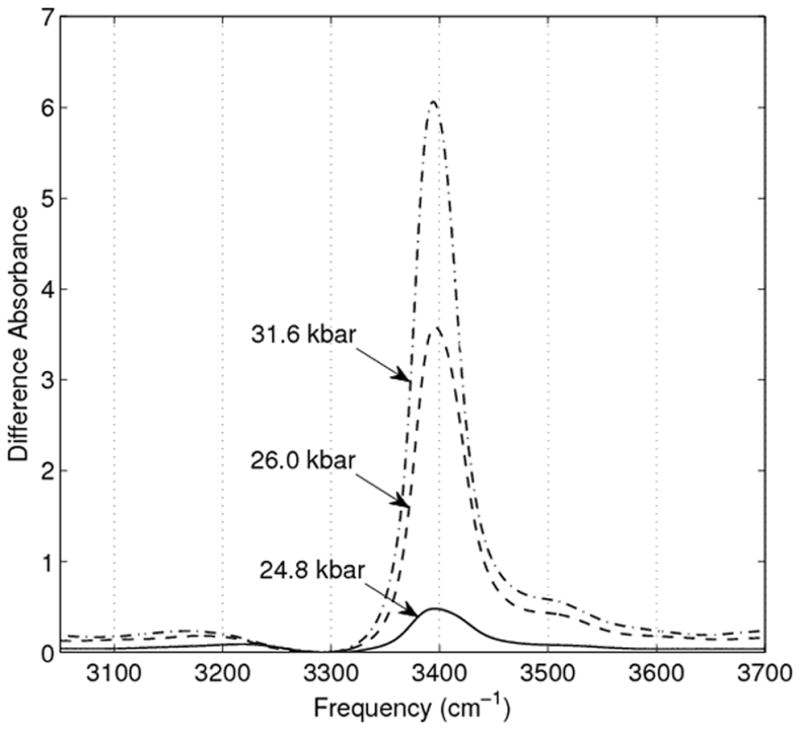
OH stretch difference spectra generated using the method described in the Results section. In short, the ~3290 cm−1 bands of the presumed ice VII spectra were normalized to the 3290 cm−1 of the highest pressure (23.8 kbar) pure ice VI spectrum, which was then subtracted from the normalized spectra.
In order to be certain that the barium sulfate pressure marker was not affecting the spectra we also collected ice VI to VII transition spectra in the absence of barium sulfate. Though we could not monitor the pressure of the sample without an internal pressure marker present, the way the OH stretch spectra (not shown) evolved with increased pressure was identical to what we observed for the samples including barium sulfate.
Amide Spectra
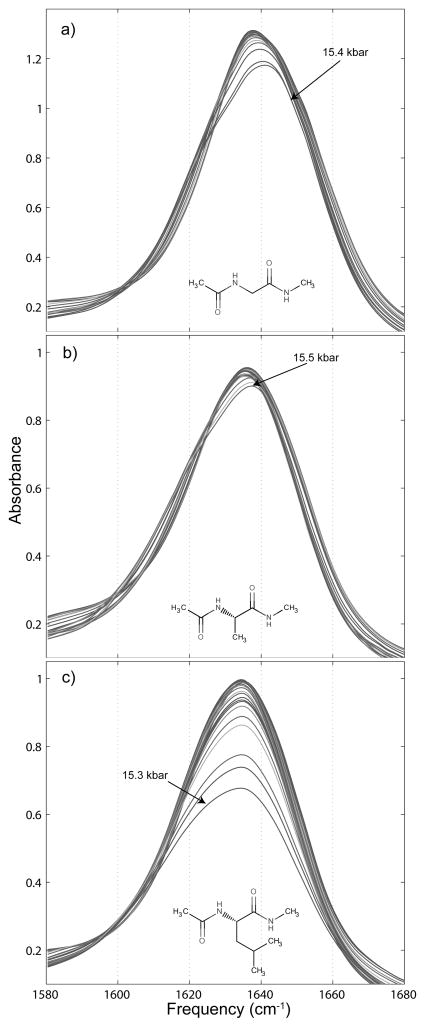
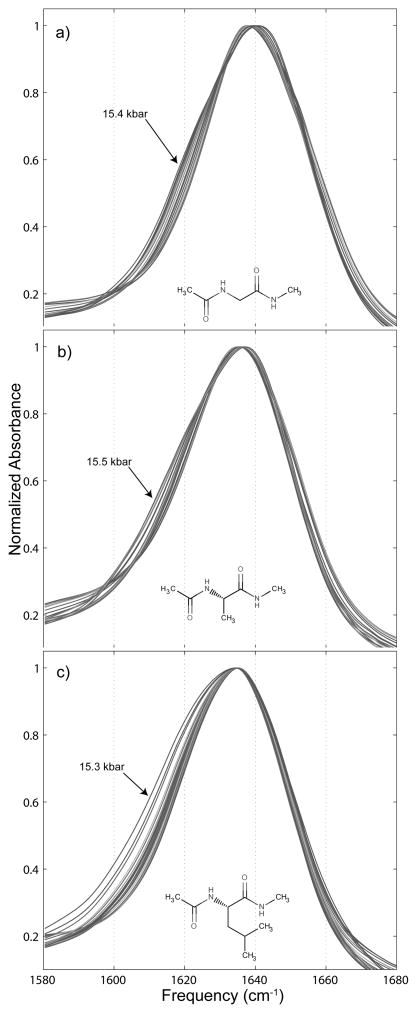
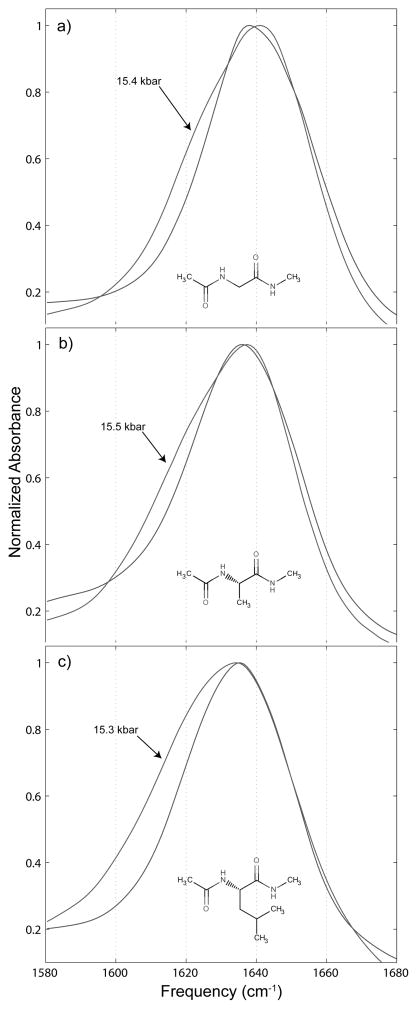
Amide I′ spectra are shown in Figures 4 and 5. The amide I′ spectra of all three peptide derivatives are similar, but with some important differences. We note that for both NAGMA and NAAMA amide I′ spectra, the peak frequency shifts very slightly (2 to 3 cm−1) to higher frequency with increased pressure while the peak frequency remains static for NALMA. Also, though the amide I′ band of NAGMA and NAAMA both show a small decrease in absorbance with increased pressure, the same vibrational band in NALMA exhibits peak absorbance decreased by over a third at the highest pressure, before the transition to ice VI.
Figure 4.
Variation of the amide I′ spectra of small peptide derivatives under the influence of increased hydrostatic pressure. a) contains the pressure dependent shift for 0.25 m N-acetyl-glycine-methylamide, b) for 0.25 m N-acetyl-L-alanine-N′-methylamide, and c) for 0.25 m N-acetyl-L-leucine-N′-methylamide.
Figure 5.
Changes in the normalized amide I′ spectra of small peptide derivatives under the influence of hydrostatic pressure. a) contains the pressure dependent shift for 0.25 m N-acetyl-glycine-N′-methylamide, b) for 0.25 m N-acetyl-L-alanine-N′-methylamide, and c) for 0.25 m N-acetyl-L-leucine-N′-methylamide.
Each of the molecules’ amide I′ bands broaden with increased pressure as well, with the low frequency side of the spectrum accounting for most of the broadening. The full width at half maximum (fwhm) of the NAGMA amide I′ band goes from 39.6 cm−1 at atmospheric pressure to 43.1 cm−1 at 15.4 kbar, the highest pressure at which a spectrum was taken before the ice VI phase transition was reached. For NAAMA, the fwhm goes from 41.7 cm−1 at atmospheric pressure to 44.7 cm−1 at the highest liquid-water pressure reached, 15.5 kbar. NALMA exhibits the largest broadening of the three molecules, with its amide I′ fwhm going from 40.6 cm−1 at atmospheric pressure to 49.8 cm−1 at 15.3 kbar, the highest pressure at which the solution was liquid. These increases with pressure in the amide I′ fwhm of NAGMA, NAAMA, and NALMA are 8.9%, 7.2%, and 22.7% respectively.
As can be seen in Figure 6, which shows only the highest and lowest pressure amide I′ bands for each peptide, there is considerable splitting of the bands, owing to each peptide having two carbonyl groups. This splitting grows with pressure as the underlying bands shift relative to one another.
Figure 6.
Amide I′ spectra taken at atmospheric pressure (the unlabeled spectrum) and the highest pressure spectrum taken before the water liquid to ice VI phase change (the pressure labeled spectrum) for a) 0.25 m N-acetyl-glycine-methylamide, b) 0.25 m N-acetyl-L-alanine-N′-methylamide, and c) 0.25 m N-acetyl-L-leucine-N′-methylamide.
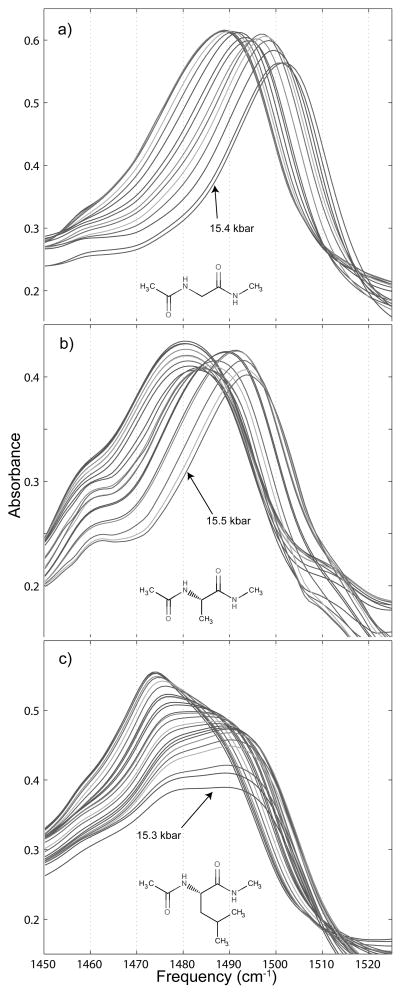
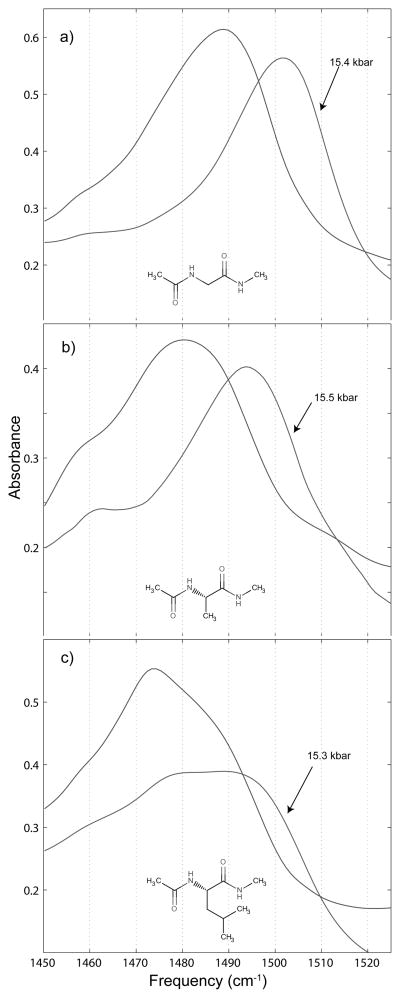
The amide II′ spectra of the three peptide derivatives are shown in Figures 7 and 8. This band is somewhat contaminated by the absorption of the HOD bending vibration at approximately 1460 cm−1, but this band only absorbs at the low frequency edge of the amide II′ spectrum, is relatively narrow, and undergoes only a very small shift to higher frequency with increased pressure. Attempts to subtract the HOD band only served to obscure and distort the amide II′ data, and since the band can be readily subtracted visually by the reader it was simply left alone and the spectrum is shown in an unmodified form.
Figure 7.
Variation of the amide II′ spectra of small peptide derivatives under the influence of hydrostatic pressure. a) contains the pressure dependent shift for 0.25 m N-acetyl-glycine-methylamide, b) for 0.25 m N-acetyl-L-alanine-N′-methylamide, and c) for 0.25 m N-acetyl-L-leucine-N′-methylamide.
Figure 8.
Amide II′ spectra taken at atmospheric pressure (the unlabeled spectrum) and the highest pressure spectrum taken before the water liquid to ice VI phase change (the pressure labeled spectrum) for a) 0.25 m N-acetyl-glycine-methylamide, b) 0.25 m N-acetyl-L-alanine-N′-methylamide, and c) 0.25 m N-acetyl-L-leucine-N′-methylamide.
The amide II′ spectra show a great deal of difference amongst the three peptide derivatives. Each of the bands shifts to higher frequency with increased pressure, but the NAAMA spectra are red-shifted with respect to the NAGMA spectra by almost 10 cm−1. Likewise, the peak frequency of NALMA is shifted to even lower frequency than that of NAAMA. All three of the peptide amide II′ bands are asymmetrical, and their broad absorption clearly results from the presence of multiple spectroscopic species. The distribution of those species shows substantial pressure dependence. In addition, the NAGMA and NAAMA bands narrow as pressure is increased while the NALMA band broadens.
Discussion
A. OH Stretch Spectra
The results presented in this study indicate that increased hydrostatic pressure can have interesting and somewhat unexpected effects on the structure of small peptides, dependent on the side chain, and that infrared spectroscopy is a useful tool for probing these structural changes. The results also show OH stretch infrared spectra that point to a change in the H-bonding pattern of ice VII as pressure is increased above the ice VI to VII transition point.
Ices VI (Figure 9) and VII (Figure 10), which are easily reached at ambient temperature using a DAC, are both known from scattering experiments and theoretical studies to be composed of two distinct, interpenetrating networks. These networks do not directly bond to one another and instead form so called “self clathrates.”22 For the case of ice VI, each of these interpenetrating networks is composed of hexamers, and the equatorial water molecules of the hexamer serve to connect the networks. This structural motif yields multiple different environments for the water molecules in the crystal lattice, and gives rise to four different types of H-bond, with HOO angles of 12.30°, 12.12°, 2.27°, and 14.28°, and occupancy of 20%, 20%, 20%, and 40% respectively (calculated using Kuo et al’s data).23 For each of the ice VI H-bond types, the other water geometry parameters of interest are very consistent. The OH bond length for each type of ice VI H-bond is about 0.99 Å and the O-O separation for each type is approximately 2.8 Å. Incidentally, these values are very close to those found computationally by our laboratory to be the minimum energy configuration for the gaseous water dimer.24
Figure 9.
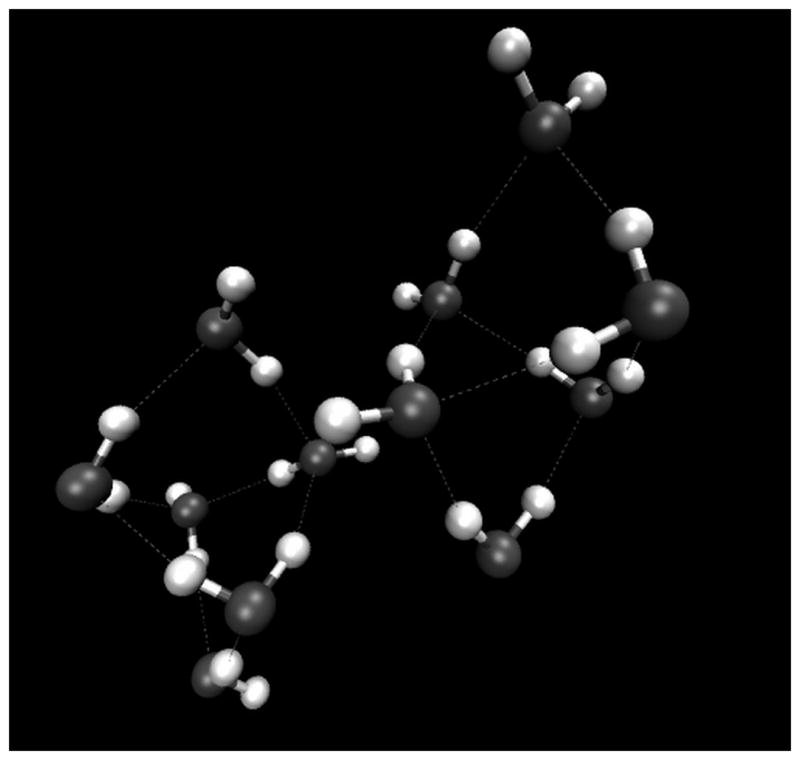
Figure depicting the H-bonding geometries in the ice VI crystal lattice. Figure generated with data provided by Dr. Martin Chaplin.
Figure 10.
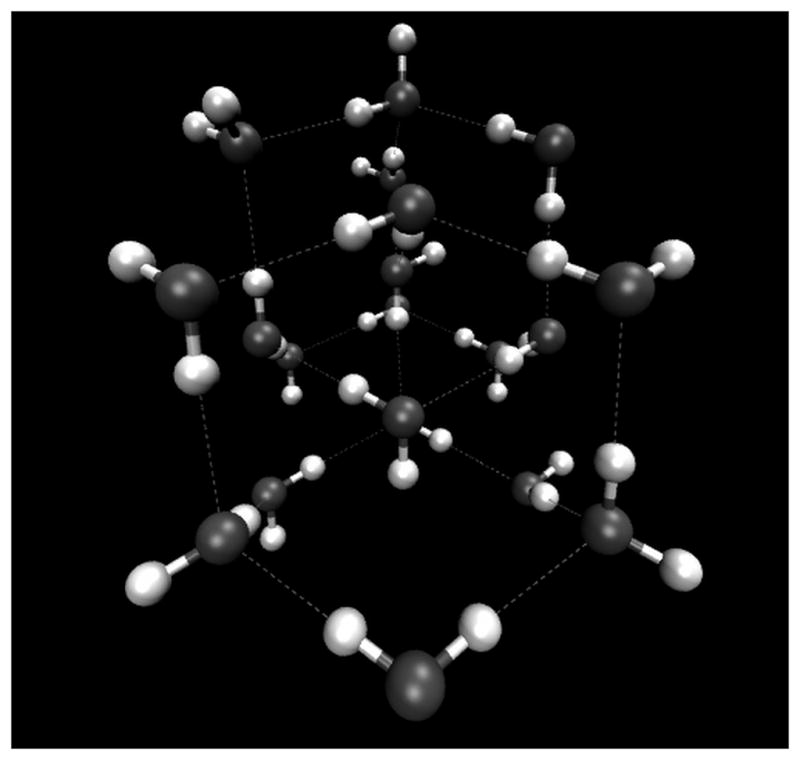
The interpenetrating cubic lattices of the ice VI crystal lattice. This figure shows the protons as being ordered while in the ice VII crystal they are actually disordered. Figure generated with data provided by Dr. Martin Chaplin.
While ice VII shares some of the structural features of ice VI, such as interpenetrating water networks with no H-bonds between them, it also has some significant differences. For example, ice VII has a cubic unit cell (ice VI has a tetragonal unit cell), and it has only two water molecules per unit cell (ice VI has 10 water molecules per unit cell). Though the cubic crystal structure of ice VII should mean that each water molecule in the ice VII lattice experiences the same local environment, this turns out not be the case. In fact, there is ample evidence for site disorder in both the O and H/D positions of ice VII.25–26
Though diffraction studies are well suited to studying crystalline structures such as ices, varying data quality and the uncertainty inherent in refinement techniques and models leave the door open to various structural interpretations. Powder diffraction requires the use of quenched ice samples, which may be of questionable value for some high pressure ices. Also, the vast majority of ice structure data is gathered for ices well into their region of stability, which may minimize or miss entirely metastable states or structural defects that exist only near the phase transition. While FTIR as an experimental technique is wholly unsuited to the sort of overall structural determinations that are possible with diffraction studies, properly designed vibrational spectroscopy experiments can yield valuable information on the local environment of a given oscillator. Due to the very small amount of H present in the water samples we prepared (as indicated by the ratio of the DOD bending mode to the HOD bending mode, and the complete lack of an HOH bending absorption), the OH stretching vibration is almost completely decoupled from other OH oscillators, making it a sensitive probe to the local electronic environment.21,27–32 Figure 2 indicates that for ice VI, and ice VII at pressures below about 43 kbar, there clearly exist multiple, distinct H-bonding species.
The OH stretch spectra of ice VI show an overall shift to lower frequency with increased pressure, which could be expected. As the crystal packs into a progressively smaller volume, individual H-bonds become stronger, and we observe a red shift much like that observed when the temperature of ice Ih is lowered. The stark heterogeneity in the H-bonding environment in the ice VI crystal is directly reflected in the infrared spectra shown in Figure 2a, and the evidence of multiple populations of H-bond oscillators is unsurprising given what is known about the types of H-bond in ice VI.23 At 24.8 kbar the spectra change significantly, indicating the transition to ice VII. As pressure is further increased, the band at ~3290 cm−1 in the ice VII spectra sharply decreases in absorbance, finally disappearing entirely by the time a pressure of 43.0 kbar is reached.
The very narrow and symmetric 43.0 kbar ice spectrum is clearly indicative of a very homogeneous H-bonding structure, but the presence of the distinct band at 3290 cm−1 in the lower pressure ice VII spectra points to multiple H-bonding species existing within the ice VII crystal. The disappearance of the band at ~3290 cm−1 would appear to indicate some H-bond reorganization occurs as pressure increases above the ice VI to VII transition point, such that by the time 43.0 kbar is reached, the spectrum is dominated by the single band at ~3380 cm−1. The band at ~3380 cm−1 resembles the spectrum of ice Ih, shown in Figure 2b, except that the ice VII band is considerably narrower (fwhm 53.9 cm−1 for ice VII at 43.0 kbar, 66.1 cm−1 for ice Ih at atmospheric pressure and −15 °C).
In addition to providing evidence for a heretofore unknown H-bond rearrangement in ice VII at low pressures, these results also reaffirm the utility of infrared spectroscopy of the OH stretch spectrum for studying H-bond structure, as the differing H-bond environments are unambiguously reflected in the spectra. We are uncertain at this point exactly what sorts of H-bond rearrangements take place at these relatively low pressures to affect such a change on the ice VII spectrum. Though proton ordering is known to increase in ice VII up to about 130 kbar,33 it seems unlikely that proton ordering alone would account for the change from two such energetically separated H-bonding states to one. Another possibility is a change in the degree of disorder in the O lattice sites. There may be some portion of O displacements that is populated at relatively low ice VII pressures but vanishes quickly as pressure on the crystal is raised.
Of course the fact that the spectra we have recorded could reasonably indicate a hydrogen bonding defect in ice VII does not mean that it is so. To test the idea that the spectra we recorded might be a mixture of ices VI and VII, we generated difference spectra that were formed by subtracting the highest pressure ice VI spectrum from the putative ice VII spectra. The method used for subtraction is discussed in the Results section above. We reasoned that if ice VI existed in the cell alongside ice VII, and that it persisted alongside ice VII due to pressure inhomogeneity within the cell, then no matter their proportions one should be able to subtract the ice VI contribution from the total spectrum, since the ice mixture spectra should simply add together. This methodology assumes that the ice VI spectrum we recorded and used for subtraction is invariant as the cell pressure is increased. Given that ice VI under these conditions must be on the verge of transition to ice VII the assumption that the ice VI spectrum has already undergone its maximal pressure induced red shift seems reasonable. The asymmetric and distorted difference spectra, as shown in Figure 3, indicate that if what we observed was in fact a mixture of ices VI and VII then their spectra must combine in a non-additive way. While this would certainly be possible for a sample composed of isotopically homogeneous water, our use of an extremely small fraction of hydrogen compared to deuterium means that the OH oscillators are almost completely decoupled from one another. In a mixture of this sort the ices would necessarily be completely insensitive to one another. Since the ice VI band is such an ideal candidate for subtraction, the significantly misshapen spectra derived upon subtraction of the ice VI band are strong evidence that what we observed was not in fact simply a mixture of coexisting ice states.
In addition, we have also considered the potential for a large pressure gradient within the diamond anvil cell. Since any ice VI in the cell must necessarily experience a lower local pressure than that experienced by the ice VII, we decided to take a closer look at the barium sulfate stretch peak which we used as a pressure marker. Sulfate groups at 23.8 kbar and 31.6 kbar would absorb approximately 3 cm−1 apart, however, our sulfate stretch spectra (not shown) indicate absolutely no hint of splitting or the existence of a shoulder. Given the pressure range over which we observe the ice VI-like band persist, and the inherent narrowness of the sulfate stretch band, it is rather unlikely that such a huge pressure gradient exists within the cell. We cannot, however, rule out the possibility that ice VI only remains in the cell in volumes devoid of any barium sulfate as the net pressure is increased to ice VII levels.
On the matter of detecting the ice VII structural anomaly we have proposed using other experimental techniques, diffraction studies in particular can perform quite well in determining interatomic distances of chemical species, but unambiguously reconstructing the exact structure of the H-bond network of an ice using only diffraction data is simply not possible today. A variation of 25 degrees, for example, in the angle of a subset of H-bonds is energetically and structurally very significant, but this change would only show up as a tenth of an Å change in H---O distance, or hundredths of an Å if the O-O distance is allowed to contract very slightly, as the diffraction data for all the ices quite clearly shows is possible. Diffraction data simply is not precise enough to determine length changes on the proposed scale, and given the reported widths of the distributions of OO, OH, and HH distances in the ices, it is difficult to envision diffraction techniques identifying a structural defect that is barely reflected at all in interatomic distances. The OH stretch of water, on the other hand, is extremely sensitive to changes in H-bond strength dictated by the H-bond angle of a local oscillator.
B. Amide Spectra of the NA*MA Peptide Derivatives
The amide I′ spectra of the peptide derivatives studied offer interesting clues as to the structural evolution that occurs as the molecules are exposed to increasing pressures via the surrounding solvent. One could reasonably expect that the three molecules’ amide I′ spectra would have very similar response to increased pressure, since this absorption is due almost entirely to localized carbonyl stretching, but instead we observe clear differences. In addition to shifting of the band depending on the particular side group present, the amount of broadening appears to depend on what groups are attached to the Cα carbon. Even the simple addition of a methyl group not only shifts the band to the red, but also changes the electronic environment of the carbonyl as pressure is increased, as evidenced by the differences is broadening between NAGMA and NAAMA. The effect is magnified when the leucine side group is included. Not only is the band shifted to even lower energy at all pressures for NALMA compared to the other two molecules, but it broadens by nearly a quarter of its starting width as the pressure is increased.
With respect to the carbonyl groups of the peptide derivatives, it appears that even at atmospheric pressure the carbonyl stretches are not degenerate. In Figure 6, the asymmetry and appearance of shoulders in the blue traces show that the two carbonyl groups in each of the peptides experience different environments, and the red traces indicate that the effect is greatly exacerbated by increased pressure in the solution. Despite the lack of a good theoretical model for the response of carbonyl stretching in these molecules to increased pressure we attempted fits of the amide I′ spectra to two Gaussian peaks, but all of the resulting fits were non-unique and had equally good “goodness of fit” parameters.
The broadening of amide I′ with increased pressure is asymmetric for all three peptide derivatives, but this effect is greatly exaggerated for NALMA. In the absence of the NAGMA and NAAMA data we might assume that this effect was simply due to the NALMA molecule accessing more configurations that allowed the two carbonyls to accept very strong H-bonds to water (thereby pushing their absorption to lower frequency), but if that were the case then we would expect to see a similar large, low frequency broadening for all of the molecules. Though ultimately we can only guess at the exact conformational changes that occur in any of these peptides with large increases in hydrostatic pressure, we do know, from the very large decrease in NALMA amide I′ absorbance, that inclusion of the large, hydrophobic side chain causes an extreme change in the electronic environment experienced by the two carbonyl groups. This change in the local electronic neighborhood around the two carbonyl groups results in a greatly reduced change in the dipole moment with stretching, leading to a significant decrease in absorbance. Though specific conformational information cannot be derived from the spectra shown here, it may be that the decrease in volume of the NALMA molecule at very high pressure causes the carbonyl oxygen atoms to reorient in close proximity to the leucine side chain, whose electrostatic field and hydrophobic solvation profile decreases the change in molecular dipole as the carbonyl stretches
The amide II′ band of the three peptide derivatives shows even greater heterogeneity than does the amide I′ band. While the NAGMA and NAAMA amide II′ bands are similar in form, the NAAMA band is red-shifted nearly 10 cm−1 compared to the NAGMA band. This red shift is consistent with the difference seen in the amide I′ band, despite the fact that amide I′ is composed almost entirely of carbonyl stretching while amide II′ is an out of phase combination of C-N stretch and N-H bend. A portion of the NALMA amide II′ band is shifted to even lower frequency than that seen in NAGMA and NALMA, and in addition, the NALMA spectra indicate that the presence of the large, hydrophobic, leucine side chain creates two very different electronic environments for the two sections of peptide backbone. The overall blue shift of this principally bending vibration with increased pressure in each of the molecules is consistent with what is known for the response of other bending modes to decreased temperature, such as the HOH bend of water.27, 34 As the constituent atoms of the bending mode become more fixed in position relative to another, or bond more strongly to solvent, it takes more energy to excite the vibration.
Unlike what was seen in the amide I′ spectra, the amide II′ spectra of NAGMA and NAAMA do not broaden or split as pressure is increased, but instead narrow to the point where any underlying band substructure that may be discernible at ambient pressure disappears by the time pressures right below the ice VI transition are reached. It is evident that the NAGMA and NALMA molecules are accessing fewer peptide bond configurations as pressure increases, relative to those that are populated at atmospheric pressure. This means that the peptide bonds in these molecules are probably becoming more rigid and occupying a more restricted conformational space as pressure goes up. This conclusion is not surprising when we keep in mind how tightly packed water must be around the peptide molecules at pressures close to the ice VI transition.
NALMA, on the other hand, exhibits only a small blue shift with increased pressure and broadens slightly rather than narrows. This difference may be due to the large, hydrophobic, leucine side chain. It is known that hydrophobic residues cause water molecules to form clathrate-like cages around their side chains, and this water structuring may prevent hydrophobic side-chain-containing peptides in certain conformations from having their peptide backbone atoms make strong H-bonds with surrounding solvent.30, 35–36 Since a sizable portion of the NALMA molecule surrounding the Cα atom may be shielded by, but not bonded to, a strong, cage-like water structure, the reason why the NALMA amide II′ spectrum does not narrow with increased pressure may well be that the water-clathrate is much more translationally mobile in water than would be a polar side chain or a group containing some strong H-bonding group.
Conclusion
We have presented pressure dependent OH stretch spectra for a mixture of dilute HOD in D2O liquid and ices VI and VII. Our analysis shows that just as it is for changes in temperature, the decoupled OH stretching vibration is sensitive to changes in pressure of the local environment of the OH oscillator. This is readily deduced from observation of the OH stretch ice spectra and knowledge of the structure of ices VI and VII. We have also shown the identity of the side chain in a simple peptide can have a large impact on the electronic environment of the backbone of that peptide. NAGMA, NAAMA, and NALMA exhibit very different changes in their amide I′ and II′ spectra with increased pressure despite their overall structural similarity, and these spectral differences are reflections of their dissimilar structural response to increased hydrostatic pressure.
Acknowledgments
We gratefully acknowledge the assistance of Drs. Karel Heremans and Filip Meersman in learning to use the diamond anvil cell apparatus, as well as Dr. Martin Chaplin for providing the ice lattice data used in Figures 9 and 10. This research was supported by USDA Cooperative State Research, Education and Extension Service, Grant 2005-35503-16151.
Contributor Information
J. Nathan Scott, University of Pennsylvania, Dept. of Biochemistry and Biophysics
Jane M. Vanderkooi, University of Pennsylvania, Dept. of Biochemistry and Biophysics
References
- 1.Kagi H, Lu R, Davidson P, Goncharov AF, Mao HK, Hemley RJ. Mineral Mag. 2000;64:1089. [Google Scholar]
- 2.Fu R, O’Connell RJ, Sasselov DD. The Astrophysical Journal. 2010;708:1326. [Google Scholar]
- 3.Goossens K, Smeller L, Frank J, Heremans K. Eur J Biochem. 1996;236:254. doi: 10.1111/j.1432-1033.1996.00254.x. [DOI] [PubMed] [Google Scholar]
- 4.Toelgyesi F, Boede CS, Smeller L, Kim DR, Kim KK, Heremans K, Fidy J. Cell Mol Biol. 2004;50:361. [PubMed] [Google Scholar]
- 5.Sharma A, Scott JH, Cody GD, Fogel ML, Hazen RM, Hemley RJ, Huntress WT. Science. 2002;295:1514. doi: 10.1126/science.1068018. [DOI] [PubMed] [Google Scholar]
- 6.Kato C, Li L, Nogi Y, Nakamura Y, Tamaoka J, Horikoshi K. Appl Environ Microbiol. 1998;64:1510. doi: 10.1128/aem.64.4.1510-1513.1998. [DOI] [PMC free article] [PubMed] [Google Scholar]
- 7.Straube WL, O’Brien M, Davis K, Colwell RR. Appl Environ Microbiol. 1990;56:812. doi: 10.1128/aem.56.3.812-814.1990. [DOI] [PMC free article] [PubMed] [Google Scholar]
- 8.Song M, Yamawaki H, Fujihisa H, Sakashita M, Aoki K. Phys Rev B. 2003;68:024108. [Google Scholar]
- 9.Klug DD, Whalley E. J Chem Phys. 1984;81:1220. [Google Scholar]
- 10.Walrafen GE, Abebe M, Mauer FA, Block S, Piermarini GJ, Munro R. J Chem Phys. 1982;77:2166. [Google Scholar]
- 11.PPh, et al. EPL (Europhysics Letters) 1990;13:81. [Google Scholar]
- 12.Bertie JE, Labbe HJ, Whalley E. J Chem Phys. 1968;49:2141. [Google Scholar]
- 13.Maksumov IS, Arkhipova SF, Lipkind GM, Popov EM. Khim Prir Soedin. 1975;11:211. [Google Scholar]
- 14.Masman MF, Lovas S, Murphy RF, Enriz RD, Rodriguez AM. J Phys Chem A. 2007;111:10682. doi: 10.1021/jp0716886. [DOI] [PubMed] [Google Scholar]
- 15.Jalkanen KJ, Suhai S. Chem Phys. 1996;208:81. [Google Scholar]
- 16.Liu C, Zhao DX, Yang ZZ. AIP Conf Proc. 2008;1102:204. [Google Scholar]
- 17.Murarka RK, Head-Gordon T. J Chem Phys. 2007;126:215101. doi: 10.1063/1.2737050. [DOI] [PubMed] [Google Scholar]
- 18.Russo D, Copley JRD, Ollivier J, Teixeira J. J Mol Struct. 2010;972:81. [Google Scholar]
- 19.Measey T, Hagarman A, Eker F, Griebenow K, Schweitzer-Stenner R. J Phys Chem B. 2005;109:8195. doi: 10.1021/jp045762l. [DOI] [PubMed] [Google Scholar]
- 20.Wong PTT, Moffat DJ. Appl Spectrosc. 1989;43:1279. [Google Scholar]
- 21.Scott JN, Nucci NV, Vanderkooi JM. J Phys Chem A. 2008;112:10939. doi: 10.1021/jp8058239. [DOI] [PMC free article] [PubMed] [Google Scholar]
- 22.Kamb B. Science. 1965;150:205. doi: 10.1126/science.150.3693.205. [DOI] [PubMed] [Google Scholar]
- 23.Kuo JL, Kuhs WF. J Phys Chem B. 2006;110:3697. doi: 10.1021/jp055260n. [DOI] [PubMed] [Google Scholar]
- 24.Scott JN, Vanderkooi JM. WATER: A Multidisciplinary Research Journal. 2010;2:14. [Google Scholar]
- 25.Nelmes RJ, Loveday JS, Marshall WG, Hamel G, Besson JM, Klotz S. Phys Rev Lett. 1998;81:2719. doi: 10.1103/PhysRevLett.76.74. [DOI] [PubMed] [Google Scholar]
- 26.Knight C, Singer SJ. J Phys Chem A. 2009;113:12433. doi: 10.1021/jp902863k. [DOI] [PubMed] [Google Scholar]
- 27.Dashnau JL, Nucci NV, Sharp KA, Vanderkooi JM. J Phys Chem B. 2006;110:13670. doi: 10.1021/jp0618680. [DOI] [PubMed] [Google Scholar]
- 28.Nucci NV, Vanderkooi JM. J Phys Chem B. 2005;109:18301. doi: 10.1021/jp051068+. [DOI] [PubMed] [Google Scholar]
- 29.Vanderkooi JM, Dashnau JL, Zelent B. Biochim Biophys Acta, Proteins Proteomics. 2005;1749:214. doi: 10.1016/j.bbapap.2005.03.008. [DOI] [PubMed] [Google Scholar]
- 30.Sharp KA, Madan B, Manas E, Vanderkooi JM. J Chem Phys. 2001;114:1791. [Google Scholar]
- 31.Wall TT, Hornig DF. J Chem Phys. 1965;43:2079. [Google Scholar]
- 32.Sharp KA, Vanderkooi JM. Acc Chem Res. 2009;43:231. doi: 10.1021/ar900154j. [DOI] [PMC free article] [PubMed] [Google Scholar]
- 33.Pruzan P, Chervin JC, Gauthier M. EPL (Europhysics Letters) 1990;13:81. [Google Scholar]
- 34.Vanderkooi JM, Dashnau JL, Zelent B. Biochimica et Biophysica Acta (BBA) - Proteins & Proteomics. 2005;1749:214. doi: 10.1016/j.bbapap.2005.03.008. [DOI] [PubMed] [Google Scholar]
- 35.Sharp KA, Madan B. J Phys Chem B. 1997;101:4343. [Google Scholar]
- 36.Gallagher KR, Sharp KA. J Am Chem Soc. 2003;125:9853. doi: 10.1021/ja029796n. [DOI] [PubMed] [Google Scholar]


