ABSTRACT
Introduction:
Prevalence of the kidney stones (renal calculi) increase in several countries in parallel with the increase of overweight, diabetes (type 2 diabetes) and hypertension.
Goal:
The goal of our research was to evaluate the connection between the calcium nephrolithiasis and overweight, as quantified using the Body Mass Index (BMI) of the adult population, with a particular reflection on the age groups within it.
Material and methods:
The research was prospective and it was implemented at the Clinical Center of Banja Luka, at the Urology Clinic in the period from 1st April 2012 to 1st January 2013. The trial encompassed 120 patients with calcium nephrolithiasis of the upper part of the urinary tract and 120 patients without nephrolithiasis. A group of patients with the calcium nephrolithiasis presented a working group, while a group of patients without nephrolithiasis presented a control group. The BMI obtained on the basis of bodily weight and height of the patient, where the age and sex of specific reference values of the BMI were developed by the Center for Disease Control and Prevention (CDC) were not used in the calculation of the BMI.
Results:
Analyzing the values of the BMI in relation to age groups, where there was a statistically significant difference in the working group, whereas in the control group there was a statistically high significant difference, testing of statistical significance of the average value of the BMI was done by observed age groups of working and control group, as well as to the total sample of work and control group using the Chi-Square test and T-test for independent samples. Having observed the age group of 20-40 years, statistically significant differences have been noted at the level of risk of 10%, which confirms that there is a connection between the categories of the BMI and the group, which the patient comes from (Chi-Square test p-0.05), that is, T-test has shown that the values are different at the level of 10%, i.e. p<0.1 (p=0.073). Having observed the age group 40-60, there was no dependency between the category of the BMI and the group, that is, the differences are not statistically significant, p>0.05 (t-test p=0.314). In addition to this, the average BMI values are not significantly different, p>0.05 (t-test p=0.871). Having observed the age group of the older than 60, there was no dependency between the category of the BMI and the group, that is, the differences are not statistically significant, p>0.05 (Chi-square test p=0.167). Having observed the total sample of the working and control group, there was no dependency of the category of the BMI and the group (or urolithiasis), p>0.05 (Chi-Square test p=1.208), whereas the results of the T-test showed that there was no statistically significant difference of the arithmetic mean values of the BMI working group and control group, p>0.05 (t-test p=0.620).
Conclusion:
Overweight in younger age groups of adult population may be connected to the occurrence of calcium nephrolithiasis, thus we suggest that urolithiasis should be considered with them, as part of overweight, by which a change of living habits and the manner of food consumption could prevent this disease.
Keywords: urolithiasis, calcium kidney stone (renal calculi), overweight, Body Mass Index
1. INTRODUCTION
Urolithiasis is a multi-factorial disease, the presence of which in daily urology practice is with the incidence of 0.5% in Europe and the United States of America, whose prevalence has been on a constant increase (1). Prevalence of symptomatic kidney stones amounts to 5-10%, generally in the total population, with a slight predominance in males (2, 3). Prevalence of the kidney stones in the United States of America has increased by 37% in the period from 1976-1980 to 1988-1994 for both males and females (1). The biggest number of the kidney stones are calcium stones, than acid uric making about 9%, struvite (magnesium ammonium phosphate hexahydrate) making approximately about 10% and the rest of 1% is presented by all the other stones (cystine, drug stones, ammonium acid urate) (4). Reference books data show that there is an increase of prevalence of calcium phosphate stones (Calcium phosphate–CaP) in the last two decades, predominantly with women (5, 6). Prevalence of kidney stones has been on the increase in several countries, in parallel with the increase in overweight and diabetes (type 2 diabetes) and hypertension (1, 7, 8, 9) Iba A and associates have shown that the metabolic syndrome, under which overweight is classified, causes changes in urinary constituents, leading to the increased risk of occurrence of urate and calcium kidney stones (uric acid stone and calcium stone) (10). In the last 10 years, the incidence of the kidney stone has been on the increase in the pediatric population and this increase has gone in parallel with a significant increase of pediatric overweight in the USA (11). The correlation between overweight and kidney stones has been documented for the adult population as well. Body Mass Index (BMI) presents a useful tool in overweight screening. The goal of our research was to evaluate correlation between calcium nephrolithiasis and overweight, quantified using Body Mass Index (BMI) with adult population, with a particular overview of the age sub-groups within it.
2. MATERIAL AND METHODS
The research included 120 patients with calcium lithiasis of the upper part of the urinary tract and 120 patients without lithiasis. The group of patients with the calcium nephrolithiasis presented a working group, while the group of patients without nephrolithiasis presented a control group. The research was prospective and it was implemented at the Clinical Center of Banja Luka, at the Urology Clinic in the period from 1st April 2012 to 1st January 2013. Diagnosis of the calcium lithiasis of the upper part of the urinary tract was determined on the basis of ultrasonography of the urinary tract, which was initially performed on all the patients of both working and control group, as well as native urography of the urinary tract/intravenous urography and chemical analysis of the stone of the patients, who have later had a spontaneous emission of the stones or after some of the methods for active removal of the stones, with the patients of the working group. Excluding factors were chronic immobilization, anatomic and functional disturbance of the urinary tract, which, as a consequence, cause obstructive uropathy, hyperparathyroidism, history of malignity as well as other comorbidities, medications or diets that could result in secondary hypercalciuria.
The BMI was obtained on the basis of bodily weight and height of the patients, using the following formula:

Categorization of the BMI was as follows: the values of the BMI 18.5 – 25 presented normal weight, the values below 18.5 signified underweight, the values of 25-30 overweight and the values above 30 signified that the individuals are obese. The age and sex specified reference values of the BMI developed by the Centers for Disease Control and Prevention (CDC) were not used in the calculation of the BMI.
3. RESULTS
Demographically speaking, the samples of working and control group of 120 patients included 40 persons in the following three age categories: 20-40, 40-60 and above 60 years.
The average age of the working group amounted to 50.19 years with the standard deviation of 15.60. The basic descriptive characteristics of the age structure of the total working group sample are given in Table 1.
Table 1.
Demographic characteristics of the total working group sample.
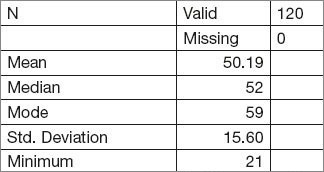
According to the age categories of the working group sample, descriptive characteristics are shown in the following manner (Table 2).
Table 2.
Demographic characteristics of the working group sample by the age categories.
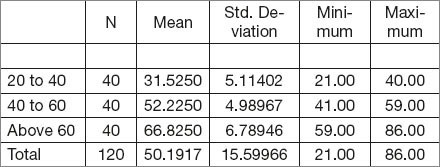
Sex structure of the sample was not completely balanced, as the sample contained 52.2% men and 47.5% women (Table 3).
Table 3.
Sex structure of the total sample of the working group by the age categories
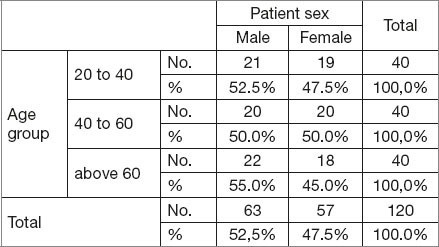
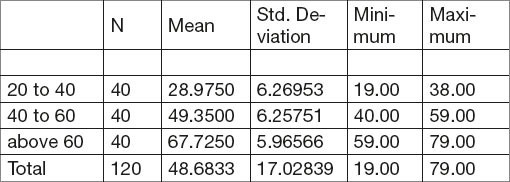
The average age of the control group amounted to 48.68 years with the standard deviation of 17.03. The basic descriptive characteristics of the total sample of the control group are given in Table 4.
Table 4.
Demographic characteristics of the total sample of the control group
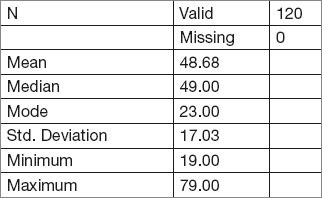
According to the age categories of the working group sample, descriptive characteristics are shown in the following manner (Table 5).
Table 5.
Demographic characteristics of the control group sample by the age categories
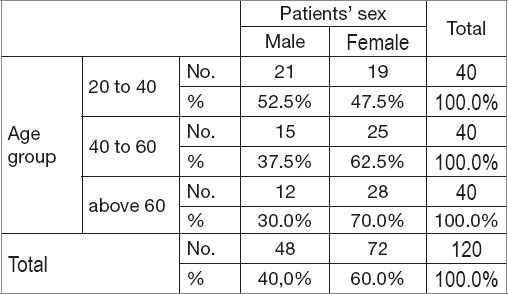
Sex structure of the sample of the control group was not completely balanced, as the sample included 40% men and 60% women (Table 6).
Table 6.
Sex structure of the total control group sample by the age categories.
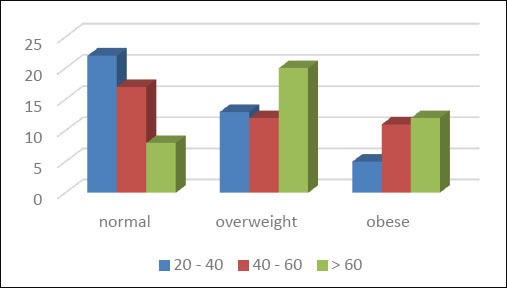
Having analyzed the BMI category per age group of the working group, the trial showed that with the youngest age category there was the smallest share of overweight and obese patients (Figure 1.). In the total sample of the working group there were no underweight patients.
Figure 1.
Overweight (expressed through the BMI) by age groups of the working group
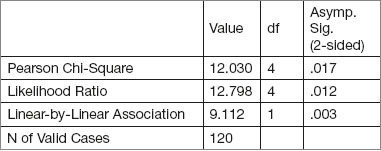
Analysis of the BMI according to age categories of the working group has showed that there is statistical dependency between the BMI and age group. Table 7 shows that the differences were statistically significant (p<0.05) (p-values are in the last column).
Table 7.
Chi-Square test (connection of the BMI and age group) of the working group.
On the other side, the value of the BMI working group was not related to sex, that is, the differences that occurred (men got worse results) are not statistically significant, which was confirmed by the Chi-Square test (p>0.05). This is shown by Figure 2 and Table 8.
Figure 2.
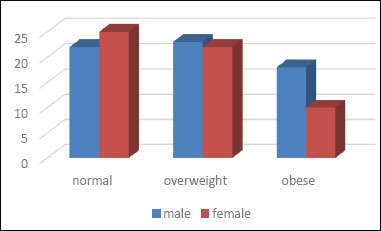
Structure of patients of the working group by sex in terms of overweight
Table 8.
Chi-Svadrat test (connection of the BMI and sex) of the working group
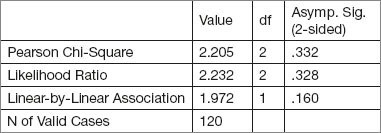
In the control group of patients, as well as in the working group, there is a connection between overweight and age group, but not between the overweight and patients’ sex. The following Figure 3 shows the structure of the patients’ control group according to the BMI categories in relation to the age group. It is clearly seen that in the youngest age group, there is a smaller share of the overweight in relation to the older groups. Table 9 shows that differences in percentages (%) of the BMI per age structures of the control group are statistically highly significant (p<0.01). In the total control group sample, there was one underweight patient.
Figure 3.
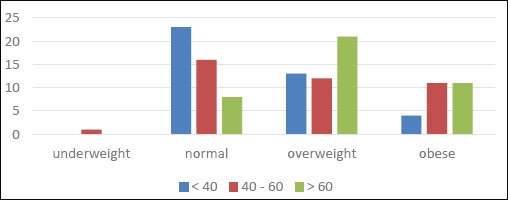
Overweight (expressed through the BMI) by age groups of the control group
Table 9.
Chi-Square test (connection of the BMI and age group) of the control group.
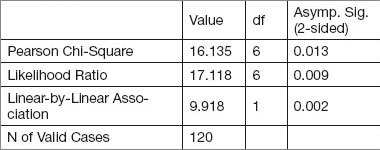
Values of the BMI control group were not connected to sex, that is, the differences that existed are not statistically significant, which is confirmed by the Chi-Square test (p>0.05). This is showed by Figure 4 and Table 10. It is noted that in each of these categories, from the point of view of being overweight, there is a bigger number of women, which is the result of domination of this sex in the control group sample.
Figure 4.
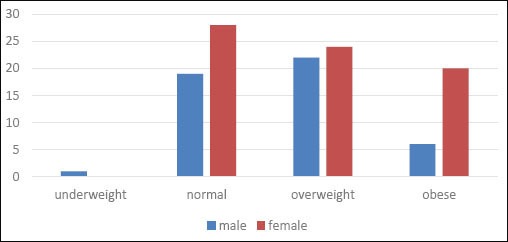
Structure of the control group patients by sex in terms of being overweight
Table 10.
Chi-Square test (connection of the BMI and sex) of the control group.
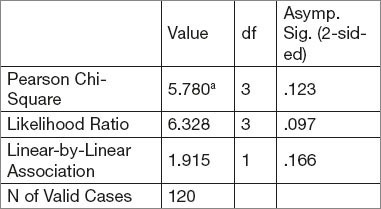
Analyzing the values of the BMI in terms of age groups, where in the working group there was a statistically significant difference, whereas the control group had a statistically highly significant difference, testing of the statistical significance of the average BMI value was done by the observed age groups of working and control group, as well as in the total sample of the working and control group using the Chi-Square test and T-test for independent samples (Tables 11, 12, 13, 14 and 15). Having observed the age group 20-40 years, statistically significant differences were observed at the level of risk of 10%, which implies that there is a connection between the categories of the BMI and the group, which the patient comes from (Chi-Square test p-0.05) and T-test have shown that the values are different at the level of 10%, i.e. p<0.1 (p=0.073). Specifically, the difference between the average BMI values (working 24.9 and control 23.5) is not significant with a general reliability of 95% (risk of 5%), but it is significant with a somewhat higher risk degree. When observed for the age group of 40-60, there was no dependency between the category of the BMI and the group, that is, the differences are not statistically significant, p>0.05 (Chi-Square test p=0.314). In addition to this, the average values of the BMI are not statistically different, p>0.05 (t-test p=0.871). Having observed the age group of older than 60 years old, there was no dependency between the category of the BMI and the group, that is, the differences are not statistically different, p>0.05 (Chi-Square test p=0.167). Results of the T-test have shown that there is a significantly higher average value of the BMI in the control group, when compared to the working group of p<0.05 (p=0.013). When observed at the total sample of the working and control group, there was no dependency of the category of the BMI and the group (or urolithiasis), p>0.05 (Chi-Square test p=1.208) and the results of the T-test have showed that there was no statistically significant difference of the arithmetic mean values of the BMI of the working and control group, p>0.05 (t-test p=0.620)
Table 11.
Arithmentic mean of the BMI in the age group of 20-40 years of the working and control group.

Table 12.
Arithmetic mean of the BMI in the age group of 40-60 of the working and control group.

Table 13.
Artithmetic mean of the age group >60 years of the working and control group.

Table 14.
Arithmetic mean BMI on the total sample of working and control group.

Table 15.
Testing of the statistical significance using the Chi-Square test and T-test for independent samples

4. DISCUSSION
Numerous epidemiological studies have shown that there is an evident growth of the urolithiasis together with the increase of the BMI. It is known that the metabolic changes in the sense of “morbid overweight” lead to an increase of the risk of occurrence of urolithiasis. With an increase of the BMI, the patients get into a soft metabolic acidosis, which results with an increase of acid excretion (decline of pH of urine) and decline of citrate excretion, a significant increase of urinary excretion of calcium and uric acid, which may lead to the occurrence of the calcium and uric acid stones (10, 14, 15, 16). Other studies have also shown that the metabolic syndrome has been associated with an increased risk of occurrence of uric and calcium stones, due to lower values of pH urine and increase of acid uric excretion, which is a cause of occurrence of uric acid stone, as well as decrease of citrate excretion and increase of excretion of acid uric and calcium, which leads to occurrence of calcium stones (10). Metabolic syndrome, which has been defined by existence of increased BMI, hypertension, insulin resistance and dislipidemia, in any case, shows more abnormality which are in correlation with increased risk of occurrence of urolithiasis. Dr Dean Assimos, at AUA Annual Meeting in 2011, presented in detail the way of metabolic syndrome and concluded that diabetes, hypertension, coronary artery disease and increased BMI have been associated with an increased risk of occurrence of kidney stones (17). The correlation between overweight and kidney stones has been documented for both adult as well as pediatric population. It is completely clearly defined what the overweight patients should do in the sense of decreasing the risk of occurrence of kidney stones. First, the bodily weight should be reduced, as much as possible, as with a significant loss of surplus kilograms the risk of occurrence of urolithiasis will decrease. Second, with or without reduction of the bodily weight, there are also steps that could lead to decrease of the risk for occurrence of the kidney stones. Namely, adequate intake of liquid is necessary to provide adequate dilution of urine, supplementation of citrate, as an inhibitor of occurrence of the calcium lithiasis, decreased level of proteins, in order to decrease acidosis they lead to, as well as decreased intake of salts, which may also decrease the calcium excretion.
The results of our study have shown that, by the usage of Chi-Squate test and T-test for independent samples, that there was a connection between the overweight and age group, in the sense that the overweight was statistically significantly more present in the older age sub-groups of both groups of the patients, with and without urolithiasis, as well as that there was no dependence between overweight and patients sex. The results of our study have shown that in the age group (20-40 years) there was a statistically significant difference at the risk level of 10%, which says that there was a correlation between the categories of the BMI and the group from which the patient comes (Chi-Square test, p-0.05) and T-test have shown that the values are different at the level of 10%, i.e. p<0.1 (p=0.073). Specifically, the difference between the average values of the BMI (working 24.9 and control 23.5) was not significant with an usual reliability of 95% (5% risk), but it has been significant with a big higher degree of risk. When observed at the total level of the working and control group, there was no dependence of the BMI category and group (or urolithiasis), p>0.05 (Chi-Square test p=1.208), and the results of T-test have shown that there was no statistically significant difference of arithmetic mean values of the BMI of working and control group, p>0.05 (T-test p=0.620). There were no statistically significant differences at the level of older age sub-groups (40-60 years, >60g). Partial deviation of the results of our study, from the results of other authors who have unambiguously shown the correlation of overweight as a part of metabolic syndrome with the occurrence of kidney lithiasis, may be caused by the fact that the sample of our research, from the point of view of overweight would contain a much lower number of overweight patients (BMI>30) in relation to the remaining number of patients in the sample from the point of view of other categories of the BMI (BMI>30), with a conclusion that, still, in the age group of 20-40 years of age, there was correlation of overweight with urolithiasis.
5. CONCLUSION
Overweight in the younger age group of adult population may be connected to the occurrence of calcium nephrolithiasis, which is why we suggest that the urolithiasis should be considered with the same ones as a part of overweight, by which the change of living habits and manner of nutrition could prevent this disease.
Footnotes
CONFLICT OF INTEREST: NONE DECLARED
REFERENCES
- 1.Stamatelou KK, Francis ME, Jones CA, Nyberg LM, Curhan GC. Time trends in reported prevalence of kidney stones in the United States. Kidney Int. 2003;63:1817–1823. doi: 10.1046/j.1523-1755.2003.00917.x. [DOI] [PubMed] [Google Scholar]
- 2.Alon US, Zimmerman H, Alob M. Evaluation and treatment of pediatric idiopathic urolithiasis-revisited. Pediatr Nephrol. 2004;19:516–520. doi: 10.1007/s00467-004-1422-3. [DOI] [PubMed] [Google Scholar]
- 3.Lamnde MB, Varade W, Erkan E, Niederbracht Y, Schwartz GJ. Role of urinary supersaturation in the evaluation of children with urolithiasis. Pediatr Nephrol. 2005;20:491–494. doi: 10.1007/s00467-004-1779-3. [DOI] [PubMed] [Google Scholar]
- 4.Evan AP. Physiopathology and etiology of stone formation in the kidney and the urinary tract. Pediatr Nephrol. 2010;25:831–841. doi: 10.1007/s00467-009-1116-y. [DOI] [PMC free article] [PubMed] [Google Scholar]
- 5.Mandel NS, Mandel I, Fryjoff K, Rejniak T, Mandel G. Conversion of calcium oxalate to calcium phosphate with recurrent stone episodes. J Urol. 2003;169:2026–2029. doi: 10.1097/01.ju.0000065592.55499.4e. [DOI] [PubMed] [Google Scholar]
- 6.Parks JH, Worcester EM, Coe FL, Evan AP, Lingeman JE. Clinical implications of abundant calcium phosphate in routinely analyzed kidney stones. Kidney Int. 2004;66:777–785. doi: 10.1111/j.1523-1755.2004.00803.x. [DOI] [PubMed] [Google Scholar]
- 7.Yasui T, Iguchi M, Suzuki S, et al. Prevalence and epidemiological characteristics of urolithiasis in Japan. Urology. 2008;71:209–213. doi: 10.1016/j.urology.2007.09.034. [DOI] [PubMed] [Google Scholar]
- 8.Wild S, Roglic G, Green A, et al. Global prevalence of diabetes: estimates for the year 2000 and protections for 2030. Diabetes Care. 2004;27:1047–1053. doi: 10.2337/diacare.27.5.1047. [DOI] [PubMed] [Google Scholar]
- 9.Deitel M. Overweight and overweight worldwide now estimated to involve 1,7 billion people. Obes Surg. 2003;13:329–323. doi: 10.1381/096089203765887598. [DOI] [PubMed] [Google Scholar]
- 10.Iba A, Kojimoto Y, Kuramoto T, et al. Insulin resistance increases the risk of urinary stone formation in a rat model of metabolic syndrome. BJI International. 2010;106:1550–1554. doi: 10.1111/j.1464-410X.2010.09216.x. [DOI] [PubMed] [Google Scholar]
- 11.Ayoob R, Wang W, Chwaderer A. Body fat composition and occurrence of kidney stones in hypercalciuric children. Pediatr Nephrol. 2011;26:2173–2178. doi: 10.1007/s00467-011-1927-5. [DOI] [PubMed] [Google Scholar]
- 12.Duffey BG, Pedro RN, Kriedberg C, et al. Lithogenic risk factors in the morbidly obese population. J Urol. 2008;179:1401–1406. doi: 10.1016/j.juro.2007.11.072. [DOI] [PubMed] [Google Scholar]
- 13.Esner BH, Eisenberg ML, Stoller ML. Influence of body mass index on guantitative 24-hour urine chemistry studies in children with nephrolithiasis. J Urol. 2009;182:1142–1145. doi: 10.1016/j.juro.2009.05.052. [DOI] [PubMed] [Google Scholar]
- 14.Li WM, Chou YH, Li CC, et al. Association of body mass index and urine pH in patients with urolithiasis. Urol Res. 2009;37:193–196. doi: 10.1007/s00240-009-0194-4. [DOI] [PubMed] [Google Scholar]
- 15.Eisner BH, Eisenberg ML, Stoller M. Influence of body mass index on quantitative urine chemistry studies in children with nephrolithiasis. J Urol. 2009;182:1142–1145. doi: 10.1016/j.juro.2009.05.052. [DOI] [PubMed] [Google Scholar]
- 16.Siener R, Glatz S, Nicolay C, Hesse A. The role of overweight and overweight in calcium oxalate stone formation. Obes Res. 2004;12:106–113. doi: 10.1038/oby.2004.14. [DOI] [PubMed] [Google Scholar]
- 17. www.aua 2011.org (program)webcasts.html .


