

Abstract
Background
Existing predictive models for lung cancer focus on improving screening or referral for biopsy in general medical populations. A predictive model calibrated for use during preoperative evaluation of suspicious lung lesions is needed to reduce unnecessary operations for benign disease. A clinical prediction model (TREAT) is proposed for this purpose.
Methods
We developed and internally validated a clinical prediction model for lung cancer in a prospective cohort evaluated at our institution. Best statistical practices were used to construct, evaluate and validate the logistic regression model in the presence of missing covariate data using bootstrap and optimism corrected techniques. The TREAT model was externally validated in a retrospectively collected Veteran Affairs population. The discrimination and calibration of the model was estimated and compared to the Mayo Clinic model in both populations.
Results
The TREAT model was developed in 492 patients from Vanderbilt whose lung cancer prevalence was 72% and validated among 226 Veteran Affairs patients with a lung cancer prevalence of 93%. In the development cohort the area under the receiver operating curve (AUC) and Brier score were 0.87 (95%CI: 0.83–0.92) and 0.12 respectively compared to the AUC 0.89 (95%CI: 0.79–0.98) and Brier score 0.13 in the validation dataset. The TREAT model had significantly higher accuracy (p<0.001) and better calibration than the Mayo Clinic model (AUC=0.80, 95%CI: 75–85; Brier score=0.17).
Conclusion
The validated TREAT model had better diagnostic accuracy than the Mayo Clinic model in preoperative assessment of suspicious lung lesions in a population being evaluated for lung resection.
Keywords: Lung cancer, diagnosis, prediction models
Introduction
Lung cancer is the leading cause of cancer-related mortality in the U.S.1, 2 but early detection and treatment prolongs life. The National Lung Screening Trial (NLST) found a 20% reduction in lung cancer mortality in high risk patients screened with low dose computed tomography (LDCT). Implementation of a screening regimen for lung cancer among the an estimated 7.4 million eligible Americans3 will greatly increase the number of lung nodules requiring evaluation and diagnosis. In addition, 39% of patients screened with LDCT had at least one positive scan requiring additional diagnostic evaluations.4 A diagnostic operation after nodule discovery and radiographic surveillance resulted in a benign diagnosis in 24% of surgical procedures. Other studies describing resection for known or suspected lung cancer report benign disease rates as high as 40%.5–9
Existing lung cancer prediction models are designed to either determine which high risk populations would most benefit from screening10–13; or estimate the likelihood of cancer, once a lesion is discovered.14–16 Current guidelines from the American College of Chest Physicians (ACCP) recommend that clinicians use a validated prediction model, such as the model developed in the Mayo Clinic, or their clinical expertise to estimate the probability of cancer in a suspicious a lung lesion.17 The Mayo Clinic model contains six variables (age, smoking history, previous cancer, lesion size, spiculated edge and location) and was designed to evaluate nodules in patients selected from a general population who had a lesion found on imaging. Our previous work demonstrated that the Mayo Clinic model has poor calibration in patients referred for surgical evaluation.18 Currently, no models exist to estimate the lesion’s probability of malignancy at the point of surgical evaluation.
Patients evaluated by surgeons usually have a significant body of diagnostic information compiled from previous medical specialists such as multiple radiographic scans, biopsy results, and pulmonary function. Surgeons need an accurate and well calibrated predictive model to help diagnose a suspected lung cancer without missing early stage disease; no models exist which integrate this additional information.19 We developed and validated the Thoracic Research Evaluation And Treatment (TREAT) lung cancer prediction model and compared the performance of the TREAT model to the Mayo Clinic model in two populations being evaluated for lung resection.
Methods
Study Population
The TREAT model was developed in the Vanderbilt University Medical Center (VUMC) Lung Cancer Cohort and to examine the generalizability of the TREAT model, it was validated in the Tennessee Valley Veterans Affairs Cohort (VA). The Vanderbilt cohort was composed of patients identified from two separate sources. Using VUMC’s Thoracic Surgery Quality Improvement database and clinic records, 606 patients were identified who received an evaluation of a lung nodule or mass by a thoracic surgeon for known or suspected non-small cell lung cancer (NSCLC) from January 2005 to October 2010 (Figure 1). Demographic and clinical data for each procedure was abstracted using the Society of Thoracic Surgeons National Database for General Thoracic Surgery specifications and guidelines.20 Imaging data were abstracted from radiologist reports or from original scans of the most recent pre-operative CT scans for lesion growth, edge characteristics, and FDG-PET avidity by experienced medical reviewers.5, 18, 21, 22 Lesion edge characteristics defined by the terms smooth, lobulated, lobular, lobed, irregular, ground glass opacity (GGO), ground glass nodule, spiky, or spiculated in the radiologists’ reports were designated by medical reviewers as either smooth, lobulated, ground glass opacity, spiculated or indeterminate. Growth on serial radiographs occurring at least 60 days apart is defined as an increase in mean diameter of 2 mm for nodules initially less than 15 mm in size and an increase of at least 15% compared to a baseline scan for lesions more than 15 mm in size at baseline.23 For cases with one preoperative radiograph or whose subsequent radiograph was fewer than 60 days and deemed too short a time span to record lesion growth, the case was designated as “insufficient data.” FDG-PET avidity was determined by either physician report or by maximum standard uptake value (SUV). Not avid was coded if the radiologist report used the terminology: not avid, not cancerous, low avidity, not likely cancerous or reported a SUV <2.5. Avidity was coded if the radiologist used the terminology: avid, likely cancerous, highly avid, cancerous or reported a SUV >/= 2.5. Any radiological reports of insufficient quality to determine diagnosis, shape characteristics, or FDG-PET avidity by chart review were reviewed for determination by a thoracic surgeon. If no designation could be made, then original scans were reviewed by a thoracic radiologist blinded to clinical pretest data and pathological outcome. Diagnosis was confirmed by pathologic examination after thoracotomy, thoracoscopy, mediastinoscopy, bronchoscopy with biopsy (N=523) or by radiographic surveillance among patients not undergoing a procedural biopsy (N=83). Pre-operative symptoms were defined as any documented evidence in the medical record of the following: hemoptysis, shortness of breath, unplanned weight loss, fatigue, pain, or pneumonia. Preoperative predicted forced expiratory volume in one second (FEV1) was a continuous variable based on the most recent pulmonary function test prior to their thoracic operation.
Figure 1.
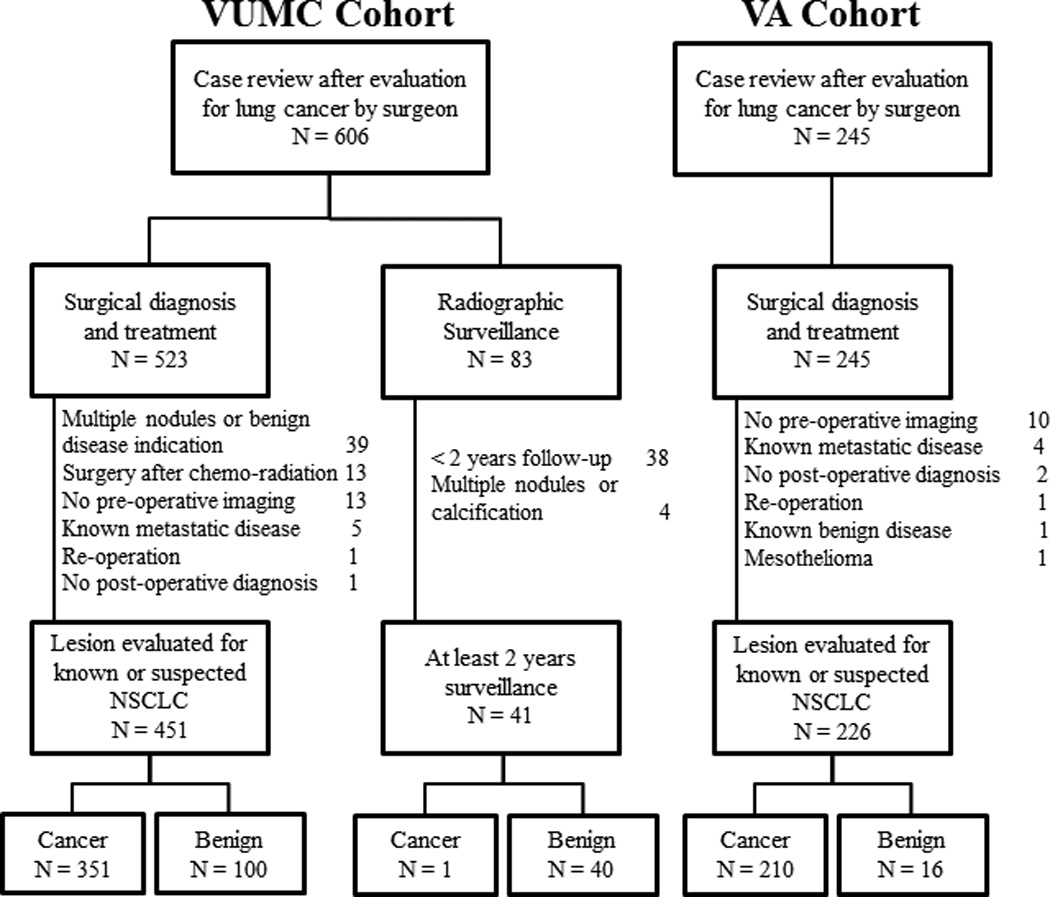
Consort diagram of Vanderbilt University Medical Center cohort (VUMC) and Tennessee Valley Healthcare System Veteran Affairs cohort (VA)
Individuals with multiple nodules or who had evidence for benign diseases (e.g. benign calcification, infiltrates, bronchiolitis obliterans organizing pneumonia, or empyema) were excluded (N=39). Also, individuals receiving an operation for a known malignancy after initial chemo-radiation therapy (N=13), who had no pre-operative radiographic imaging documentation to determine evaluation rationale (N=13), those with known metastatic disease (N=5), individuals without a definitive clinical diagnosis after surgery (N=1) or re-operation (N=1) were excluded. Non-surgical patients with less than two years of radiographic surveillance or clinical follow-up from the date of their surgical evaluation (N=38) were excluded as were non-surgical patients with multiple or calcified nodules (N=4). The remaining 492 patients were used in our analysis. Vanderbilt University Institutional Review Board approved this study with a waiver of individual patient consent.
The Tennessee Valley Veterans Affairs Cohort was composed of 245 individuals receiving a thoracic operation for known or suspected lung cancer between January 1, 2005 and December 31, 2013. Individuals with no pre-operative radiographic imaging documentation to determine evaluation rationale (N=10), those with known metastatic disease (N=4), individuals without a definitive clinical diagnosis after surgery (N=2), known benign disease (N=1), mesothelioma (N=1) or re-operation (N=1) were excluded. The remaining 226 patients were used to validate the TREAT model. Tennessee Valley Healthcare System – Veteran’s Affairs Institutional Review Board approved this study.
Selection of variables for the model
The TREAT model was developed using a prespecified set of candidate variables derived from previously published and validated models for determining appropriate screening populations for low dose CT scans13 or for estimating the likelihood a lung nodule is malignant after its discovery14–16 (Table 1). Lesion growth and FDG-PET scan avidity were chosen due to their inclusion in recent guidelines for diagnosis and that a patient should be referred for surgical evaluation when they occur.17 Additional variables for the TREAT model were chosen after consulting with thoracic surgeons as to those factors commonly encountered in their practice and that influence their risk estimates, given the radiographic discovery of a lung nodule or mass.
Table 1.
Variables used in published, validated clinical lung cancer prediction models
| Model | PLCOM2012 | Mayo Clinic | VA | SPN Model | TREAT |
|---|---|---|---|---|---|
| Variable | |||||
| Age | √ | √ | √ | √ | √ |
| Gender | √ | √ | |||
| Race | √ | ||||
| Education | √ | ||||
| Body Mass Index | √ | √ | |||
| COPD | √ | √b | |||
| Family history of cancer | √ | ||||
| Smo | √ | ||||
| king (Y/N) | √ | √ | |||
| Smoking - Pack Years | √a | √ | √ | ||
| Years quit smoking | √ | √ | |||
| Hemoptysis | √ | √c | |||
| Previous Cancer | √ | √ | √ | ||
| Lesion Size | √ | √ | √ | √ | |
| Lesion Growth | √ | √ | |||
| Spiculation | √ | √ | √ | ||
| Lesion Location | √ | √ | √ | ||
| FDG-PET Avidity | √ | √ |
PLCOM2012 Model was developed to estimate risk of lung cancer in a healthy population for purposes of determining who should be screened. The Mayo Clinic, VA, SPN Model and TREAT models were developed to estimate lung cancer risk given radiographic detection of a solitary pulmonary nodule.
Pack years were separated out into smoking duration and smoking intensity
Chronic obstructive pulmonary disease (COPD) modeled using predicted forced expiratory volume in 1 second (FEV1) as a continuous variable.
Hemoptysis included in pre-operative symptoms which also included any of: shortness of breath, unplanned weight loss, fatigue, pain, or pneumonia.
Statistical analysis
Analyses were performed in R v3.0.1 and Stata v12 (College Station, TX). Variables were summarized and examined as appropriate in numerical (e.g. mean, median, or proportion) and graphical fashion (scatter plots, boxplots, histograms). Descriptive statistics and the extent of missing data are reported in Table 1. Analysis of demographic variables and pre-specified predictors of lung cancer according to lung cancer status were conducted utilizing only observed data. Multiple imputation techniques and predictive mean matching were used for imputation of missing values.24 Multiple imputation assumptions were examined following the methods of Potthoff et al.25
Logistic regressions models for predicting lung cancer were fit to the data and evaluated for accuracy, calibration and overfitting based on the methodology of Harrell and Steyerberg.24, 26 Non-linear associations between continuous variables and lung cancer were evaluated using restricted cubic splines of three and five knots, and linearity was tested using the likelihood ratio test. The model’s ability to discriminate between cancer and benign disease was evaluated by the area under the receiver-operating-characteristic curve (AUC). Model calibration, in the sense of directly comparing a model’s predicted probabilities to observed probabilities, was assessed with Brier score of the model’s predictions. Bootstrap methods were used to (1) obtain standard errors for the model parameters and model predictions and (2) assess the degree of optimism of the model’s accuracy to predict cancer. A stable, internally valid TREAT model was corrected for optimism, which occurs due to overfitting of the model, by using the bootstrap with replacement approach. AUC and Brier score performance used 500 bootstrap iterations with replacement for the TREAT model.27 AUC and Brier score for the Mayo Clinic model were estimated using the published equation of variable coefficients from the original article.14 The Mayo Clinic model’s probability of a malignant pulmonary nodule equals ex/(1+ex); where x = −6.8272 + (0.0391*age) + (0.7917*smoking history) + (1.3388*previous non-thoracic cancer) + (0.1274*lesion size) + (1.0407*spiculated lesion edge) + (0.7838*upper lobe location). The AUC and Brier for the Mayo Clinic model were compared to the AUC and Brier of the bootstrapped TREAT model in both the VUMC development and the VA validation datasets.
Results
Lung cancer prevalence in the VUMC cohort (N=492) was 72% and 93% in the VA cohort (N=226). Pathological diagnosis after resection occurred in 451 (92%) and by active surveillance in 41 (8%) individuals in the VUMC cohort and all diagnoses in the VA cohort were determined pathologically. Complete covariate data were available for 264 and 136 individuals in the VUMC and VA cohorts respectively. Those with a cancer diagnosis were more likely to have complete data (58%) than those with benign disease (42%) in the development cohort. Missing data for FDG-PET and FEV1 were more common among those patients in the VUMC cohort diagnosed by active surveillance (85% and 61% respectively). Missing data occurred most often with FDG-PET scan (22% in VUMC and 21% in VA), growth on serial CT scans (13% in VUMC and 1% in VA), predicted FEV1 (10% in VUMC and 0% in VA) and pre-operative disease symptoms (7% in VUMC and 16% in VA). The remaining variables of interest had less than 5% missing data in the VUMC development dataset. Assumptions regarding missing data did not preclude the use of multiple imputation according to Potthoff’s methodology.25 The VA cohort was predominantly male (97%), had a higher prevalence of pre-operative symptoms (62%), were more likely to smoke (95%) and smoked more (50 pack-years), had slightly larger lesions on average (29 mm) and those lesions were more likely to be FDG-PET avid (95%) when compared to the VUMC cohort (Table 2).
Table 2.
Demographic and radiological data in Vanderbilt University Medical Center development and Veterans Affairs validation datasets
| VUMC N=492 |
VA N=226 |
|
|---|---|---|
| Male (%) | 192(51) | 220(97) |
| Caucasian (%) | 453(92) | 196(87) |
| Missing | 2 | 2 |
| Mean Age (SD) | 63(13) | 65(8) |
| Smoking Status – Ever (%) | 378(77) | 215(95) |
| Median Pack – years among smokers(IQR) | 42(30, 60) | 50(44, 85) |
| Missing | 8 | 3 |
| Mean BMI, kg/m2(SD) | 27.7(6) | 26(5) |
| Missing | 2 | 2 |
| Mean Predicted FEV1 (SD) | 77.7(20) | 72.0(17) |
| Missing | 50 | 0 |
| Pre-operative symptomsa(%) | 118(26) | 117(62) |
| Missing | 33 | 37 |
| Previous cancer (%) | 181(37) | 57(25) |
| Upper lobe location (%) | 283(59) | 77(34) |
| Missing | 13 | 0 |
| Mean Lesion Size, mm (SD) | 28(19) | 29(17) |
| Growth (%) | 200 (47) | 90 (40) |
| Missing | 65 | 2 |
| Spiculation | 214(45) | 141(65) |
| Missing | 19 | 10 |
| FDG-PET Avidityb (%) | 328(86) | 170(95) |
| Missing | 109 | 47 |
| Patients with complete data (%) | 264(58) | 136(60) |
In the TREAT model, lung cancer risk increased with age, pre-operative lesion size, lesion growth, previous cancer and FDG-PET avidity (Table 3). Smoking intensity measured by pack-years had a non-linear relationship with lung cancer and thus was modeled as a restricted cubic spline (Table 3). The initial model development, prior to bootstrapping, for the TREAT model produced an AUC of 0.89 (95%CI: 0.86–0.92) and Brier score of 0.11. Internal validation with bootstrap adjustment resulted in an AUC of 0.87 (95%CI: 0.83–0.92) and Brier score of 0.12 (CI%: 0.10–0.14). In the VA validation cohort, the AUC for the bootstrapped TREAT model was 0.89 (95%CI: 0.79–0.98) and Brier score was 0.08 (95%CI: 0.06–0.10).
Table 3.
Estimated model coefficients for Mayo Clinic and TREAT models
| Mayo Coefficienta |
TREAT Coefficienta |
TREAT Odds Ratio (95%CI) |
p-value | |
|---|---|---|---|---|
| Constant | −6.827 | −4.715 | ||
| Age(per year) | 0.0391 | 0.0533 | 1.05(1.03, 1.08) | <0.001 |
| BMI | - | −0.0262 | 0.97(0.93, 1.02) | 0.24 |
| Gender-Male | - | −0.0547 | 0.95(0.55, 1.64) | 0.84 |
| Pack-years | - | a | b | 0.02 |
| Smoking History (yes/no) | 0.792 | - | - | - |
| Lesion Size(per mm) | 0.127 | 0.0577 | 1.06(1.04, 1.08) | <0.001 |
| Spiculated lesion edge | 1.041 | 0.277 | 1.32(0.73, 2.40) | 0.26 |
| Lesion location–upper lobe | 0.784 | −0.015 | 1.02(0.58, 1.78) | 0.99 |
| Lesion Growth | ||||
| No lesion growth | - | Reference | Reference | - |
| Insufficient data | - | 0.259 | 1.29(0.56, 2.79) | 0.59 |
| Growth observed | - | 1.160 | 3.18(1.58, 6.39) | 0.003 |
| Previous cancer | 1.339 | 0.639 | 1.89(1.05, 3.42) | 0.03 |
| Predicted FEV1 | - | -0.013 | 0.99(0.97, 1.00) | 0.07 |
| Any pre-opsymptoms | - | -0.461 | 0.63(0.33, 1.20) | 0.16 |
| FDG-PET Avid | - | 1.834 | 6.26(2.78, 14.1) | <0.001 |
Probability {lung cancer=1} =ex/(1+ex); where X= −4.715 + 0.0533*(Age) – 0.0262*(BMI) − 0.0547*(Gender: Male) + 0.02338*(Pack-years) – − 0.000003* (Lesion Size) + 0.277*(Speculated lesion) + 0.015*(Lesion location) + 0.259*{Lesion Growth: Insufficient data} + 1.160*{Lesion Growth: Growth observed} + 0.639*(Previous cancer) – 0.013*(Predicted FEV1) – 0.461*(Any symptoms) + 1.834*(FDG-PED Avid) and {c}=1 if subject is in categoryc, 0 otherwise; , 0 otherwise.
Pack-years is modeled as a restricted cubic spline and therefore odds ratios are not directly interpretable.
The Mayo Clinic model on the VUMC cohort, using published coefficients to estimate lung cancer risk (Table 3), had an AUC of 0.80 (95%CI: 0.75–0.85) which was significantly less (p<0.001) than the AUC observed for the TREAT model (Figure 2). The Mayo Clinic model generally overestimated risk and its Brier score was 0.17 (95%CI: 0.15–0.19), showing poorer calibration than the TREAT model (Figure 3) on the VUMC cohort. The AUC for the Mayo Clinic model on the VA cohort was 0.73 (95%CI: 0.60, 0.85) and Brier score was 0.18 (95%CI: 0.15–0.21). AUC and Brier score in the validation dataset were improvements over that found in the development dataset. The Mayo Clinic model on average predicted a slightly higher probability of lung cancer compared to the TREAT model in individuals with no growth and a higher risk for lung cancer when compared to the TREAT model among individuals with non-avid FDG-PET scans.
Figure 2.
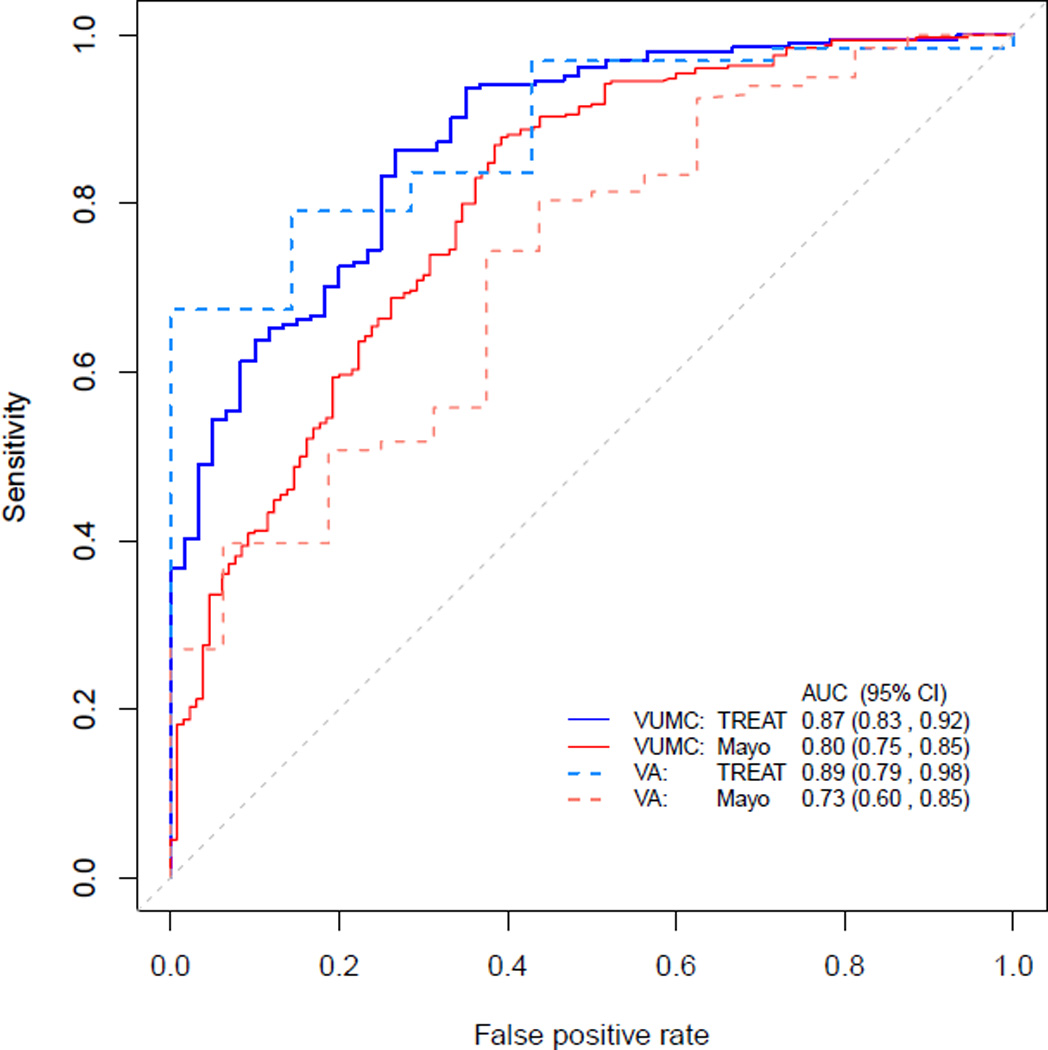
Comparison of area under the receiver operating curve (AUC) for the Mayo Clinic model using originally published estimates and TREAT model in the VUMC and VA cohorts. Confidence intervals for AUC are reported for each estimate model. TREAT model AUC is significantly higher compared to the Mayo Clinic model in each cohort (p<0.001).
Figure 3.
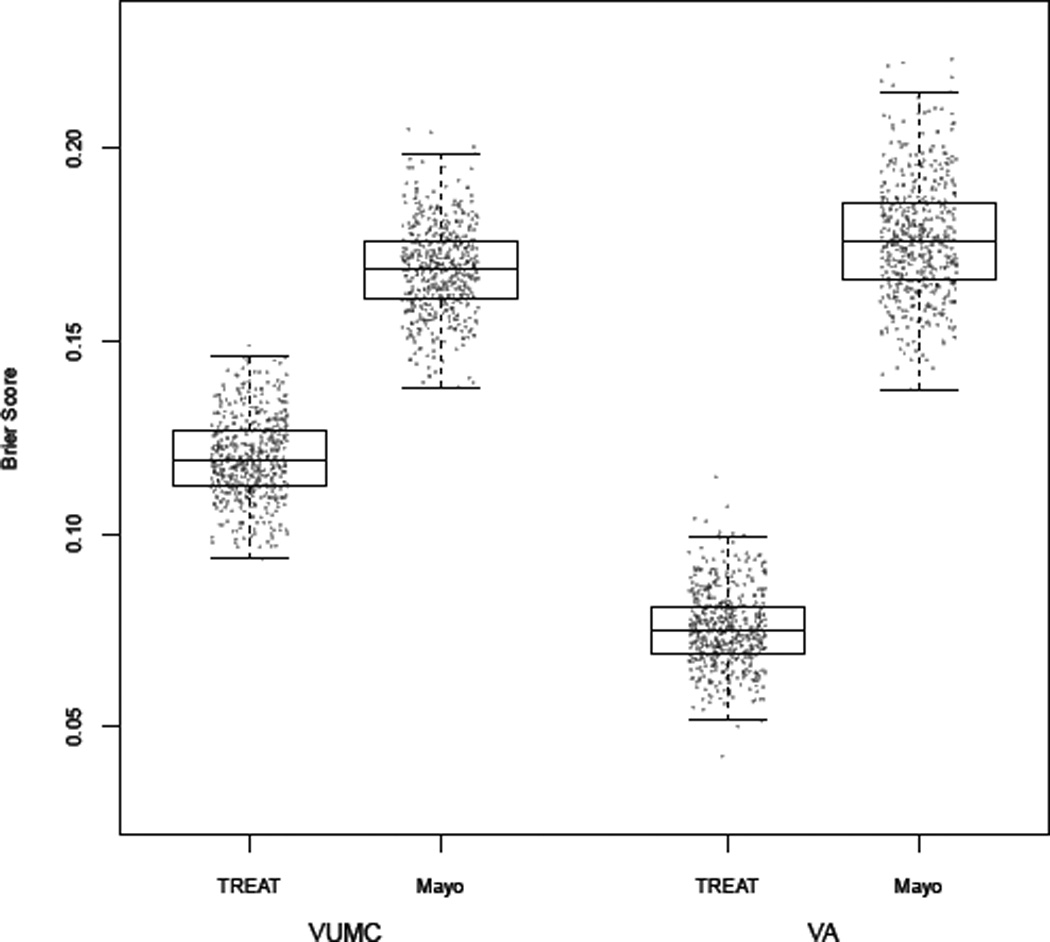
Box plots comparing Brier score from 500 bootstrap samples of the data for each model and from each cohort. Brier score for the TREAT model exhibited better calibration of predicted probability of lung cancer when compared to the Mayo Clinic model in the VUMC cohort (TREAT = 0.12 vs Mayo Clinic = 0.17) and VA cohort (TREAT = 0.07 vs Mayo Clinic 0.18). Brier score values of 0.25 are the same as a chance and lower values of Brier score represent increased calibration of the model. As Brier score decreases from 0.25 to zero, the predicted probability of cancer increasingly equals the observed probability of cancer and the calibration is improved.
Discussion
Clinicians evaluating pulmonary nodules are faced with a basic question of equipoise. Unlike biopsy for breast, prostate or colon cancer, the lung nodule is difficult to access, and lung biopsy has significant risks associated with the procedure. Reviews of outcomes after lung surgery have found 1% to 3% mortality rates within 30 days and rates as high as 7% at 90 days.4, 28–30 If the patient under evaluation has marginal lung function and other pre-operative comorbidities, then the likelihood of a poor outcome increases. This procedural risk is juxtaposed against the danger of missing a curable lung cancer. One suggested solution is for the clinician to delay biopsy and treatment until a more definitive non-invasive diagnosis is possible. The effects of diagnosis and treatment delay from the time of lesion discovery to stage progression and metastasis is not well known.31 Thus, clinical practice typically focuses on timeliness of care even for a small and localized cancer. We propose a new, validated clinical prediction model for lung cancer in a patient population with lung nodules being evaluated for a surgical lung biopsy. The TREAT lung cancer model provided a high and consistent predictive discrimination for lung cancer based upon common clinical characteristics and performed better than the Mayo Clinic model. The TREAT model’s high level of discrimination may be valuable in providing clinical guidance in estimating individual likelihood of lung cancer.
We identified superior performance of the TREAT lung cancer model (AUC = 0.87 95%CI: 0.83–0.92) compared to the Mayo Clinic model (AUC = 0.80 95%CI: 0.75–0.85) and validated the TREAT model (AUC = 0.89) in a separate cohort with higher prevalence of disease and higher acuity from a nearby Veterans Affairs institution. The Mayo Clinic model performed well in the VUMC population although the prevalence of disease in our cohort was higher (72%) than in the population in which the Mayo Clinic model was developed (23%) and validated (44%).14–16 As the prevalence of disease increased to 95%, as was found in the VA validation cohort, the accuracy of the Mayo Clinic model to discriminate malignancy decreased (AUC = 0.73). The calibration of the Mayo Clinic model, as measured by Brier score, also decreased as the prevalence of disease increase in the two cohorts for surgical evaluation. The Mayo Clinic model appears to underestimate risk for cancer in the lower quintiles of lung cancer risk in these populations which limits its use in clinical practice for patients being evaluated for surgery.18 Two factors are clear. First, the population being evaluated by surgeons has a higher prevalence of lung cancer than other lung nodule evaluated populations.9, 32, 33 Second, the guideline suggested model for estimating the likelihood of malignancy is less accurate in terms of discrimination and calibration in these two surgical populations.
The addition of FDG-PET avidity and lesion growth as predictive variables contributed to the TREAT model’s superior discrimination. Exploratory analyses of the model with Bland –Altman plots showed that PET avidity and growth accounted for the majority of differences in prediction between the two models in the VUMC cohort (Supplement 1). The differences in predicted cancer risk between the two models were consistent across bootstrap generated datasets (Supplement 2). The TREAT model takes advantage of this additional information available to surgeons at the time of evaluation. The addition of FDG-PET, lesion growth, predicted FEV1 and presentation with any symptoms improved the discrimination between benign disease and lung cancer.
At this time our findings have some limitations. The cohort used for model development was a retrospective review of a single tertiary academic medical center’s database containing prospectively collected information supplemented by medical chart review for specific variables. The external validation cohort had a high prevalence of disease and the observed improvement in discrimination is likely due, in part, to the high prevalence of cancer in this cohort. This cohort was primarily a Veteran population so there were more male smokers with preoperative symptoms. These differences did not result in a drop in the AUC or Brier score and may improve the generalizability of the model. Other surgical populations being evaluated for lung resection may have differing prevalence of disease, referral patterns, radiologist expertise or other underlying factors, like endemic granulomatous disease which are important considerations for clinical prediction models intended to apply to the more than a single institution.22 The impact of these possible predictors of lung cancer is relevant to future work as the TREAT model is validated in other populations.
As in most clinical datasets used for association studies or predictive models, missing data for the predictors of interest is a constraint in our study. In the development of the TREAT model, statistical methods were used to impute missing variables and analyses determined the impact of this missing data on the model. We chose to include 41 patients who did not have a surgical resection and underwent radiographic surveillance. Including these patients increased the missing data in the cohort, but more importantly, excluded a bias in the spectrum of risk encountered by clinicians and minimized additional bias arising from patients not undergoing resection. For example, predicted FEV1 is generally not performed unless resection is likely as clinical quality guidelines suggest performing pulmonary function tests prior to lung resection. This pattern of work-up bias between individuals indicates that the data may not be missing at random. The multiple imputation algorithm used depends on the missing at random assumption given known covariate patterns, and our investigation of this assumption did not yield any indications that would be concerning. In a sensitivity analysis, TREAT model results with only complete data was similar to that estimated using imputed data.
Although little difference was observed in the bootstrap adjusted AUC or Brier scores when compared to the initial estimates of AUC and Brier score, the model must be validated in independent, external populations prior to use in the clinical setting. Other cohorts for external validation of the TREAT model should have differing prevalence of disease and from other regions of the country to assess the generalizability of the TREAT model in aiding surgeons evaluating a lung nodule.
The prediction model developed by Bach, the Liverpool model and that developed by Tammemägi and colleagues are intended to determine who would most benefit from lung cancer screening.10, 13, 34 The Mayo Clinic, the VA Lung Cancer and the Solitary Pulmonary Nodule (SPN) models for characterizing lung nodules after their discovery for surgical biopsy were developed and validated in populations with lower prevalences of lung cancer than observed here.15–17 A recently published model to characterize the likelihood a screening discovered lung nodule was cancerous had an extremely high AUC of 0.94, but it was developed and calibrated in screening populations with a 5.5% prevalence of lung cancer.35 When examining the landscape of clinical prediction models for lung cancer, the niche for clinicians evaluating a patient immediately prior to surgery is currently unfilled.36 The TREAT model addresses that need. Future work will validate the TREAT model in external datasets with varying prevalence of malignancy to measure the changes in the negative predictive value of the model. Application of the TREAT model in the clinical setting requires prospective evaluation of the model to determine the those cut points of predicted risk that both minimizes the risk of missing a lung cancer with the harms of a futile thoracotomy.
Conclusion
In a population with a radiographically confirmed lung lesion being evaluated for possible resection, the TREAT model predicted the risk for lung cancer with high accuracy and an AUC of 0.87. The model was validated and showed little overfitting in its accuracy to discriminate between lung cancer and benign disease. The TREAT model incorporates the full spectrum of epidemiologic and radiographic evidence available to surgeons in the United States today, and it better predicts lung cancer with a higher AUC than existing published models. This model will be validated in additional external datasets and if valid applied in a prospective study to reduce unnecessary pulmonary resections.
Supplementary Material
Acknowledgments
Support: Department of Veterans Affairs, Veterans Health Administration, Health Services Research and Development Service Career Development Award 10-024 (E.L.G.) and NIH/NCI K07CA172294 (M.C.A.). This work was also supported by Vanderbilt Institute for Clinical and Translational Research grant, UL1TR000011 from NCATS/NIH (REDCap database). Vanderbilt Physician Scientist Development Award (E.L.G.), the lung SPORE CA90949 (P.P.M.), the EDRN CA152662, a Merit award from the Department of Veterans Affairs (P.P.M.).
References
- 1.Siegel R, Ward E, Brawley O, et al. Cancer statistics, 2011: The impact of eliminating socioeconomic and racial disparities on premature cancer deaths. CA Cancer J Clin. 2011;61:212–236. doi: 10.3322/caac.20121. [DOI] [PubMed] [Google Scholar]
- 2.Jemal A, Siegel R, Xu J, et al. Cancer statistics, 2010. CA Cancer J Clin. 2010;60:277–300. doi: 10.3322/caac.20073. [DOI] [PubMed] [Google Scholar]
- 3.CDC. Cigarette Smoking Among Adults and Trends in Smoking Cessation - US, 2008. Health and Human Services Centers for Disease Control and Prevention, ed. 2009 MMWR CDC Surveill Summ.: 1227–1232 Available at http://www.cdc.gov/mmwr/PDF/wk/mm5844.pdf. [PubMed]
- 4.National Lung Screening Trial Research Team. Aberle DR, Adams AM, et al. Reduced Lung-Cancer Mortality with Low-Dose Computed Tomographic Screening. N Engl J Med. 2011;365:395–409. doi: 10.1056/NEJMoa1102873. [DOI] [PMC free article] [PubMed] [Google Scholar]
- 5.Deppen S, Putnam JB, Jr, Andrade G, et al. Accuracy of FDG-PET to diagnose lung cancer in a region of endemic granulomatous disease. Ann Thorac Surg. 2011;92:428–432. doi: 10.1016/j.athoracsur.2011.02.052. discussion 433. [DOI] [PMC free article] [PubMed] [Google Scholar]
- 6.Kozower BD, Meyers BF, Reed CE, et al. Does Positron Emission Tomography Prevent Nontherapeutic Pulmonary Resections for Clinical Stage IA Lung Cancer? Ann Thorac Surg. 2008;85:1166–1170. doi: 10.1016/j.athoracsur.2008.01.018. [DOI] [PubMed] [Google Scholar]
- 7.Veronesi G, Bellomi M, Scanagatta P, et al. Difficulties encountered managing nodules detected during a computed tomography lung cancer screening program. J Thorac Cardiovasc Surg. 2008;136:611–617. doi: 10.1016/j.jtcvs.2008.02.082. [DOI] [PubMed] [Google Scholar]
- 8.Starnes SL, Reed MF, Meyer CA, et al. Can lung cancer screening by computed tomography be effective in areas with endemic histoplasmosis? The Journal of Thoracic and Cardiovascular Surgery. 2011;141:688–693. doi: 10.1016/j.jtcvs.2010.08.045. [DOI] [PubMed] [Google Scholar]
- 9.Kuo E, Bharat A, Bontumasi N, et al. Impact of Video-Assisted Thoracoscopic Surgery on Benign Resections for Solitary Pulmonary Nodules. Ann Thorac Surg. 2012;93:266–273. doi: 10.1016/j.athoracsur.2011.08.035. [DOI] [PubMed] [Google Scholar]
- 10.Bach PB, Kattan MW, Thornquist MD, et al. Variations in lung cancer risk among smokers. J Natl Cancer Inst. 2003;95:470–478. doi: 10.1093/jnci/95.6.470. [DOI] [PubMed] [Google Scholar]
- 11.Spitz MR, Etzel CJ, Dong Q, et al. An Expanded Risk Prediction Model for Lung Cancer. Cancer Prev Res. 2008;1:250–254. doi: 10.1158/1940-6207.CAPR-08-0060. [DOI] [PMC free article] [PubMed] [Google Scholar]
- 12.Cassidy A, Duffy SW, Myles JP, et al. Lung cancer risk prediction: A tool for early detection. Int J Cancer. 2007;120:1–6. doi: 10.1002/ijc.22331. [DOI] [PubMed] [Google Scholar]
- 13.Tammemägi MC, Katki HA, Hocking WG, et al. Selection Criteria for Lung-Cancer Screening. N Engl J Med. 2013;368:728–736. doi: 10.1056/NEJMoa1211776. [DOI] [PMC free article] [PubMed] [Google Scholar]
- 14.Swensen SJ, Silverstein MD, Ilstrup DM, et al. The probability of malignancy in solitary pulmonary nodules. Application to small radiologically indeterminate nodules. Arch Intern Med. 1997;157:849–855. [PubMed] [Google Scholar]
- 15.Schultz EM, Sanders GD, Trotter PR, et al. Validation of two models to estimate the probability of malignancy in patients with solitary pulmonary nodules. Thorax. 2008;63:335–341. doi: 10.1136/thx.2007.084731. [DOI] [PMC free article] [PubMed] [Google Scholar]
- 16.Gurney JW, Lyddon DM, McKay JA. Determining the likelihood of malignancy in solitary pulmonary nodules with Bayesian analysis. Part II. Application. Radiology. 1993;186:415–422. doi: 10.1148/radiology.186.2.8421744. [DOI] [PubMed] [Google Scholar]
- 17.Gould MK, Donington J, Lynch WR, et al. Evaluation of individuals with pulmonary nodules: When is it lung cancer?: diagnosis and management of lung cancer, 3rd ed: american college of chest physicians evidence-based clinical practice guidelines. CHEST Journal. 2013;143:e93S–e120S. doi: 10.1378/chest.12-2351. [DOI] [PMC free article] [PubMed] [Google Scholar]
- 18.Isbell JM, Deppen S, Putnam JB, Jr, et al. Existing general population models inaccurately predict lung cancer risk in patients referred for surgical evaluation. Ann Thorac Surg. 2011;91:227–233. doi: 10.1016/j.athoracsur.2010.08.054. discussion 233. [DOI] [PMC free article] [PubMed] [Google Scholar]
- 19.Grogan EL, Jones DR. VATS lobectomy is better than open thoracotomy: what is the evidence for short-term outcomes? Thorac Surg Clin. 2008;18:249–258. doi: 10.1016/j.thorsurg.2008.04.007. [DOI] [PubMed] [Google Scholar]
- 20.Society of thoracic surgeons. [Accessed 07/21/2013];General Thoracic Surgery Database. Available at http://www.sts.org/sts-national-database/database-managers/general-thoracic-surgery-database.
- 21.Grogan EL, Weinstein JJ, Deppen SA, et al. Thoracic Operations for Pulmonary Nodules Are Frequently Not Futile in Patients with Benign Disease. J Thorac Oncol. 2011;6:1720–1725. doi: 10.1097/JTO.0b013e318226b48a. [DOI] [PMC free article] [PubMed] [Google Scholar]
- 22.Grogan EL, Deppen SA, Ballman KV, et al. Accuracy of Fluorodeoxyglucose-Positron Emission Tomography Within the Clinical Practice of the American College of Surgeons Oncology Group Z4031 Trial to Diagnose Clinical Stage I Non-Small Cell Lung Cancer. The Annals of Thoracic Surgery. 2014;97:1142–1148. doi: 10.1016/j.athoracsur.2013.12.043. [DOI] [PMC free article] [PubMed] [Google Scholar]
- 23.National Comprehensive Cancer Network. Lung Cancer Screening v1.2014. NCCN Clinical Practice Guidelines in Oncology (NCCN Guidelines) [serial online] [Accessed 10-27-2011]. Available from National Comprehensive Cancer Network. [Google Scholar]
- 24.Harrell FEJ. Regression Modeling Strategies. Charlottesville, VA: Springer; 2001. [Google Scholar]
- 25.Potthoff RF, Tudor GE, Pieper KS, et al. Can one assess whether missing data are missing at random in medical studies? Statistical Methods in Medical Research. 2006;15:213–234. doi: 10.1191/0962280206sm448oa. [DOI] [PubMed] [Google Scholar]
- 26.Steyerberg EW. Clinical Prediction Models. Springer; 2009. [Google Scholar]
- 27.Steyerberg EW, Harrell FE, Borsboom GJJM, et al. Internal validation of predictive models: Efficiency of some procedures for logistic regression analysis. J Clin Epidemiol. 2001;54:774–781. doi: 10.1016/s0895-4356(01)00341-9. [DOI] [PubMed] [Google Scholar]
- 28.von Meyenfeldt EM, Gooiker GA, van Gijn W, et al. The Relationship Between Volume or Surgeon Specialty and Outcome in the Surgical Treatment of Lung Cancer: A Systematic Review and Meta-Analysis. J Thorac Oncol. 2012;7:1170–1178. doi: 10.1097/JTO.0b013e318257cc45. [DOI] [PubMed] [Google Scholar]
- 29.Cheung M, Hamilton K, Sherman R, et al. Impact of Teaching Facility Status and High-Volume Centers on Outcomes for Lung Cancer Resection: An Examination of 13,469 Surgical Patients. Ann Surg Oncol. 2009;16:3–13. doi: 10.1245/s10434-008-0025-9. [DOI] [PubMed] [Google Scholar]
- 30.Powell HA, Tata LJ, Baldwin DR, et al. Early mortality after surgical resection for lung cancer: an analysis of the English National Lung cancer audit. Thorax. 2013;68:826–834. doi: 10.1136/thoraxjnl-2012-203123. [DOI] [PubMed] [Google Scholar]
- 31.Quarterman RL, McMillan A, Ratcliffe MB, et al. Effect of preoperative delay on prognosis for patients with early stage non-small cell lung cancer. The Journal of Thoracic and Cardiovascular Surgery. 2003;125:108–114. doi: 10.1067/mtc.2003.93. [DOI] [PubMed] [Google Scholar]
- 32.Smith MA, Battafarano RJ, Meyers BF, et al. Prevalence of Benign Disease in Patients Undergoing Resection for Suspected Lung Cancer. Ann Thorac Surg. 2006;81:1824–1829. doi: 10.1016/j.athoracsur.2005.11.010. [DOI] [PubMed] [Google Scholar]
- 33.Grogan EL, Deppen SA, Ballman KV, et al. Accuracy of Fluorodeoxyglucose-Positron Emission Tomography Within the Clinical Practice of the American College of Surgeons Oncology Group Z4031 Trial to Diagnose Clinical Stage I Non-Small Cell Lung Cancer. The Annals of Thoracic Surgery. 2014 doi: 10.1016/j.athoracsur.2013.12.043. [DOI] [PMC free article] [PubMed] [Google Scholar]
- 34.Cassidy A, Myles JP, van Tongeren M, et al. The LLP risk model: an individual risk prediction model for lung cancer. Br J Cancer. 2007;98:270–276. doi: 10.1038/sj.bjc.6604158. [DOI] [PMC free article] [PubMed] [Google Scholar]
- 35.McWilliams A, Tammemagi MC, Mayo JR, et al. Probability of Cancer in Pulmonary Nodules Detected on First Screening CT. New England Journal of Medicine. 2013;369:910–919. doi: 10.1056/NEJMoa1214726. [DOI] [PMC free article] [PubMed] [Google Scholar]
- 36.Division of Cancer Control and Population Sciences. [Accessed 05/06/2014 2014];Lung Cancer Prediction Models. 2013 May 02; Available at http://epi.grants.cancer.gov/cancer_risk_prediction/lung.html.
Associated Data
This section collects any data citations, data availability statements, or supplementary materials included in this article.