

Abstract
Global Positioning Systems (GPS) are increasingly applied in activity studies, yet significant theoretical and methodological challenges remain. This paper presents a framework for integrating GPS data with other technologies to create dynamic representations of behaviors in context. Utilizing more accurate and sensitive measures to link behavior and environmental exposures allows for new research questions and methods to be developed.
Keywords: GPS, GIS, accelerometer, physical activity, sedentary behavior, dynamic exposure
INTRODUCTION
Ecological approaches to health and behavior have long held that place matters for health(29). Physical activity (PA) and sedentary behavior (SB) research has focused on the influence of the built and social environment with mixed results ranging from strong associations between walkability and walking for transport in adults, to smaller and less consistent findings for other environmental features such as parks and total PA (25). One substantial problem for many of these studies is a lack of measures that accurately represent the hypothesized relationships between PA/SB and environment. This most often is exhibited through a mismatch between the specificity of a question and measured outcomes, where neither the environment nor the behavior are specified appropriately. For example, assessing one environment, e.g., home, and relating it to total PA is inappropriate because much PA occurs away from home.
Recent theoretical and methodological advances are calling for more dynamic and fluid approaches, which can allow for greater specificity and flexibility in exploring relationships between place and health(4). For PA and SB research, the uptake of Global Positioning System (GPS) offers a technological solution to linking objective measures of PA to locations. These data can then be represented within Geographic Information Systems (GIS), which allows researchers to create detailed contextual measures of the environment such as walkability, park access, and residential density. Taken together, GPS, accelerometry, and GIS can trace an individual’s course through multiple contexts, which may differ in terms of their health promoting or health damaging features (18). These technologies can substantially increase measured accuracy, sensitivity, and objectivity of an individual’s exposure to environments while they engage in activity behaviors. Better measurement of when and where people are active and inactive will allow for more specific research questions that can explore behaviors throughout the day and in specific contexts, and can help intervention development.
Here we present a framework for how the three technologies – accelerometer, GPS and GIS - can be used together. We detail the types of outputs a researcher can expect from these data, how utilizing the technologies in tandem can produce new sets of information, and three analytical approaches that can guide researchers in analysis decisions. Depending on research questions, data collection, and analysis approach, we discuss a number of data collection and analysis issues of which researchers should be aware. We conclude with future steps for GPS data in PA and SB studies.
Representing behaviors in their context
Interest in the use of GPS and GIS in PA and SB research aligns with trends in geographic health theory, which is moving away from understanding context as static or fixed (e.g., a home neighborhood), and is moving toward dynamic conceptualizations of place that can lead to better understandings of the diverse contextual impacts of place on health (7). This trend is partly due to increased specificity and accuracy of measurement methods, and is supported by research on human activity-travel patterns, which shows highly individualized and complex spatial routines with significant movement and behaviors beyond the home for many, if not most, populations(24). We define accuracy as the degree to which a measurement system is able to reflect a quantity’s true value (e.g., how much true PA a person does), and sensitivity as the proportion of positives correctly identified as such (e.g., time spent in the home environment versus time spent outside the home). Applying these concepts to PA and SB by incorporating GPS data with accelerometer counts, researchers can move beyond total PA intensity and begin analyzing specific health behaviors in time and place (28).
Other than movement itself, there is a need to increase specificity and accuracy of the context in which that movement is taking place. A review of reviews by Bauman et al. (2) of potential correlates of PA concluded that few consistent environmental correlates have been identified for transport and leisure related PA. Inconclusive results may in part be attributed to differences in definitions of the environmental correlates used, differences in the buffer types used, as well as differences in measuring PA. All of these issues tie back to a lack of sensitivity and accuracy in measurement methods. This may result in underestimated assessments of the multiple environments individuals interact with throughout a day, potentially resulting in underestimated effect sizes or measurement biases (17). The Uncertain Geographic Context Problem described by Kwan (23), highlights the need for selecting the ‘right’ neighborhood as associations between environment and behavior will differ if the selected neighborhood does not match with the behavior in time and/or space. This could explain inconsistencies in research findings as the commonly used methods (home/work buffers) are not correctly representing the spatial area in which the behavior in question occurs (27). As Spielman and Yoo(32) advise: “If you’re going to spend time and money painting a picture of the relationship between the environment and health invest in the frame – unless the frame is well designed the painting isn’t going to be very good”.
Matching research questions to specific and accurate methods
While we posit that use of GPS, GIS, and accelerometer data together will increase specificity and accuracy of both PA/SB behaviors and contexts, such an approach must begin with appropriate research questions that justify the time, cost, and effort of working with these technologies. In Figure 1, we visualize combinations of methodological approaches using a mix of self-reports, GIS, accelerometer data, and GPS. We place four examples of these approaches along a continuum of accuracy and sensitivity as to how well they measure environmental exposure as individuals engage in PA and SB.
Figure 1.

Sensitivity and accuracy of various methodological combinations for assessing environmental exposure as individuals engage in physical activity and sedentary behavior.
It is important to note that while all of these methodologies are able to answer various relevant questions about health behavior and context, it is only at the end of the continuum toward measures which combine GPS, accelerometer, and GIS data that actual environmental context during specific PA/SB behaviors can be measured. Self-reported measures are neither very sensitive nor accurate in recording behavior and the behavioral context, however they can give an indication of relevant factors, and might be the only feasible alternative for very large population studies. Self-reported environmental assessments do allow for the psychological construct of “perceived” environment to be included in analyses, which in some instances can be a better predictor for behavior than the objectively measured environment. However, due to the uncertainty in what respondents perceive to be their neighborhood, results are difficult to use in planning. Furthermore, recall of multiple environments (e.g. home, work, school, church, friend’s house) to assess total exposure would be burdensome resulting in missed or inaccurate environmental exposures, and may result in considerable recall bias.
Moving to the two center panes of Figure 1, we can observe some increases in sensitivity and accuracy. PA/SB measured using either self-reported data or total weekly/daily accelerometer counts does not typically consider when and where this activity is occurring, which from a health outcome can be informative. Research suggests that PA intensity and duration is higher outdoors(21), so where activity takes place may contribute to health outcomes. Also from an intervention perspective, having more information about the context of the behavior is very useful. Measures such as the Neighborhood Physical Activity Questionnaire (NPAQ) assess PA within and outside a neighborhood (13) providing some additional context, and include SB measures that assess behaviors “at work” or “during the week ”vs “weekend”. But it is not clear if such specificity in survey items assesses behaviors more accurately, or leads to overestimation because research participants do not necessarily think about where behaviors occur. The International Physical Activity Questionnaire (IPAQ), for example, tends to overestimate PA (30), most likely because so many specific behaviors (leisure, transport, occupational, housework) are assessed at the same time and totaled.
Combining PA survey data with GIS data of specific environments makes it possible to standardize the neighborhood definition across individuals and create objective measures of the environment within specific boundaries. The addition of GIS measures of home or work environments to accelerometer data gives more accurate exposure measures than self-report in those locations. However, these limited locations (where an individual may or may not spend significant portions of their day, and where PA may or may not occur) do not represent total daily exposure. The types of research questions that can be answered using the methods described in these two center panes are limited to the relationship between total self-reported or accelerometer PA/SB, and GIS environmental measures of participant defined places such as home, school, or work. This type of data typically cannot answer questions about general environmental exposure and specific PA/SB behaviors, PA/SB in particular locations, nor PA/SB at certain times of day.
The example at the far right of Figure 1 depicts a GPS track of walking occurring in a range of walkable environments, tying a specific behavior to the environment in which that behavior is occurring. This figure reflects an individual’s behavior-driven exposure to healthy and unhealthy environments as they move through their day. The data facilitate a new set of research questions that need specific and accurate measures of behaviors, times, and places.
A FRAMEWORK FOR COMBINING GPS, GIS, AND ACCELEROMETER DATA
In Figure 2 we present a framework for integration of GPS, GIS, and accelerometer data, including data collection considerations, possible data outputs from joining specific technologies, and analytical strategies when using all three measurement methods together. The framework is meant to guide researchers through conceptual development of GPS based PA and SB projects by deepening the understanding of what the data represents, the types of research questions that are and are not possible to answer with the data, how to combine datasets to create better representations of human-environment interactions, and the details for data collection, handling, and analysis that must be considered to ensure successful project completion. We begin with an overview of the three technologies and the types of outputs that can be obtained from combining them together, illustrated in the middle of Figure 2. We then move to discussing three conceptual approaches (time, space, behavior) that can frame analytical decisions, and provide examples. And finally we discuss data and analytical aspects that must be considered when planning this type of research, largely dependent on the research question being asked.
Figure 2.

Framework for integration of GPS, accelerometer, and GIS technology.
At its most basic level, GPS data provides latitude, longitude, and time – three variables that allow us to assess when an individual is located where. Data can be collected at various intervals ranging from every second to every few hours. Depending on memory, battery life limitations, and desired interval of data collection, outputs of GPS for multiple individuals over days or weeks will result in large datasets ranging from 10s of thousands to 10s of millions of points. Newer GPS technologies are also able to collect and derive variables such as speed, elevation, indoor/outdoor, and communication between the device and satellites, which provides measures of the spatial accuracy of data points. It is essential to recognize that while GPS data in its raw format is a collection of points, together they represent fluid and dynamic traces of movement through time and place. Just as there are cut-points in accelerometer data to define levels of activity intensity, one of the largest challenges in exposure assessment research is determining where to ‘cut’ GPS data to turn points into meaningful locations, trips, and activity spaces. The fields of geography and computer science have developed methodologies that public health can draw on, ranging from simple clustering algorithms to more complex assessments of ‘interesting’ locations and travel sequences (37).
Accelerometers provide objective information on PA intensity, most often presented as activity counts per minute. While PA intensity may be an important concept for health, it lacks the desired specificity that might support health promotion efforts. For example, it is not clear at what intensity older adults walk, which may underestimate the effects of a walking intervention in this age group. Further, hip worn accelerometers poorly assess some behaviors such as bicycling, and cut offs for SB may underestimate driving behaviors(19). In Figure 2 we see that by adding GPS to accelerometer data, the additional variables of speed and trajectories can be combined with intensity to assess bicycling, walking and driving behaviors. This also allows for the potential of assigning PA/SB and travel modes to times and places, which then allow for the data to be placed as contextual variables in a GIS.
GIS provides a computational background where variables are joined in space, allowing analysis of GPS and accelerometer data within environmental contexts of interest. Currently, the dominant mode of PA and SB environmental assessment is centered on combining GIS and accelerometer data – focusing on specific a priori locations such as the home or work address and extracting environmental variables from GIS for those locations using a buffer (3). Most studies utilize a home-based buffer, either using a distance threshold based on a Euclidian distance (as the crow flies), or distance measured using the road network (network distance). This threshold distance varies from study to study, but should ideally be related to the outcomes of interest, contextual factors and study area (27). A relatively new type of buffer is the so-called sausage buffer that can be constructed similarly independent of the GIS software used (10). Many different types of environmental variables are measured within these buffers (3), with walkability (11) being one of the more common.
By joining GPS data with GIS and accelerometery, a new set of research possibilities become accessible through dynamic exposure analysis, which draws on the availability of information about PA and SB as individuals move through space and time. As such, in formulating research questions utilizing dynamic measures, we propose conceptualizing interactions with the environment in three ways: temporally, spatially, and behaviorally (Figure 2, right boxes).
ANALYTICAL APPROACHES
Exposure through time
Time is an often overlooked analytical approach for PA and SB outcomes. While most often used to tie together accelerometry and GPS data, the time stamps collected from these devices can give rich and detailed histories of when individuals are engaging in activities, what spaces are used at various times of days, as well as duration and sequences of activities. Currently, there is little theoretical discussion in the literature of what time means for exposure, and if this might have any bearing on PA and SB behaviors. Does spending more time in an environment have any bearing on likelihood of engaging in certain behaviors there? Is there a threshold of a number of times one must be in an environment for an effect to take hold, or are certain times of day more likely to see PA/SB behaviors than others?
One methodology for exploring the integrated effects of time and exposure is the kernel density estimation (KDE) approach, which can be used to smooth a number of GPS points into a continuous surface. Further, this smoothing effect gives an element of distance decay rather than specific distance cut offs (such as 1 km or 500 meters). In Figure 3 (left), an individual is standing in a traditional buffer, which cuts off at an arbitrary distance and equally weighs all elements contained in the buffer. This is a discrete representation of space. Individuals’ experience with environment in daily living is continuous in nature, with some degree of distance decay where nearby things may exert more influence, and faraway things are less important. Furthermore, as one spends more time in an environment, there is greater potential influence of features in the environment. The application of a smoothed weighted function, illustrated as a kernel in the figure, demonstrates how a continuous representation based on distance decay may provide a more realistic model of environmental exposure(12). Applied to a collection of GPS points (Figure 3 right), the time element of an individual’s behavior is taken into account through the density of GPS points, which result in a greater exposure weight.
Figure 3.
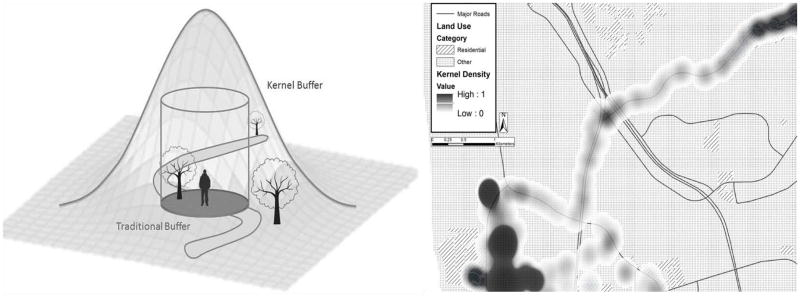
Theoretical visualization of the smoothing effect of kernel density estimation (left) and application in practice to one total day of GPS data (right).
Applying the KDE approach to free living GPS tracks for modeling PA or SB outcomes may provide insight into ways of conceptualizing exposure and environmental interaction. Separating indoor time from outdoor time, movement from stationary activity, or focusing on specific domains like work or home are all possible ways of examining KDE exposures. Furthermore, this approach has potential when combined with elements of GPS data such as speed or transportation mode, as well as GIS data such as roads, buildings, residential density, or parks. The kernel may be adjusted mathematically by the functional form of the kernel or bandwidth changes as an individual moves through the day. For example a uniform function and small bandwidth might be applied as an individual travels at high speeds in a vehicle representing limited exposure opportunity. This might change to a Gaussian function with larger bandwidth as an individual leisurely strolls through a park where more exposure opportunity is present.
As time based analysis is further integrated into PA and SB studies, more complex space-time modeling strategies can be employed such as activity cubes to model the possible range of physical activities an individual can engage in, or Bayesian modeling to determine if events and exposures during one day influence activities in the next day.
Exposure through space
As discussed previously, a significant challenge for working with GPS data points is making decisions about how to aggregate points into meaningful and useful data elements. Time is one mechanism for making such decisions, and another is space. Spatial aggregations can be created from data driven methodologies, which most often identify clustering of points (locations) and trajectories (trips) using location and time data. Research questions that can make use of a data driven approach may focus on discovery of top locations where a participant spends time, or identification of all possible routes taken to school. Spatial aggregations can also be created from places of interest identified by a researcher or participant, such as the aggregation of GPS points within a home buffer, or identification of number of times a specific route was taken. Aggregating GPS points into specific and meaningful spatial elements is essential for transforming the overwhelming amount of GPS points into more manageable data sets, as well as for the development of more targeted research questions.
Location detection algorithms using GPS data in geographic and computation literatures exist; however the introduction of additional physical activity or temporal variables may offer novel conceptualizations of locations that are specific for health and PA research. Data driven location identification may uncover unexpected types of locations where PA behaviors occur. This may be particularly useful for non-destination driven PA (such as a run around the block), which may be difficult to identify using route analysis because there are unclear origin and destination points. In these terms, the block may be better conceptualized as a location, and represented as such in spatial aggregations.
For example, in Figure 4 three different data-driven clustering algorithms are used to delineate locations from a GPS track of one participant, focusing on a hiking route. The first algorithm, a kernel density approach (not to be confused with the KDE method discussed earlier), extracts locations by detecting high density point clouds(34). The second algorithm, used by the Personal Activity and Location Measurement System (PALMS, https://ucsd-palms-project.wikispaces.com/), determines locations by calculating distances between consecutive points and assigning locations if distances fall below a certain user-determined threshold. The kernel locations are shown in diamonds and PALMS locations shown in circles; the locations detected by the algorithms overlap considerably, however the kernel approach is more sensitive, picking up locations where less time is spent. The third algorithm, AMOEBA (1), uses spatial autocorrelation of points to derive statistically significant clusters as compared to the global mean distribution of points in the data set. So if some points are significantly more clustered than the mean distribution, AMOEBA detects a location. This algorithm has potentially fascinating applications for determining locations based on the movement pattern of an individual, rather than setting global thresholds. In Figure 4, AMOEBA has detected the hike as a location due to the clustered nature of the movement (as compared to driving or regular walking), creating a PA space.
Figure 4.
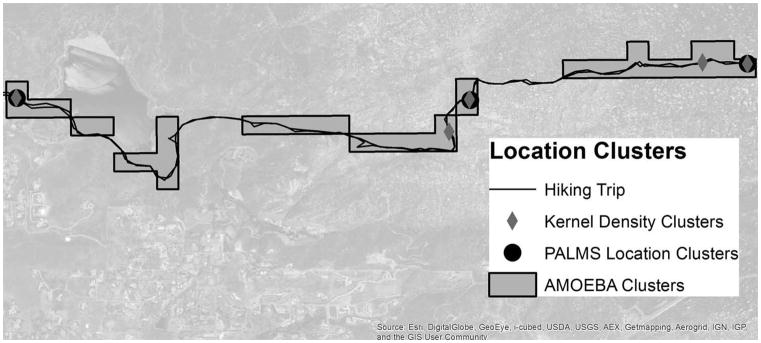
Hiking ‘locations’ extracted using three different location detection algorithms, two identifying stops and the third identifying a physical activity space.
Exposure through behavior
A third approach for analyzing combined GPS, GIS, and accelerometer data is focusing on specific behaviors as measured by the devices. Identification of ‘activity bouts’, or consecutive periods of specific types of activity, may provide greater insight into the context of activity behavior. Aggregating in this manner allows the researcher to discard data that does not belong in that activity classification, effectively reducing the data and making it more manageable. Furthermore, by achieving greater detail in classifications of behavior, there is the potential to ask more specific research questions regarding activities in context. Rather than relating walkability to all accelerometer measures above a certain cut point, specificity in behavior allows us to relate walkability to objectively measured walking, for example.
Currently the activity classifications derived from accelerometer data used for PA research rely on cut-points linked to energy expenditure, classifying movement into sedentary, light, or moderate to vigorous activity. However, the use of cut-points is widely debated, and various researchers are working on the development of behavior identification methods. In the PA arena, researchers are employing new techniques, including machine learning, to better predict behaviors from accelerometer (33) or accelerometer and GPS data (9). Typically speed and distance features from the GPS are employed in such classifications. However, some behaviors such as housework, which might be hard to distinguish by PA patterns alone, could be better predicted when the x,y coordinates from the GPS are matched with GIS data, e.g., residential land use (which indicates a home) within a machine learning framework. In other words, GIS data can help inform behavior prediction. Studies have already employed GIS to improve travel mode classifications, for example GPS traces in combination with bus route data can help distinguish car time from bus travel(15).
DATA AND ANALYTICAL CONSIDERATIONS
Validity and reliability of behavior: Representations of daily patterns and habits
With the development of more continuous accelerometer measurements there has been discussion of how much data is enough to characterize a person’s regular PA behavior patterns. The generally adopted measurement frame seems to be that for most study populations habitual and regularly occurring behavior can be captured reliably when recording accelerometer data for at least 10 hours per day, for 3 to 4 days during a week with the inclusion of a weekend day(35). However, using this standard, it will often not be possible to capture behavior that might occur in specific locations infrequently e.g., PA in a park, nor will it be possible to describe variation across seasons. While combined technological approaches will continue to increase measurement accuracy and sensitivity of specific PA bouts, they are not necessarily valid and reliable representations of general behavior patterns if wear time is limited and individuals are not engaging in habitual and consistent patterns while wearing the devices. New devices such as wockets (web.mit.edu/wockets), however, have been designed to be worn for a year, and less frequent sampling by devices such as cell phones may be able to measure behaviors over longer durations in order to capture habitual behaviors. The ‘Quantified Self’ movement reflects this type of long term monitoring (quantifiedself.com).
Validity and reliability of context: Measures of environment
Environmental measures of interest for PA and SB research can include land use, transportation systems and safety, access to amenities, physical features, aesthetics, social support and social capital, safety and crime, the built food environment, and demographic characteristics among others. However, other than a handful of popular measures such as walkability, there is little consistency as to the types of environmental exposures researchers measure, as well as how different environment features are measured, resulting in inconsistent findings. There is a need to develop an environmental framework of exposure measures for gathering GIS data, which can guide research to ensure that exposures from a number of domains (e.g., green space, food) are drawn upon. Such a framework can also be used to consider how each environmental variable is theoretically associated with the outcome of interest. For example, parks might be represented by number, size, density, proximity, quality, or a combination of these measures, not to mention tracking how these variables change over time. As the behavioral measures become more precise, the associated GIS methods need to be appropriate.
Closely tied to the content of environmental context are different methods of measuring context, including data quality and reliability. Hurvitz et al. (16) propose moving towards rasterized representations of environment. They argue that data represented as fine-grained grids may serve to better capture exposure due to greater similarity in spatial and temporal resolutions as that obtained by GPS and accelerometers. Finer variability in GIS data is one approach; however as we move toward more accurate and sensitive measures of behavior, it may be worth considering matching those measures to similarly accurate and sensitive measures of environment through micro assessment of fine-scaled environmental features (e.g., the Microscale Audit of Pedestrian Streetscapes (MAPS), by Millstein et al.(26)). Such measures may also serve as reliability checks to GIS data, in particular temporal inaccuracies in GIS data due to out of date data sources.
Compliance and technological limitations
An area of needed research concerning GPS technology and generated data is assessment of accuracy and reliability in free living populations. Testing GPS devices in real world conditions has found the potential of significant spatial errors to be introduced depending on environmental conditions (8). A recent test of the dynamic accuracy of the popular Qstarz Q1000XT GPS unit under ‘real-world’ conditions showed that almost half (49.6%) of all GPS points recorded fell within 2.5 meters of the expected location, and 78.7% fell within 10 meters(31). Overall, these results indicate acceptable spatial accuracy, however, special care should be taken when the environment in which the study takes place could compromise the GPS signal (e.g., very dense urban locations or indoors).
A second issue is missing data due to complete signal loss or battery failure. There is currently no consistent method of dealing with missing GPS data in the literature, and little transparency as to decisions made in handling these missing data(22). In a data set of 718 free living individuals (unpublished work), at the daily level an average of 5.6% of an individual’s valid accelerometer daily data was missing due to GPS signal loss. However, the standard deviation of daily missing GPS data was 36.4%, indicating a large range in day to day GPS data loss. When matched to accelerometer data, we found an average of 59 minutes of weekly PA per individual with no location, hence no available contextual information from GIS. These issues will become more pressing as the field moves towards dynamic exposure methods, which necessitate full days of reliable GPS data when total exposure is being assessed.
In addition to reliability issues of GPS devices, there is a need to develop standard operational protocols for device use. This practice greatly benefitted the accelerometer data collection field over a decade ago. Sharing protocols not only helps researchers avoid data collection errors by learning from the previous experience of others, but establishes methods that support maximum compliance from participants and appropriate rules for assessing compliance, missingness, and valid wear time. Once such operational procedures are adopted and common metrics used to describe wear time and missingness study results can be more easily compared. For more information on practical issues related to GPS data collection, see Kerr et al. (18).
Data processing: Decisions and environments
In order for analysis of GPS and accelerometer data to happen, they must first be joined together using the time stamps from both technologies. Various research groups have developed tools (e.g., the GeoActivity Processor(6)) to help them accomplish this task ranging from simple to the more advanced. Also the latest version of the ActiLife software from accelerometer producer ActiGraph includes a GPS matching function. The Personal Activity and Location Measurement System (PALMS) is an advanced web-based system developed by the Centre for Wireless and Population Health Systems, University of California, San Diego. It was designed to be a service to GPS researchers with multiple research questions. PALMS can identify invalid GPS points using extreme speed or large changes in distance and elevation between two locations, and replaced invalid points by imputing data from the last known valid point, for up to a set number of minutes. Using algorithms that utilize the signal-to-noise-ratio (SNR), PALMS can categorize measurements as occurring indoors or outdoors. Furthermore, PALMS can identify and categorize trips into three modes: walking, biking, and in a vehicle, based on speed(5). PALMS is currently available as a free online system, providing researchers with rapid access to combined accelerometer and GPS data.
The next step in data processing is the integration of GPS and accelerometer data into a system that has environmental data. While GIS is most commonly used, simpler applications such as Google Earth can also be utilized if befitting the research question. For larger data sets and more complex research questions, access to sound computation frameworks as well as individuals with GIS experience may be paramount. Considering that GPS and accelerometer data collected at 4 points per minute, 1,440 minutes per day, with multiple days per user, datasets can quickly grow massive, requiring considerable computational power and time. Current popular GIS software such as Arc GIS is restricted in the types of analytical procedures that can be conducted on such large datasets, and creative solutions such as implementation of secure geo databases that make use of spatial querying languages becomes necessary. The field of Cyber GIS – the confluence of cyber infrastructure and GIS – is able to alleviate many of these challenges by developing computations structures that can efficiently process large spatial datasets (36). It is also important to note that GIS expertise is not necessarily the same as geographical theory expertise. Access to researchers with a background in geography may also lead to fruitful collaborative efforts and new analytical approaches.
CONCLUSIONS AND MOVING FORWARD
Combining accelerometer, GPS, and GIS data will allow for more sensitive and accurate measures of behavior in their context, both in time and in space. Having these measures will make it possible to more accurately determine which environments people are exposed to, for how long, and during which behavior. These combined measures will also aid in evaluation of interventions, as well as allow testing of specific hypotheses, such as the Activity Stat hypothesis, which posits that increased activity in one domain will be compensated for by decreased activity in another domain(14). However, it is important to stress that this type of improved measure, used cross-sectionally, does not increase the possibility to detect causal relations; they will show where and when behavior takes place, not why. As such, these types of measures cannot directly be used to predict behavior in a given environment. Intervention studies, however, with GPS assessing changes in PA locations after local environment improvements will provide better evidence of causality(20). However, they will allow a wealth of new research questions focused on better matching of behavior and environment, resulting in more specific assessments of PA as related to locations, times, and behaviors.
In moving forward with this research, we suggest three areas where significant focus is necessary, and where we envision the most potential for linking measures with public health policy. The first is development of better methodologies that can fully make use of this rich data. This will necessitate drawing on the fields of geography and computational science to assist in creating meaningful aggregations of space, time, and behaviors, as well as the computational structures to allow for big data analysis. The second is the development of better study designs that can begin to test causal relationships between environment and PA/SB using these measurement methods, such as longitudinal studies. The third is the creation of modeling environments to test theoretical linkages between environment and PA. For example, one approach is the development of probability surfaces that, based on the improved measures of observed behavior in its context, describe the probability that people will engage in a certain behavior, at a certain location.
In summary, GPS, accelerometer and GIS data afford many possibilities for objective data collection and aggregation, behavior classification, and exposure assessments. In this paper we have provided a framework for both beginning and more advanced researchers to plan and execute projects with specific research questions. However, it will be important to delve into some of the more theoretical aspects of this research focusing on answers to questions such as what are we measuring when we measure exposure, and how does time play a role in exposure assessments for PA and SB outcomes. Additionally there are computational challenges involved in this work, meaning specialized tools and expert researchers are required to deliver variables ready for analysis.
Summary.
Global Positioning Systems can be linked with other technologies to create dynamic representations of behaviors in context.
Acknowledgments
Funding: This research was supported by the National Institutes of Health National Cancer Institute research grant R21 CA169535 titled: “Development and Validation of Novel Prospective GPS/GIS Based Exposure Measures”.
Footnotes
No conflicts of interest.
References
- 1.Aldstadt J, Getis A. Using AMOEBA to Create a Spatial Weights Matrix and Identify Spatial Clusters [Internet] Geogr Anal. 2006;38(4):327–43. Available from: http://doi.wiley.com/10.1111/j.1538-4632.2006.00689.x. [Google Scholar]
- 2.Bauman AE, Reis RS, Sallis JF, Wells JC, Loos RJF, Martin BW. Correlates of physical activity: why are some people physically active and others not? [Internet] Lancet. 2012;380(9838):258–71. doi: 10.1016/S0140-6736(12)60735-1. [cited 2014 May 23] Available from: http://www.ncbi.nlm.nih.gov/pubmed/22818938. [DOI] [PubMed] [Google Scholar]
- 3.Brownson RC, Hoehner CM, Day K, Forsyth A, Sallis JF. Measuring the built environment for physical activity: state of the science. [Internet] Am J Prev Med. 2009;36(4 Suppl):S99–123. e12. doi: 10.1016/j.amepre.2009.01.005. [cited 2014 Jun 3] Available from: http://www.pubmedcentral.nih.gov/articlerender.fcgi?artid=2844244&tool=pmcentrez&rendertype=abstract. [DOI] [PMC free article] [PubMed] [Google Scholar]
- 4.Burton L, Kemp S, Leung M, Matthews S, Takeuchi DT. Communities, Neighborhoods, and Health: Expanding the Boundaries of Place. 1. New York, NY: Springer; 2011. [Google Scholar]
- 5.Carlson JA, Jankowska MM, Meseck K, et al. Validity of PALMS GPS scoring of active and passive travel compared to Sense Cam. Med Sci Sports Exerc. 2014 doi: 10.1249/MSS.0000000000000446. [DOI] [PMC free article] [PubMed] [Google Scholar]
- 6.Coombes E, van Sluijs E, Jones A. Is environmental setting associated with the intensity and duration of children’s physical activity? Findings from the SPEEDY GPS study. [Internet] Health Place. 2013;20:62–5. doi: 10.1016/j.healthplace.2012.11.008. [cited 2014 Aug 7] Available from: http://www.pubmedcentral.nih.gov/articlerender.fcgi?artid=3591252&tool=pmcentrez&rendertype=abstract. [DOI] [PMC free article] [PubMed] [Google Scholar]
- 7.Cummins S, Curtis S, Diez-Roux AV, Macintyre S. Understanding and representing “place” in health research: a relational approach. [Internet] Soc Sci Med. 2007;65(9):1825–38. doi: 10.1016/j.socscimed.2007.05.036. [cited 2014 Jul 16] Available from: http://www.ncbi.nlm.nih.gov/pubmed/17706331. [DOI] [PubMed] [Google Scholar]
- 8.Duncan S, Stewart TI, Oliver M, et al. Portable global positioning system receivers: static validity and environmental conditions. [Internet] Am J Prev Med. 2013;44(2):e19–29. doi: 10.1016/j.amepre.2012.10.013. [cited 2014 Jun 12] Available from: http://www.ncbi.nlm.nih.gov/pubmed/23332343. [DOI] [PubMed] [Google Scholar]
- 9.Ellis K, Godbole S, Marshall S, Lanckriet G, Staudenmayer J, Kerr J. Identifying Active Travel Behaviors in Challenging Environments Using GPS, Accelerometers, and Machine Learning Algorithms. [Internet] Front public Heal. 2014;2(April):36. doi: 10.3389/fpubh.2014.00036. [cited 2014 Jul 29] Available from: http://www.pubmedcentral.nih.gov/articlerender.fcgi?artid=4001067&tool=pmcentrez&rendertype=abstract. [DOI] [PMC free article] [PubMed] [Google Scholar]
- 10.Forsyth A, Van Riper D, Larson N, Wall M, Neumark-Sztainer D. Creating a replicable, valid cross-platform buffering technique: the sausage network buffer for measuring food and physical activity built environments. [Internet] Int J Health Geogr. 2012;11:14. doi: 10.1186/1476-072X-11-14. Available from: http://www.pubmedcentral.nih.gov/articlerender.fcgi?artid=3391988&tool=pmcentrez&rendertype=abstract. [DOI] [PMC free article] [PubMed] [Google Scholar]
- 11.Frank LD, Sallis JF, Saelens BE, et al. The development of a walkability index: application to the Neighborhood Quality of Life Study. [Internet] Br J Sports Med. 2010;44(13):924–33. doi: 10.1136/bjsm.2009.058701. [cited 2014 May 29] Available from: http://www.ncbi.nlm.nih.gov/pubmed/19406732. [DOI] [PubMed] [Google Scholar]
- 12.Gatrell AC, Bailey TC, Diggle PJ, Rowlingson BS, Bailey C. analysis and its Spatial point pattern application in geographical epidemiology. 2014;21(1):256–74. [Google Scholar]
- 13.Giles-Corti B, Timperio A, Cutt H, et al. Development of a reliable measure of walking within and outside the local neighborhood: RESIDE’s Neighborhood Physical Activity Questionnaire. [Internet] Prev Med (Baltim) 2006;42(6):455–9. doi: 10.1016/j.ypmed.2006.01.019. [cited 2014 Jul 29] Available from: http://www.ncbi.nlm.nih.gov/pubmed/16574208. [DOI] [PubMed] [Google Scholar]
- 14.Gomersall SR, Rowlands AV, English C, Maher C, Olds TS. The Activity Stat hypothesis: the concept, the evidence and the methodologies. [Internet] Sports Med. 2013;43(2):135–49. doi: 10.1007/s40279-012-0008-7. [cited 2014 Jul 21] Available from: http://www.ncbi.nlm.nih.gov/pubmed/23329607. [DOI] [PubMed] [Google Scholar]
- 15.Gong H, Chen C, Bialostozky E, Lawson CT. A GPS/GIS method for travel mode detection in New York City [Internet] Comput Environ Urban Syst. 2012;36(2):131–9. [cited 2014 Jul 11] Available from: http://linkinghub.elsevier.com/retrieve/pii/S0198971511000536. [Google Scholar]
- 16.Hurvitz PM, Moudon AV, Kang B, Saelens BE, Duncan GE. Emerging technologies for assessing physical activity behaviors in space and time. [Internet] Front public Heal. 2014;2(January):2. doi: 10.3389/fpubh.2014.00002. [cited 2014 Jun 12] Available from: http://www.pubmedcentral.nih.gov/articlerender.fcgi?artid=3904281&tool=pmcentrez&rendertype=abstract. [DOI] [PMC free article] [PubMed] [Google Scholar]
- 17.Inagami S, Cohen Da, Finch BK. Non-residential neighborhood exposures suppress neighborhood effects on self-rated health. [Internet] Soc Sci Med. 2007;65(8):1779–91. doi: 10.1016/j.socscimed.2007.05.051. [cited 2014 Jul 29] Available from: http://www.ncbi.nlm.nih.gov/pubmed/17614175. [DOI] [PubMed] [Google Scholar]
- 18.Kerr J, Duncan S, Schipperijn J, Schipperjin J. Using global positioning systems in health research: a practical approach to data collection and processing. [Internet] Am J Prev Med. 2011;41(5):532–40. doi: 10.1016/j.amepre.2011.07.017. [cited 2014 May 26] Available from: http://www.ncbi.nlm.nih.gov/pubmed/22011426. [DOI] [PubMed] [Google Scholar]
- 19.Kerr J, Marshall SJ, Godbole S, et al. Using the SenseCam to improve classifications of sedentary behavior in free-living settings. [Internet] Am J Prev Med. 2013;44(3):290–6. doi: 10.1016/j.amepre.2012.11.004. [cited 2014 Jul 20] Available from: http://www.ncbi.nlm.nih.gov/pubmed/23415127. [DOI] [PubMed] [Google Scholar]
- 20.Kerr J, Rosenberg D, Nathan A, et al. Applying the Ecological Model of Behavior Change to a Physical Activity Trial in Retirement Communities: Description of the study protocol. Contemp Clin Trials. 2012;33(6):1180–8. doi: 10.1016/j.cct.2012.08.005. [DOI] [PMC free article] [PubMed] [Google Scholar]
- 21.Kerr J, Sallis JF, Saelens BE, et al. Outdoor physical activity and self rated health in older adults living in two regions of the U.S. [Internet] Int J Behav Nutr Phys Act. 2012;9(1):89. doi: 10.1186/1479-5868-9-89. [cited 2014 Aug 20] Available from: http://www.pubmedcentral.nih.gov/articlerender.fcgi?artid=3464785&tool=pmcentrez&rendertype=abstract. [DOI] [PMC free article] [PubMed] [Google Scholar]
- 22.Krenn PJ, Titze S, Oja P, Jones A, Ogilvie D. Use of global positioning systems to study physical activity and the environment: a systematic review. [Internet] Am J Prev Med. 2011;41(5):508–15. doi: 10.1016/j.amepre.2011.06.046. [cited 2014 Jun 12] Available from: http://www.pubmedcentral.nih.gov/articlerender.fcgi?artid=3821057&tool=pmcentrez&rendertype=abstract. [DOI] [PMC free article] [PubMed] [Google Scholar]
- 23.Kwan M. The Uncertain Geographic Context Problem. 2012;102(January 2011):958–68. [Google Scholar]
- 24.Kwan M-P. From place-based to people-based exposure measures. [Internet] Soc Sci Med. 2009;69(9):1311–3. doi: 10.1016/j.socscimed.2009.07.013. [cited 2014 Jul 29] Available from: http://www.ncbi.nlm.nih.gov/pubmed/19665828. [DOI] [PubMed] [Google Scholar]
- 25.McCormack GR, Shiell A. In search of causality: A systematic review of the relationship between the built environment and physical activity among adults [Internet] Int J Behav Nutr Phys Act. 2011;8:125. doi: 10.1186/1479-5868-8-125. [cited 2014 Jun 5] Available from: http://www.ijbnpa.org/content/8/1/125\nhttp://ovidsp.ovid.com/ovidweb.cgi?T=JS&PAGE=reference&D=emed10&NEWS=N&AN=2012163032. [DOI] [PMC free article] [PubMed] [Google Scholar]
- 26.Millstein Ra, Cain KL, Sallis JF, et al. Development, scoring, and reliability of the Microscale Audit of Pedestrian Streetscapes (MAPS). [Internet] BMC Public Health. 2013;13:403. doi: 10.1186/1471-2458-13-403. Available from: http://www.pubmedcentral.nih.gov/articlerender.fcgi?artid=3728214&tool=pmcentrez&rendertype=abstract. [DOI] [PMC free article] [PubMed] [Google Scholar]
- 27.Perchoux C, Chaix B, Cummins S, Kestens Y. Conceptualization and measurement of environmental exposure in epidemiology: accounting for activity space related to daily mobility. [Internet] Health Place. 2013;21:86–93. doi: 10.1016/j.healthplace.2013.01.005. [cited 2014 Jun 12] Available from: http://www.ncbi.nlm.nih.gov/pubmed/23454664. [DOI] [PubMed] [Google Scholar]
- 28.Rainham D, McDowell I, Krewski D, Sawada M. Conceptualizing the healthscape: contributions of time geography, location technologies and spatial ecology to place and health research. [Internet] Soc Sci Med. 2010;70(5):668–76. doi: 10.1016/j.socscimed.2009.10.035. [cited 2014 Jun 3] Available from: http://www.ncbi.nlm.nih.gov/pubmed/19963310. [DOI] [PubMed] [Google Scholar]
- 29.Riva M, Gauvin L, Barnett Ta. Toward the next generation of research into small area effects on health: a synthesis of multilevel investigations published since July 1998. [Internet] J Epidemiol Community Health. 2007;61(10):853–61. doi: 10.1136/jech.2006.050740. [cited 2014 Jul 29] Available from: http://www.pubmedcentral.nih.gov/articlerender.fcgi?artid=2652961&tool=pmcentrez&rendertype=abstract. [DOI] [PMC free article] [PubMed] [Google Scholar]
- 30.Rzewnicki R, Vanden Auweele Y, De Bourdeaudhuij I. Addressing overreporting on the International Physical Activity Questionnaire (IPAQ) telephone survey with a population sample. [Internet] Public Health Nutr. 2003;6(3):299–305. doi: 10.1079/PHN2002427. [cited 2014 Jul 24] Available from: http://www.ncbi.nlm.nih.gov/pubmed/12740079. [DOI] [PubMed] [Google Scholar]
- 31.Schipperijn J, Kerr J, Duncan S, Madsen T, Klinker CD, Troelsen J. Dynamic Accuracy of GPS Receivers for Use in Health Research: A Novel Method to Assess GPS Accuracy in Real-World Settings. [Internet] Front public Heal. 2014;2(March):21. doi: 10.3389/fpubh.2014.00021. [cited 2014 Jul 29] Available from: http://www.pubmedcentral.nih.gov/articlerender.fcgi?artid=3948045&tool=pmcentrez&rendertype=abstract. [DOI] [PMC free article] [PubMed] [Google Scholar]
- 32.Spielman SE, Yoo E-H. The spatial dimensions of neighborhood effects. [Internet] Soc Sci Med. 2009;68(6):1098–105. doi: 10.1016/j.socscimed.2008.12.048. [cited 2014 Jun 12] Available from: http://www.ncbi.nlm.nih.gov/pubmed/19167802. [DOI] [PubMed] [Google Scholar]
- 33.Staudenmayer J, Pober D, Crouter S, Bassett D, Freedson P. An artificial neural network to estimate physical activity energy expenditure and identify physical activity type from an accelerometer. [Internet] J Appl Physiol. 2009;107(4):1300–7. doi: 10.1152/japplphysiol.00465.2009. [cited 2014 Jul 29] Available from: http://www.pubmedcentral.nih.gov/articlerender.fcgi?artid=2763835&tool=pmcentrez&rendertype=abstract. [DOI] [PMC free article] [PubMed] [Google Scholar]
- 34.Thierry B, Chaix B, Kestens Y. Detecting activity locations from raw GPS data: a novel kernel-based algorithm. [Internet] Int J Health Geogr. 2013;12:14. doi: 10.1186/1476-072X-12-14. Available from: http://www.pubmedcentral.nih.gov/articlerender.fcgi?artid=3637118&tool=pmcentrez&rendertype=abstract. [DOI] [PMC free article] [PubMed] [Google Scholar]
- 35.Trost SG, Pate RR, Freedson P, Sallis JF, Taylor WC. Using objective physical activity measures with youth: How many days of monitoring are needed? Med Sci Sports Exerc. 2000;32(2):426. doi: 10.1097/00005768-200002000-00025. [DOI] [PubMed] [Google Scholar]
- 36.Wang S. A Cyber GIS Framework for the Synthesis of Cyber infrastructure, GIS, and Spatial Analysis [Internet] Ann Assoc Am Geogr. 2010;100(3):535–57. [cited 2014 Jul 9] Available from: http://www.tandfonline.com/doi/abs/10.1080/00045601003791243. [Google Scholar]
- 37.Zheng Y, Zhang L, Xie X, Ma W-Y. Mining interesting locations and travel sequences from GPS trajectories [Internet]. Proc. 18th Int. Conf. World wide web - WWW ‘09; 2009. p. 791. Available from: http://portal.acm.org/citation.cfm?doid=1526709.1526816. [Google Scholar]