Abstract
Objective:
Accurate ear-canal acoustic measurements, such as wideband acoustic admittance, absorbance, and otoacoustic emissions, require that the measurement probe be tightly sealed in the ear canal. Air leaks can compromise the validity of the measurements, interfere with calibrations, and increase variability. There are no established procedures for determining the presence of air leaks or criteria for what size leak would affect the accuracy of ear-canal acoustic measurements. The purpose of this study was to determine ways to quantify the effects of air leaks and to develop objective criteria to detect their presence.
Design:
Air leaks were simulated by modifying the foam tips that are used with the measurement probe through insertion of thin plastic tubing. To analyze the effect of air leaks, acoustic measurements were taken with both modified and unmodified foam tips in brass-tube cavities and human ear canals. Measurements were initially made in cavities to determine the range of critical leaks. Subsequently, data were collected in ears of 21 adults with normal hearing and normal middle-ear function. Four acoustic metrics were used for predicting the presence of air leaks and for quantifying these leaks: (1) low-frequency admittance phase (averaged over 0.1–0.2 kHz), (2) low-frequency absorbance, (3) the ratio of compliance volume to physical volume (CV/PV), and (4) the air-leak resonance frequency. The outcome variable in this analysis was the absorbance change (Δabsorbance), which was calculated in eight frequency bands.
Results:
The trends were similar for both the brass cavities and the ear canals. ΔAbsorbance generally increased with air-leak size and was largest for the lower frequency bands (0.1–0.2 and 0.2–0.5 kHz). Air-leak effects were observed in frequencies up to 10 kHz, but their effects above 1 kHz were unpredictable. These high-frequency air leaks were larger in brass cavities than in ear canals. Each of the four predictor variables exhibited consistent dependence on air-leak size. Low-frequency admittance phase and CV/PV decreased, while low-frequency absorbance and the air-leak resonance frequency increased.
Conclusion:
The effect of air leaks can be significant when their equivalent diameter exceeds 0.01 in. The observed effects were greatest at low frequencies where air leaks caused absorbance to increase. Recommended criteria for detecting air leaks include the following: when the frequency range of interest extends as low as 0.1 kHz, low-frequency absorbance should be ≤0.20 and low-frequency admittance phase ≥61 degrees. For frequency ranges as low as 0.2 kHz, low-frequency absorbance should be ≤0.29 and low-frequency admittance phase ≥44 degrees.
Keywords: Absorbance, Air-leaks, Ear-canal measurements, Probe-microphone, Wideband acoustic immittance
The purpose of this study was to determine how to quantify the effects of air leaks during ear-canal probe microphone measurements and to develop objective criteria to detect their presence. To analyze the effect of air leaks, acoustic measurements were taken in brass-tube cavities and in human ear canals with foam tips without leaks and with foam tips modified to produce air leaks of different sizes. Results suggest that the effect of air leaks can be significant when their equivalent diameter exceeds 0.01 inches.
INTRODUCTION
Acoustic measurements with microphones in the ear canal are in widespread use in both clinical and research applications. Examples of these measurements include otoacoustic emissions (OAEs), which are used to assess cochlear status due to their dependence on the integrity of outer hair cells (e.g., Kemp et al. 1990), and wideband acoustic immittance (WAI), which examines the status of the middle ear via the ear’s acoustic response to stimulation (e.g., Keefe et al. 1993; Voss & Allen 1994). The accuracy of ear-canal acoustic measurements depends on several factors including the amount of noise in the environment, the absence of debris (e.g., cerumen) in the probe or ear canal, proper insertion of the probe in the ear canal, equipment calibration, biologic noise (from breathing and movement) produced by the test subject, and the ability to create a hermetic seal (Keefe et al. 2000). While concerns exist regarding the presence of air-leak artifacts in middle-ear measurements, there are no established procedures for determining their presence or the leak size that would interfere with the accuracy of ear-canal acoustic measurements.
The purpose of this study was to determine the size of air leak that can impact ear-canal probe-microphone measurements and to develop objective criteria to detect the presence of such air leaks. The need to establish a method for quantifying the impact of air leaks on impedance measurements has been suggested by others (e.g. Keefe et al. 2000; Rosowski et al. 2012; Voss et al. 2012; Feeney et al. 2013). One consistent observation is that the presence of air leaks during acoustic measurements can compromise the validity of the measurements, interfere with calibrations, and increase variability (Voss et al. 2013). Unlike conventional tympanometry, WAI measures do not require pressurization of the ear canal, and so may be obtained on measurement systems that lack a direct method for assessing the extent of the acoustic seal. Foam or rubber tips placed around the probe are commonly used for ambient-pressure measures in the ear canal, but the seal may be imperfect, resulting in pathways for acoustic energy to escape (Vander Werff et al. 2007). These air leaks can result from a number of factors such as (1) imperfections in the foam tip which cause the plastic tubing to be improperly attached, allowing sound to radiate (or leak) from around the plastic tube in the center of the tip, (2) incomplete expansion of the foam after insertion, leaving a space between the ear-canal wall and the surface of the foam tip, (3) poor fit of the tip in the ear canal because of a mismatch in size between the entrance of the canal and the foam tip, and (4) movement of the subject causing the probe to shift (Vander Werff et al. 2007; Rosowski et al. 2012).
The potential for air-leak artifacts is also a concern for other ear-canal pressure measurements that require placement of probe-microphone systems in the ear canal. These measures include forward-pressure level (FPL), time-domain ear-canal reflectance, and cochlear reflectance (Neely et al. 2013). Although not yet in widespread use, FPL is the preferred measure when calibrating stimulus level for distortion product OAEs because it is less sensitive to the effects of standing waves in the ear canal (e.g., Neely & Gorga, 1998; Scheperle et al. 2008; Burke et al. 2010; Reuven et al. 2013). FPL should also have advantages for high-frequency audiometry (e.g., Souza et al. 2010). Time-domain ear-canal reflectance can be used for estimating the area function of the ear canal from measurements of acoustic impedance at the ear-canal entrance (Rasetshwane & Neely 2011). Cochlear reflectance is a noninvasive test of cochlear function that measures the inner ear’s contribution to ear-canal reflectance and has many properties in common with conventional OAEs (Rasetshwane & Neely 2012).
The possibility of detecting and quantifying the effect of air leaks on attenuation of earplugs was suggested by Henriksen (2008), who measured impedance in an artificial ear with a foam earplug intentionally modified to produce a leak. The air leak produced an impedance phase that was more positive than −90° and approached 0° at low frequencies. When there is a seal, the phase is constant near −90° at low frequencies. Rosowski et al. (2012) found that air leaks could be identified in reflectance measurements by excessive noise in power reflectance at low frequencies, an atypical ear-canal impedance phase, and an increase in power reflectance at low frequencies with repeated measurements as the seal in the ear canal improved with foam tip expansion over time. Keefe et al. (2000) observed that reflectance measurements with a good seal in adults with normal middle-ear function should have high power reflectance at frequencies below 500 Hz.
A method for the detection of air leaks may provide the necessary information to establish criteria that could alert clinicians and/or experimenters to the presence of air leaks, indicating that the probe should be reseated to achieve an air-tight seal to optimize the chances for an accurate measurement. Potentially, such a standard would help increase the accuracy of newborn hearing screening programs that rely upon these objective measures at ambient pressure (Keefe et al. 2000) and may improve the accuracy of identifying causes of conductive hearing loss.
PARTICIPANTS AND METHODS
Participants
Twenty-one normal-hearing adult participants with ages ranging from 19 to 30 years (mean age of 22.8 years) were recruited for this study. Inclusion criteria comprised (1) air-conduction behavioral thresholds ≤10 dB HL for octave frequencies from 250 to 8000 Hz, (2) 226-Hz tympanometry with peak-compensated static acoustic admittance between 0.3 and 1.8 mmhos and tympanometric peak pressure between −50 and 25 daPa, (3) no abnormalities during otoscopic inspection, and (4) no middle-ear surgery or disease within the last 2 years. All participants were recruited from the Boys Town National Research Hospital’s (BTNRH) Human Research Subjects Core database. Before participation, informed consent was obtained. Participants were compensated for hourly participation. This study was approved by the institutional review boards of BTNRH and Gallaudet University.
Equipment Specifications
The equipment used in this study was described in detail by Rasetshwane and Neely (2011) and is described only briefly here. The system used two identical sound sources connected separately to an ER-10B+ probe microphone (Etymōtic Research, Elk Grove Village, IL). The two sound sources allowed for a pair of measurements to be taken with each probe placement. The measurements with the two sources were averaged to improve the signal-to-noise ratio. The two sound sources were commercially available tweeters (TW010F1, Audax, France) housed in lightweight steel enclosures. Teflon tubing connected plastic cones that were mounted on the tweeters to the sound ports of the microphone. A power amplifier was used to prevent overloading the outputs of a Layla 3G sound card (Echo, Santa Barbara, CA). Both the sound sources and the power amplifier were designed at Northwestern University by Jon H. Siegel. The sound sources and microphone were attached to a swivel-mounted microphone arm, which permitted the probe to be placed in close proximity to the calibration cavities and the ears of the participants. The stimulus was a digitally generated wideband linear-swept frequency chirp with a sampling rate of 48 kHz. Software developed at BTNRH (EMAV; Neely & Liu 1994) was used to (1) perform the calculations of Thévenin equivalents, (2) deliver the stimulus, and (3) record the microphone response.
Calibration and Admittance Measurements
Before data collection, the equipment was calibrated to determine the Thévenin-equivalent impedance of the sound sources (e.g. Allen 1986; Keefe et al. 1992), which was needed to calculate the acoustic impedance of the cavities from pressure measurements. The cavities used for calibration were constructed of brass tubing of 8 mm inside diameter (i.d.) with five tubes of varying length (e.g. Scheperle et al. 2008). The tubes were of lengths 73.3, 50.8, 38.7, 31.2, and 24.3 mm and produced half-wave resonant peaks at approximately 2.36, 3.41, 4.47, 5.55, and 7.11 kHz. The Thévenin-equivalent source parameters were calculated for each sound source separately using a wideband linear-swept frequency chirp stimulus. Calibration was performed daily.
Following the determination of the source parameters, the admittance of the load (human ear canals or brass cavity) was determined using the “pressure divider” equation (Voss & Allen 1994). Absorbance was then calculated using the load admittance and the surge admittance (e.g. Rasetshwane & Neely 2011).
Acoustic Measures for Quantifying Air Leaks
The presence of an air leak may be inferred from its effect on the magnitude and phase of the ear-canal admittance, as illustrated in Fig. 1. Specifically, Fig. 1 shows admittance magnitude (top panel) and phase (bottom panel) from the ear canal of one participant with a well-sealed foam tip (solid line) and when a modified foam tip with a 0.04 in. air leak was used (dashed line). The admittance magnitude has a null at the air-leak-resonance frequency (falr), which was 300 Hz in this example, when an air leak is present. The admittance phase, which is expected to be approximately 90 degrees at low frequencies (e.g. Henriksen 2008) in the absence of a leak, can become much less than 90 degrees and even less than zero at falr when an air leak is present.
Fig. 1.
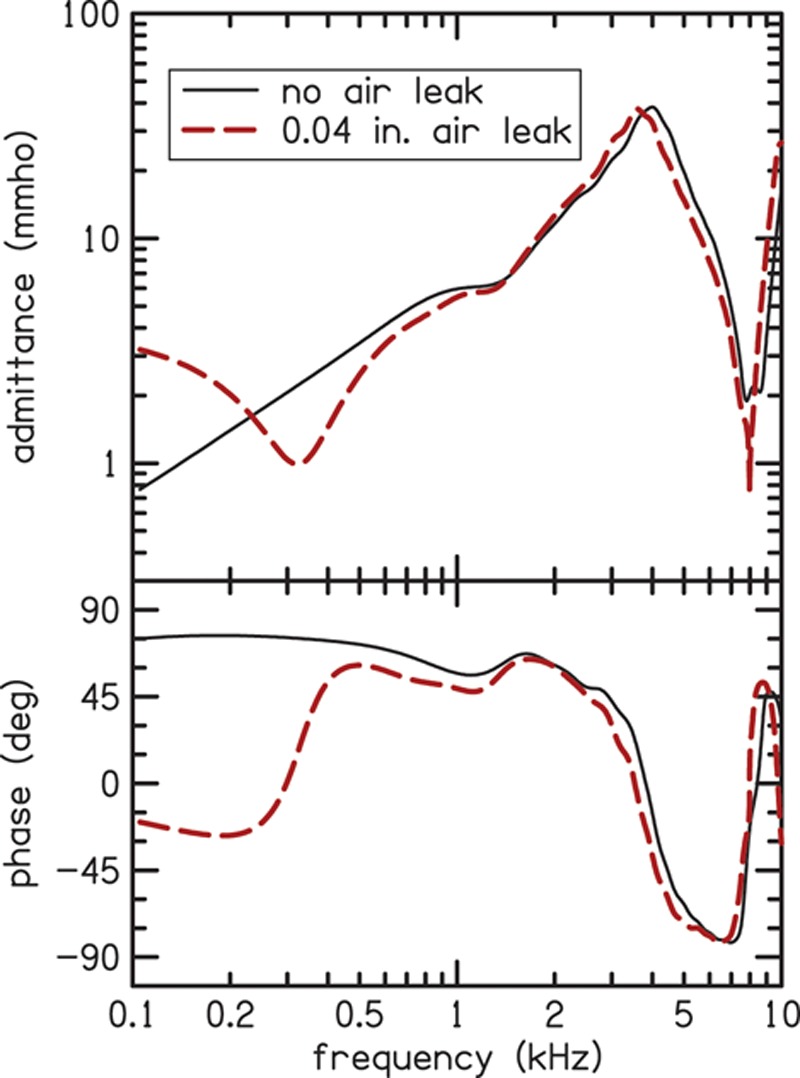
Measured admittance magnitude (top panel) and phase (bottom panel) for the foam tip with no-leak (solid line) and for the modified foam tip with a 0.04-in. leak (dashed line) in the ear canal of one participant. The modified tip with the air leak has smaller admittance magnitude in the low frequencies where the leak susceptance cancels the ear-canal susceptance. The bottom panel shows how the phase goes to zero at the air-leak resonance frequency and is reduced at all frequencies below 1 kHz. A color version is available online.
Acoustic absorbance is a measure of how much of the sound power is absorbed by the middle-ear system, as opposed to how much is reflected. Figure 2 illustrates how absorbance is impacted by air leaks in the same ear canal that provided the data shown in Fig. 1. Just as in Fig. 1, the solid line in Fig. 2 represents the absorbance as a function of frequency for a measurement made with no leak and the dashed line represents a condition when a modified foam tip with a 0.04 in. air leak was used. The measured absorbance increases at low frequencies.
Fig. 2.
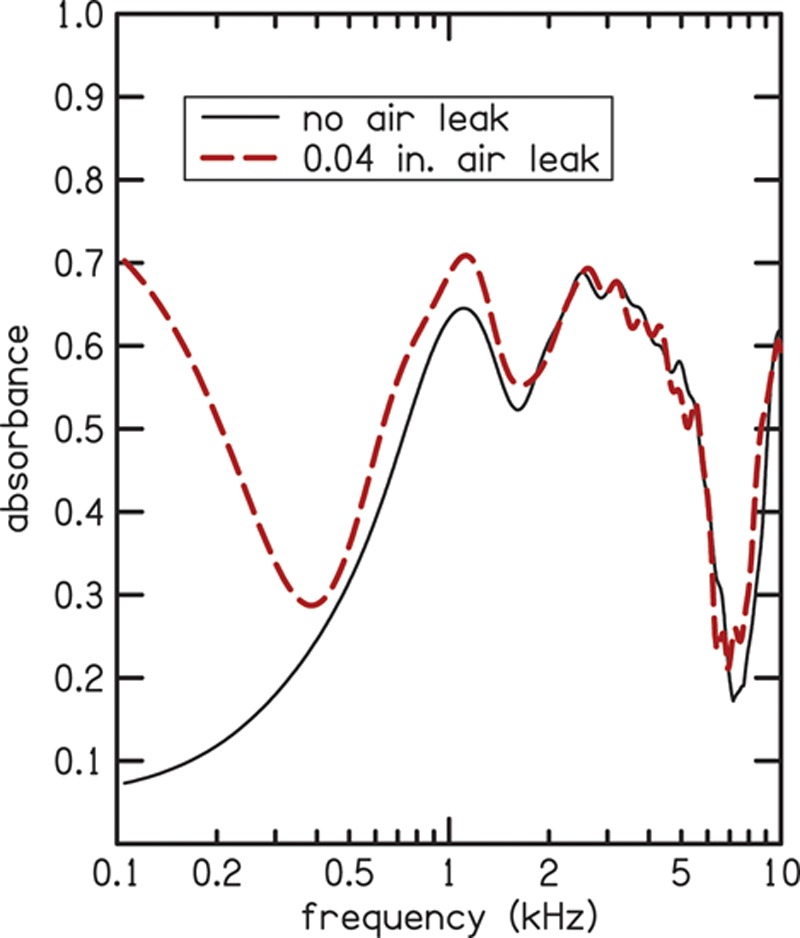
Absorbance for the foam tip with no-leak (solid line) and for the modified foam tip with the 0.04-in. leak (dashed line) in the same ear canal for which admittance and phase data were shown in Fig. 1. Low-frequency absorbance increases in the leak condition compared to the no-leak condition. A color version is available online.
Based on preliminary measurements, four acoustic measures were selected as potential predictors of air leaks: (1) the admittance phase at low frequencies (φlow), (2) the absorbance at low frequencies (Alow), (3) the ratio of compliance volume to physical volume (CV/PV), and (4) resonant frequency of the air leak (falr). The first two measures, φlow and Alow, were calculated by averaging the respective quantities over a frequency range of 0.1–0.2 kHz. The CV was calculated from the imaginary part of the admittance averaged over a frequency range of 0.05–0.4 kHz. CV is related to compliance C via the equation CV = ρc2C, where ρ is the density of air and c is the speed of sound in air (Keefe et al. 1993; Stepp & Voss 2005). Physical volume for acoustic admittance was calculated according to the method described by Rasetshwane and Neely (2011), which takes acoustic measurements at the entrance of the ear canal and calculates reflectance in the time domain to determine the cross-sectional area of the ear canal as a function of axial distance from the eardrum. In the calculation of the time-domain reflectance, the measured reflectance (original bandwidth of 24 kHz) was low-pass filtered using a frequency-domain Blackman window with a bandwidth of 18 kHz, resulting in a frequency band of 0–18 kHz for the wideband PV. Separate values of CV and PV were calculated for the various leak conditions. For measurements in the brass cavity using foam tips without leaks, the error between PV obtained using the procedure of Rasetshwane and Neely (2011) and the actual volume of the cavity as determined from its dimensions (length = 38.7 mm, inside diameter = 8 mm, volume = 1.95 cc) was less than 8%, across repeated measurements with different probe placements.
The falr is the frequency where the imaginary part of the ear-canal admittance is estimated to become zero. Our interpretation is that the imaginary part, called susceptance, becomes zero because the negative contribution, due to the presence of the leak, cancels the positive contribution, due to compressibility of the volume of air in the ear canal. An electrical analog of the effect of the leak would be an inductor (representing the leak) in parallel with a capacitor (representing the compliance of the air volume). The falr is, presumably, the frequency at which the susceptances of the capacitor and inductor are equal in magnitude and cancel each other (because they are always opposite in sign). However, the calculation of falr was based on a linear-regression method that does not require the validity of any specific physical interpretation.
In this study, the dependence of the previously described air-leak predictor variables on the size of the air leak was determined. Values of these predictor variables that are associated with significant deviations in absorbance (compared to the case with no leak) were also determined. The outcome variable in this analysis was the absorbance change (Δabsorbance), defined as absorbance with a leak minus absorbance without a leak. Mean Δabsorbance was calculated over eight frequency ranges: (1) 0.1–0.2, (2) 0.2–0.5, (3) 0.5–1, (4) 1–2, (5) 2–5, (6) 5–10, (7) 0.2–5, and (8) 0.1–10 kHz. A significant deviation in absorbance was defined as a deviation that exceeded two standard deviations (across repeated measures and across participants for the ear-canal measurements) for the no air-leak condition.
Ear-canal impedance measurements (from which admittance and absorbance are derived) may include noise due to measurement-equipment distortion and biologic noise (created by subject movement and breathing), as mentioned earlier. To reduce the noise and smooth the resulting admittance and absorbance estimates, a filtering approach that uses a window in the time domain was applied. In this approach, impedance measurements were transformed from the frequency domain to the time domain. A window was applied to the time-domain impedance to retain only the time interval between −0.5 and 2 ms. A forward Fourier transform of the windowed time-domain impedance produced the smoothed version of the impedance that was used in all subsequent computations. The advantage of time-domain smoothing is that it maintains temporal properties such as causality.
Cavity and Ear-Canal Measures
To simulate air leaks of different sizes, ER10-14 foam tips (Etymotic Research, Elk Grove Village, IL) were modified by inserting rigid-walled plastic tubing (AmazonSupply.com) into the foam. Seven inner diameters were selected for this study: 0.01, 0.013, 0.02, 0.025, 0.04, 0.051, or 0.063 in. The plastic material was either polyetheretherketone or polyimide, depending on availability at the indicated diameter. A 1/8 in. hole was drilled in the foam tip before insertion of the plastic tubing, which was always 13 mm in length. When inserted, the tubing extended beyond the interior and exterior surfaces of the foam by about 1 mm and 2 mm, respectively. After insertion, the tubing was secured in place with cyanoacrylate adhesive (i.e., super glue).
Measurements in a brass tube were made using foam tips without an air leak and foam tips that had been modified to create a calibrated air leak by insertion of the plastic tubing described above. The brass tube was one of the five tubes used for calibration with 38.7 mm length and 8 mm i.d. (volume of 1.95 cc). The measurements were made in the following order of leak sizes: (1) no leak, (2) 0.010 in., (3) 0.013 in., (4) 0.02 in., (5) 0.025 in., (6) 0.04 in., (7) 0.051 in., (8) 0.063 in., and (9) no leak.
The foam tips were compressed to allow insertion into the ear canals and brass cavities. To ensure that the foam tip had fully expanded, measurements were taken two min after insertion for both the brass-cavity and ear-canal measurements. Although we had no method to confirm that there was a complete seal between the foam tip and the ear canal (or brass tube), allowing time for the probe tip to fully expand reduced the likelihood of uncontrolled leaks. Each foam tip (with and without tubing inserted) and probe assembly was placed in the brass cavity a single time and two measurements were taken. This sequence was repeated five times, resulting in a total of ten measurements for each condition. These results were analyzed to determine the extent to which measurements with the tips having leaks differed from those with no leak.
Based on the analysis of the measurements made in brass tubes, leak diameters of 0.01, 0.013, 0.02, 0.025, and 0.04 in. were selected for measurements in human ear canals. These leak diameters were chosen because measurements with them differed from those obtained in the no-leak condition and they were within the range of leaks to be expected in human ear canals. The order of the conditions was randomized and two measurements were taken with each probe placement.
In addition to the five leak conditions, two no-leak measurements were made in each ear. The average absorbance for the two no-leak measurements established a baseline for comparison with the leak conditions. The difference between the two no-leak absorbances in each ear was typically small, but was unusually large (>0.1) in two ears, which was probably the result of poor fit or probe movement. Because large differences were unexpected, measurements from these two ears were excluded from further analysis. Measurements from the other 19 participants were analyzed further. The standard deviation (SD), across subjects and repeated measures, of the difference in absorbance between the two no-leak measurements was calculated and used to gauge the significance of the absorbance deviations between the leak and no-leak conditions within each ear. Separate estimates of SD were obtained for each frequency band.
RESULTS
Results for measurements in a brass cavity are presented first, followed by results for measurements made in human ear canals.
Measurements in the Brass Cavity
Figures 3 and 4 summarize the results of the measurements obtained in the brass cavity with 38.7 mm length and 8 mm i.d. (volume of 1.95 cc). Figure 3 summarizes the mean results for the 10 measurements for the effects of air-leak size on Δabsorbance for six frequency bands (two wideband conditions, 0.2–5 and 0.1–10 kHz, were not plotted to reduce clutter). Seven leak sizes were tested in addition to two no-leak measurements. The difference between absorbance for the two no-leak measurements is plotted as Δabsorbance for leak size equal to zero. For diameters >0.01 in., the effect of the leak was greatest in the lowest frequency band (0.1–0.2 kHz). In all frequency bands, Δabsorbance usually increased with the size of the leaks. The smallest increase in Δabsorbance was observed in the 1–5 kHz frequency range. The highest frequency band (5–10 kHz) had the largest Δabsorbance when the diameter was 0.01 in., but did not have the largest Δabsorbance when the diameter was >0.01 in. In general, the effect of air leaks on absorbance was greatest at low frequencies; however, the effect was greater in the 5–10 kHz frequency band than in the two frequency bands below 5 kHz (1–2 and 2–5 kHz).
Fig. 3.
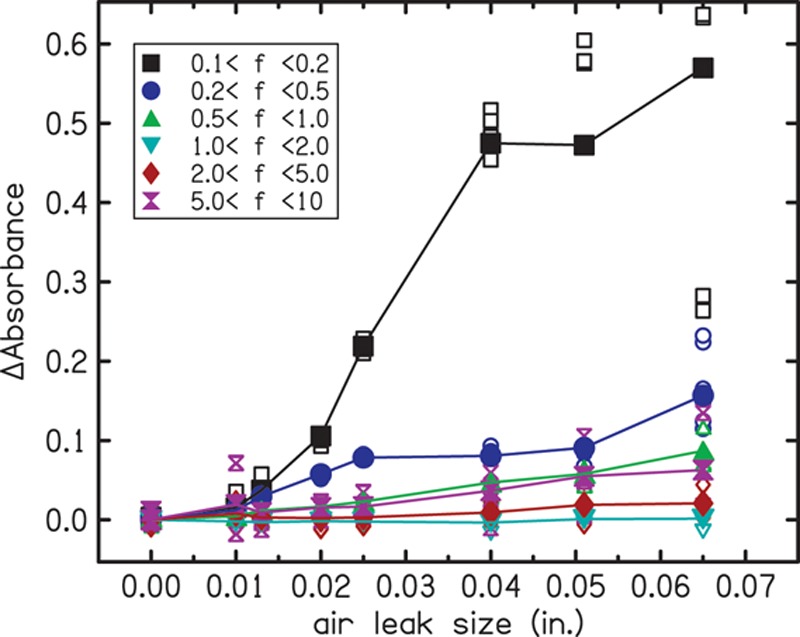
ΔAbsorbance as a function of the leak size in the brass cavity measurements. The parameter is the frequency band in which the estimates were made, represented by different symbols and colors as indicated in the inset. Open symbols indicate repeated measurements and filled symbols indicate the mean. ΔAbsorbance greater than zero can be observed in nearly all of the frequency bands but is largest in the lowest frequency band. A color version is available online.
Fig. 4.
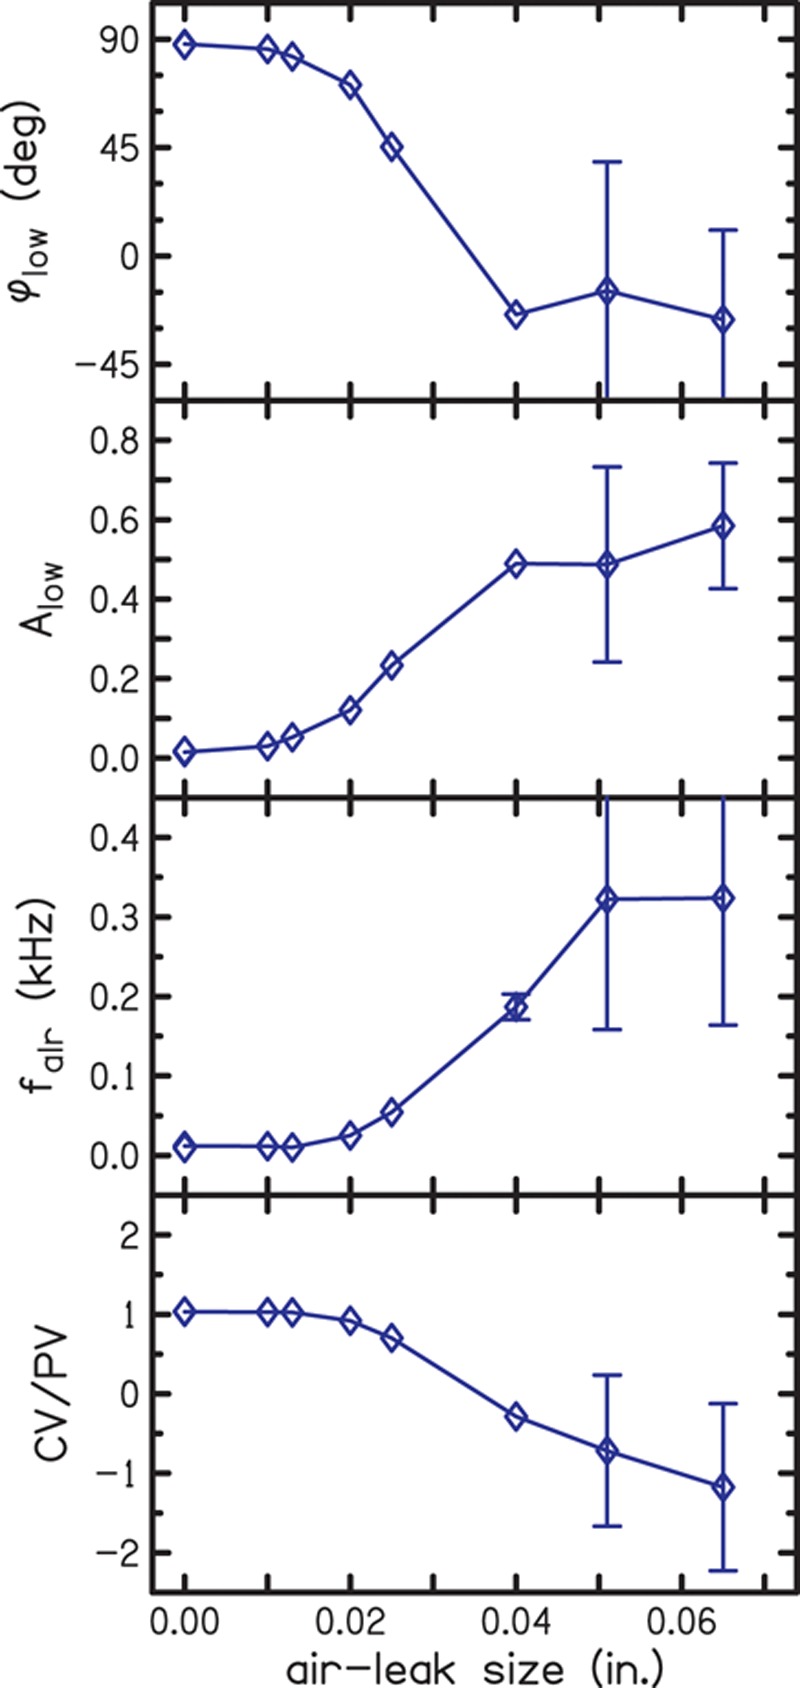
Quantifying air leaks by diameter in a brass cavity using the four predictor variables: (1) the admittance phase at low frequency (φlow), (2) the absorbance at low frequencies (Alow), (3) the resonance frequency of the air leak (falr), and (4) the ratio of compliance volume to physical volume (CV/PV). Low-frequency admittance phase and absorbance were calculated as averages over the frequency range of 0.1–0.2 kHz. The brass tube had 38.7 mm length and 8 mm i.d. (volume of 1.95 cc). The diamonds represent the mean results for the air-leak diameters, which are connected by the lines to better illustrate the trend. Error bars indicate SDs and show the greatest variability in the measurements at the two largest diameters. A color version is available online.
Each panel of Fig. 4 plots one of the four predictor variables (φlow, Alow, falr, and CV/PV) as a function of leak size. In the first panel, φlow is near 90 degrees for the no-leak condition, decreases as the size of the leak increases, and becomes negative for the three largest leaks. In the second panel, Alow is near zero for the no-leak condition and increases as the size of the leak increases. In the third panel, falr is near zero for the no-leak condition and increases as the size of the leak increases. In the fourth panel, CV/PV is near 1 for the no-leak condition, decreases as the size of the air leak increases, and becomes negative for the three largest leaks. CV becomes negative at large air-leak sizes, producing negative values of CV/PV, because our equation for computing CV assumes that low-frequency admittance is compliance-dominated and has a positive imaginary part. Whenever admittance phase becomes negative, the associated equation-based CV also becomes negative. In a rigid-walled cavity, the PV is the primary contributor to the measured volume and it is expected that PV and CV would be equal. As the effect of the air leak becomes apparent, this equality is altered. The pattern of dependence on leak size on the four predictor variables is similar, except that some are inverted; that is, there is lack of effect of the smaller leak diameters, followed by a gradient of change with medium-sized leak diameters and a new near constant level with larger-sized leak diameters. The error bars represent ±1 SD. For some measurements, the SD was so small that the error bars were hidden by the symbol. All four predictor variables have large SDs at the two largest leak sizes, which is probably due to the observed tendency for the larger diameter tubing to collapse (by varying amounts) when the foam tip was compressed.
Measurements in Ear Canals
The top panel of Fig. 5 shows mean absorbance for the condition without an air-leak for the 19 subjects (solid line) from whom reliable data were obtained. The shaded region represents the SD. The mean absorbance is near 0 at low frequencies (0.1–0.3 kHz), suggesting that most of the sound energy is not absorbed but reflected. Mean absorbance increases to attain a maximum of approximately 0.6 at 1.4 kHz. Absorbance remains around 0.6 up to 3.7 kHz, where it decreases to have a minimum of 0.2 at 6.5 kHz. Above 6.5 kHz, absorbance increases again. This pattern of change in absorbance with frequency is similar to previous reports from normal-hearing participants, as shown by the comparison to the data of Shahnaz et al. (2013) (dashed line in the top panel). Shahnaz et al. included data from 186 Caucasian participants and was collected using a commercially available WAI measurement system (Mimosa Acoustics, Champaign, IL). Our absorbance data, however, covers a wider frequency range, a consequence of the custom measurement equipment. The similarity of our mean absorbance to that of Shahnaz et al. demonstrates that the equipment and methods used in this study, including our time-domain impedance smoothing, produce absorbance that is similar (on average) to published data. The bottom panel of Fig. 5 shows the effect of the size of the air leak on mean absorbance. Absorbance increases in the low frequencies (below 0.4 kHz) as the size of the air-leak increases.
Fig. 5.
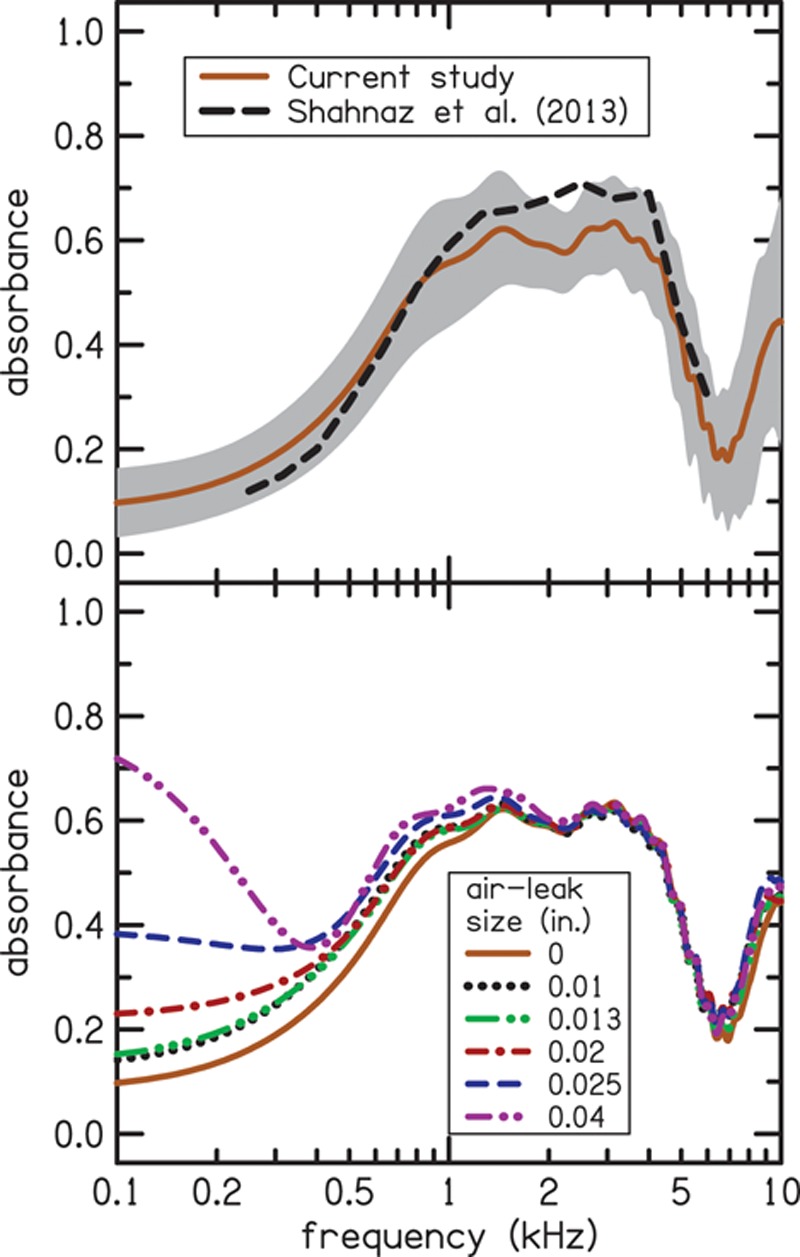
The top panel shows mean absorbance for the condition without an air leak. The shaded region indicates the standard deviation. Our data is similar to the data of Shahnaz et al. (2013) (shown as dashed line), which included 186 participants and was collected using different measurement equipment. However, our data covers a wider frequency range, a consequence of the custom measurement equipment. The bottom panel shows the effect of the size of the air leak on mean absorbance. Leak sizes are indicated using different colors and line styles as shown in the inset. Absorbance increases in the low frequencies (below 0.4 kHz) as the size of the air leak increases. A color version is available online.
The effects of the air leaks on the absorbance measurements for ear canals were similar to the trends observed for the cavity. Figure 6 summarizes the mean (across repeated measurements and participants) ear-canal effects of air-leak size on Δabsorbance in six frequency bands. Only five leak sizes were tested. The difference between absorbance for the two no-leak measurements is plotted as Δabsorbance for leak size equal to zero. The effect of the leaks was largest in the lowest frequency band (0.1–0.2 kHz). As the size of the leak increased, Δabsorbance generally increased for most frequency bands; however, this increase was nonmonotonic for some frequency bands. Variability of the no-leak condition (air-leak size of 0 in. in Fig. 6) was used to develop the criteria for determining significant deviation in absorbance, as mentioned earlier.
Fig. 6.
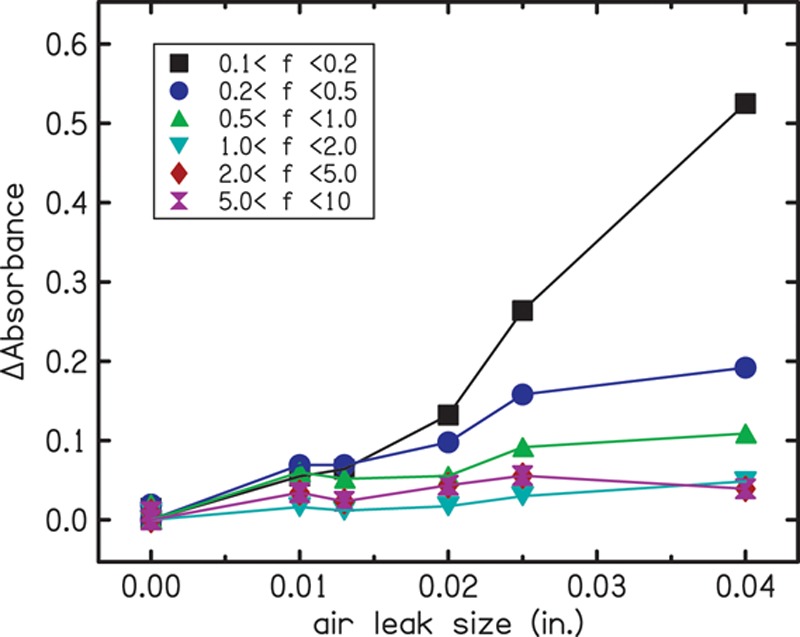
Mean effects of air-leak size on Δabsorbance in the ear canal in six frequency bands. The filled symbols represent the mean results for 19 subjects. Different colors and symbols indicate the frequency bands used in the analysis, as indicated in the inset. A color version is available online.
Figure 7 shows the dependence of Δabsorbance on the four air-leak predictor variables. Rows of Fig. 7 represent the results in different frequency bands and columns represent the results for the four predictor variables. Each data point represents the mean for 10 measurements in 19 subjects. Different symbols are used to represent different air-leak sizes (square = 0.01 in., circle = 0.013 in., upward triangle = 0.02 in. downward triangle = 0.025 in., and diamond = 0.04 in.). As expected, the value of each predictor variable depends on the size of the air leak, with the largest air-leak sizes having the largest values of falr and Alow, and the smallest values of CV/PV and φlow. The Pearson correlations (r) between each predictor variable and Δabsorbance are presented in Table 1. Table 1 also provides the mean absorbance and the SD of Δabsorbance for the no-leak conditions. The correlations for the various frequency bands were used to determine a quantitative measure for identifying air leaks. The highest correlations for all four predictor variables were seen in the lowest frequency band (0.1–0.2 kHz), where the correlation coefficient was as high as 0.98 for Alow. For a given frequency band, predictor variable Alow had the highest correlation, followed by φlow. The predictor variables were not correlated or were weakly correlated with Δabsorbance in the higher frequency bands (above 0.5 kHz), indicating that none of the four predictor variables could reliably identify air leaks by evaluating the high frequencies.
Fig. 7.
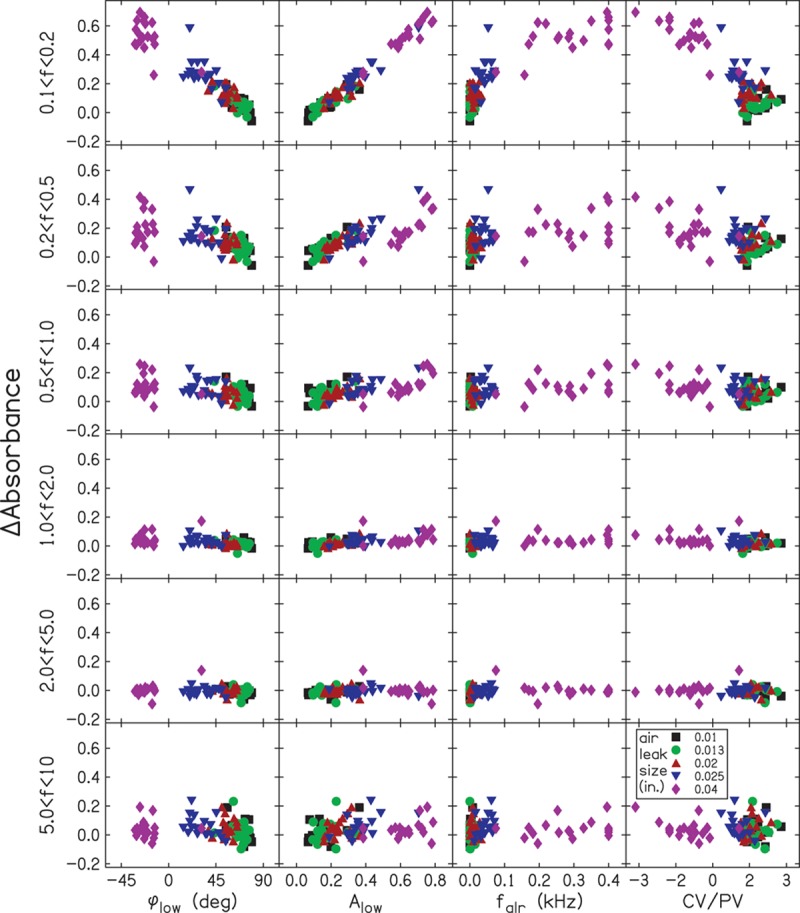
ΔAbsorbance as a function of the four predictor variables. Each panel has the mean results for each participant (19 subjects, five air-leak diameters). Different colors and symbols are used to indicate air-leak sizes. ΔAbsorbance is plotted on the y axis, and data for different frequency bands are shown in each row. The columns represent results for the four predictor variables: (1) the low-frequency phase (φlow), (2) the absorbance at low frequencies (Alow), (3) the air-leak-resonance frequency (falr), (4) the ratio of compliance volume to physical volume (CV/PV). A color version is available online.
TABLE 1.
No-leak absorbance and Δabsorbance correlation in each of the frequency bands used in the analysis

The correlations between Δabsorbance and variables Alow and φlow in the low-frequency bands (0.1–0.2 and 0.2–0.5 kHz) suggest that these two variables may be the best for predicting air leaks in ear-canal measurements. We determined values of these predictor variables that are associated with significant changes in absorbance, where a significant change was defined as one in which the absorbance exceeded two SDs for the no-leak condition. Figure 8 shows simple linear-regression fits to the plots of Δabsorbance versus Alow (left panel) and φlow (right panel) for low-frequency bands (0.1–0.2 and 0.2–0.5 kHz). The SDs for the no-leak condition in these frequency bands are 0.046 and 0.050 (see Table 1). These SDs translate to significant Δabsorbance values of 0.09 and 0.1 for 0.1–0.2 kHz and 0.2–0.5 kHz frequency bands, respectively. Figure 8 uses dotted lines to show values of Alow and φlow that are associated with significant air leaks when a criterion of Δabsorbance = 0.1 is used for the two low-frequency bands.
Fig. 8.
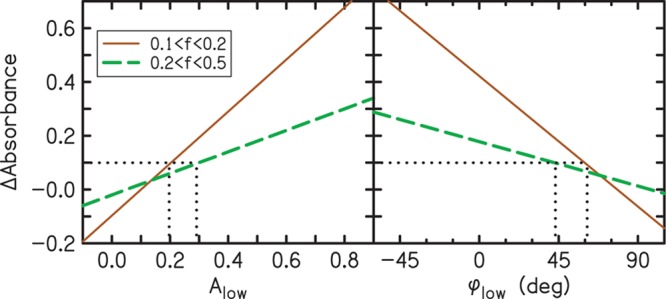
Summary of the criteria that have the strongest correlations with air leaks. The solid and dashed lines are simple linear regression fits to the data of Fig. 7 for frequency bands of 0.1–0.2 and 0.2–0.5 kHz, respectively. The two dotted lines show the values of Alow and φlow that correspond to a significant change in Δabsorbance. No leak is indicated when the value of Alow is less than 0.20. In the 0.1–0.2 kHz band, a leak is indicated when Alow is in the range from 0.20 to 0.29 and in the 0.2–0.5 kHz band, a leak is indicated when Alow is greater than 0.29. Likewise, φlow indicates no leak when φlow is greater than 61 degrees. In the 0.1–0.2 kHz band, a leak is indicated when φlow is in the range from 44 to 61 degrees and in the 0.2–0.5 kHz band and a leak is indicated when φlow is less than 44 degrees. A color version is available online.
In routine assessment of air-leak effects on absorbance, it may be reasonable to adjust the stringency of the air-leak criteria according to the importance of the 0.1–0.2 frequency range to the particular absorbance measurement. When the frequency range of interest extends low enough to include the 0.1–0.2 kHz frequency band, then a significant air leak is likely to exist when Alow is greater than 0.20 or when φlow is less than 61 degrees. However, when the frequency range of interest only extends to the 0.2–0.5 kHz frequency band, then the criteria for existence of a significant air leak changes to Alow greater than 0.29 or φlow less than 44 degrees. Thus, the criteria for determining whether an air leak of sufficient size exists to cause a significant effect depends on the lower limit of the frequency range of interest.
DISCUSSION
Air leaks can increase the variability and compromise the validity of acoustic measurements in human ear canals. This study evaluated four possible acoustic metrics for predicting the presence of air leaks and for quantifying the impact of these leaks on measurements of acoustic absorbance in human ear canals. The four metrics were (1) low-frequency phase φlow, (2) absorbance at low frequencies Alow, (3) air-leak-resonance frequency falr, and (4) the ratio of compliance volume to physical volume CV/PV.
Preliminary analyses were performed on measurements in a brass cavity and with fabricated air leaks of different sizes. A dependence of Δabsorbance on air-leak size and on frequency band was observed. ΔAbsorbance generally increased with air-leak size and was largest for the lower frequency bands (0.1–0.2 and 0.2–0.5 kHz) (Fig. 3). The four predictor variables also depended on air-leak size. As air-leak size increased, Alow and falr increased while φlow and CV/PV decreased (Fig. 4). The two largest tubing diameters used in the cavity measurements, 0.051 and 0.065 in., had increased variability compared to the other sizes (see Figs. 3 and 4). These larger diameter tubes stretched the foam more than the smaller tubing, which may have compromised the structural integrity and created additional air leaks around the position of the tube. In addition, when the foam was compressed for insertion into the ear canal, the larger tubes were more susceptible to collapsing than the smaller tubes. Because of the variability in the measurements with the two tubes having the largest diameters and a desire to reduce the number of measurement conditions in participants, the two largest air-leak sizes were not included in the ear-canal measurements.
Similar relationships among Δabsorbance, air-leak size, and frequency band were observed in the ear-canal measurements as were observed in the brass-cavity measurements. That is, Δabsorbance generally increased with air-leak size and was largest at the lower frequency bands (0.1–0.2 and 0.2–0.5 kHz). All of the predictor variables had the strongest correlations to Δabsorbance in the lowest frequency band (see Fig. 7). The strongest correlations were observed for Alow (r = 0.98 and r = 0.82 for 0.1–0.2 and 0.2–0.5 kHz frequency bands, respectively) and φlow (r = −0.95 and r = −0.65 for 0.1–0.2 and 0.2–0.5 kHz frequency bands, respectively), making φlow and Alow the most reliable predictors of air leaks. The vertical spread of the data in the highest frequency band (Fig. 7) indicates that the presence of an air leak had an effect on the ear-canal measurements but that there was no correlation to the predictor variable. In most of the panels of Fig. 7 (especially for φlow and falr), the symbols appear to be grouped into two clusters with all of the symbols in one of the two clusters being diamonds, the symbols representing an air-leak size of 0.04 in. Presumably, the addition of another diameter between 0.025 and 0.04 in. to the set of leak sizes would have filled the gap between the two clusters.
Although the effects of air leaks on absorbance mostly occur at low frequencies (see lower panel of Fig. 5), the smallest leak (0.01 in.) had the greatest effect on cavity absorbance (see Fig. 3) in the highest frequency band (5–10 kHz). For both the cavity and the ear-canal measurements, the high-frequency effect had the appearance of shifting the frequency at which peaks or notches occurred and was unpredictable, even for larger leaks, because correlations with all of the predictor variables were low. The air-leak effects on absorbance were the least for the two frequency bands below 5 kHz (1–2 and 2–5 kHz) (Figs. 3 and 6), which is fortunate because this frequency range may have the greatest potential for diagnosing middle-ear pathology (e.g., Keefe et al. 1993; Sanford & Feeney 2008; Hunter et al. 2013).
Because CV and PV as determined from WAI measurements have not previously been reported for our measurement system, it was of interest to compare them to the corresponding tympanometric measurements. Figure 9 shows values for WAI CV (top panel) and PV (bottom panel) for each subject plotted against their corresponding tympanometric CV and PV values. The dashed lines indicate simple linear-regression fits to the data. Ear-canal volume reported by the tympanometer was used as the estimate of tympanometric PV. Tympanometric CV was estimated as the sum of tympanometric PV and the peak-compensated static admittance reported by the tympanometer. Under standard atmospheric conditions, and with some constraints on the geometry of the enclosure, the conversion of admittance to volume at 226 Hz is such that 1.0 acoustic mmho equals 1.0 cm3 of air (e.g., Lilly & Shanks 1981). Correlations were observed between the WAI-derived measurements and the tympanometric measurements (r = 0.799 for CV and r = 0.802 for PV). The WAI-derived volumes tended to underestimate the tympanometric volumes for both the CV and PV values. This was expected because the tympanometer uses positive pressure in the ear canal to measure the PV, whereas the WAI measurements are made without pressurization. Likewise, we expected the tympanometric CV to be larger, because it is always measured at the peak pressure where compliance is always greater than or equal to compliance at ambient pressure (where WAI CV is measured). In general, the similarity of our WAI CV and PV values to the corresponding values reported on the tympanogram validate our calculations.
Fig. 9.
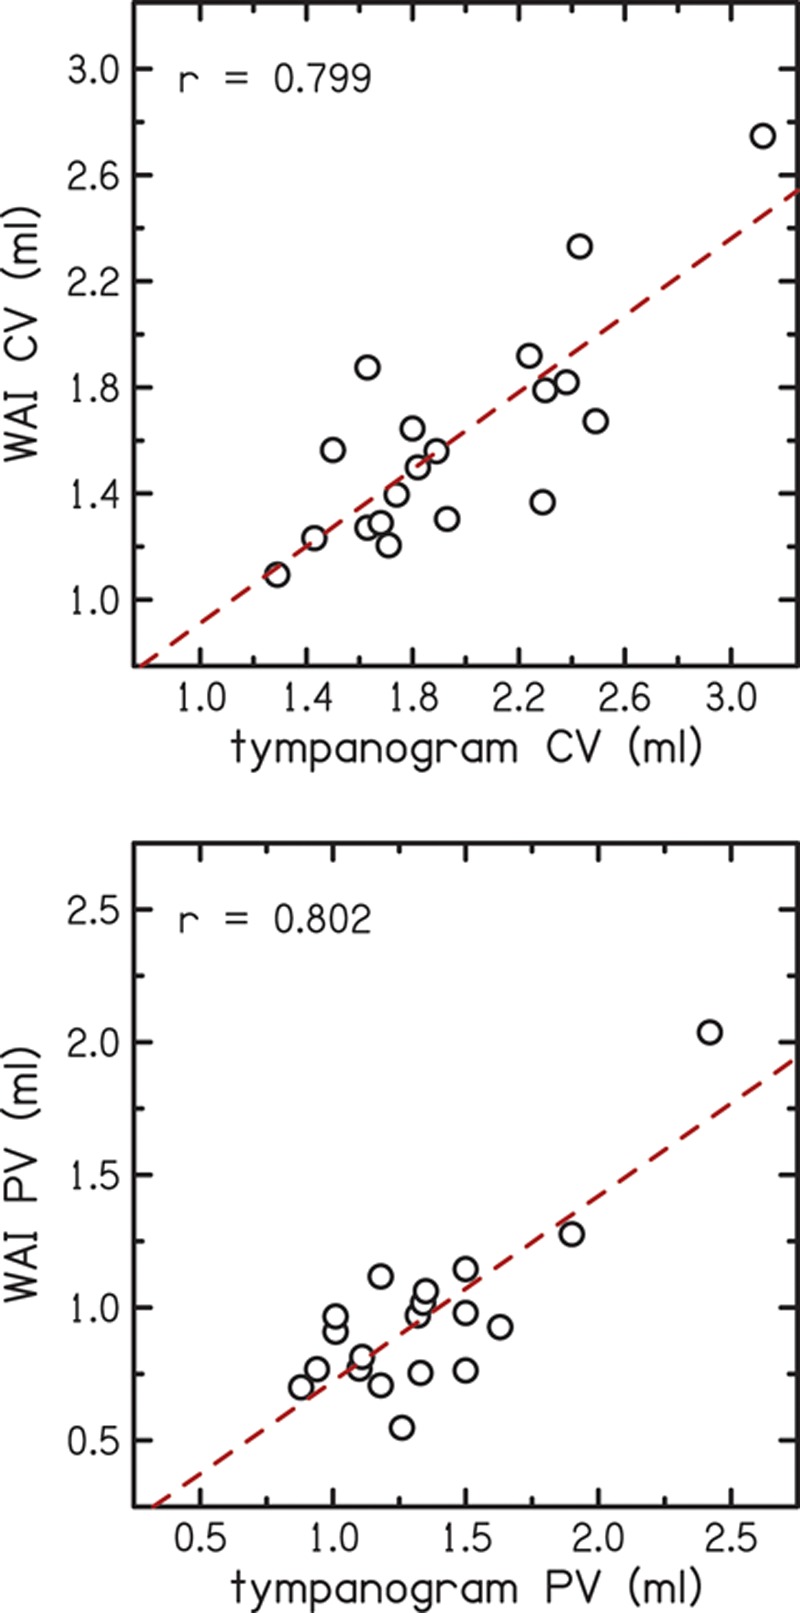
Comparison of compliance volume and physical volume determined using wideband acoustic immittance (WAI) to tympanometric values. In the top panel, the y-axis is the compliance volume derived from the WAI measurements and the x-axis shows compliance volume from the tympanogram. In the bottom panel, the y-axis is the physical volume derived from the WAI measurements and the x-axis shows physical volume from the tympanogram. The dashed lines indicate simple linear regression fits to the data. A color version is available online.
CONCLUSIONS
Air leaks can have significant effects on ear-canal absorbance when their size exceeds 0.01 in. To some extent, these effects will also be observed in other measures of WAI. At low frequencies, where the effects are greatest, air leaks cause absorbance to increase. Air-leak effects were also observed at frequencies up to 10 kHz, but the size and direction of the effects on ear-canal absorbance were unpredictable above 1 kHz. The presence of an air leak can be reliably detected using low-frequency admittance phase or low-frequency absorbance. The following criteria are recommended as a guide for suspecting probe-tip leaks in normal adult ears. When the frequency band from 0.1 to 0.2 kHz is of interest, a value of Alow of 0.20 or higher or φlow of 61 degree or lower would suggest a leak. When only the frequency band from 0.2 to 0.5 kHz is of interest, then the criteria may be less stringent. Accordingly, values of Alow of 0.29 or higher or φlow of 44 degree or lower would suggest a leak.
ACKNOWLEDGMENTS
The authors thank Sara Fultz for her assistance with the initial tests of the leak-manufacturing process. The authors thank Colleen Gibilisco for assistance in participant recruitment.
Footnotes
This research was supported by grants T35 DC8757, R01 DC8318, and P30 DC4662 from the National Institute of Health.
The authors declare no other conflict of interest.
REFERENCES
- Allen J. B. Measurement of eardrum acoustic impedance. In: J. B. Allen, J. L. Hall, A. Hubbard, S. T. Neely, A. Tubis., editors. Peripheral Auditory Mechanisms. New York, NY: Springer-Verlag; (1986). pp. 44–51). [Google Scholar]
- Burke S. R., Rogers A. R., Neely S. T., et al. Influence of calibration method on DPOAE measurements: I. Test performance. Ear Hear. (2010);31:533–545. doi: 10.1097/AUD.0b013e3181d86b3d. [DOI] [PMC free article] [PubMed] [Google Scholar]
- Feeney P. M., Hunter L. L., Kei J., et al. Consensus statement: Eriksholm workshop on wideband measures of the middle ear. Ear Hear. (2013);34:78S–79S. doi: 10.1097/AUD.0b013e31829c726b. [DOI] [PubMed] [Google Scholar]
- Henriksen V. Using impedance measurements to detect and quantify the effect of air leaks on the attenuation of earplugs. J Acoust Soc Am. (2008);124:510–522. doi: 10.1121/1.2932092. [DOI] [PubMed] [Google Scholar]
- Hunter L. L., Prieve B. A., Kei J., et al. Pediatric applications of wideband acoustic immittance measures. Ear Hear. (2013);34(Suppl 1):36S–42S. doi: 10.1097/AUD.0b013e31829d5158. [DOI] [PubMed] [Google Scholar]
- Keefe D. H., Ling R., Bulen J. C. Method to measure acoustic impedance and reflection coefficient. J Acoust Soc Am. (1992);91:470–485. doi: 10.1121/1.402733. [DOI] [PubMed] [Google Scholar]
- Keefe D. H., Bulen J. C., Arehart K. H., et al. Ear-canal impedance and reflection coefficient in human infants and adults. J Acoust Soc Am. (1993);94:2617–2638. doi: 10.1121/1.407347. [DOI] [PubMed] [Google Scholar]
- Keefe D. H., Folsom R. C., Gorga M. P., et al. Identification of neonatal hearing impairment: Ear-canal measurements of acoustic admittance and reflectance in neonates. Ear Hear. (2000);21:443–461. doi: 10.1097/00003446-200010000-00009. [DOI] [PubMed] [Google Scholar]
- Kemp D. T., Ryan S., Bray P. A guide to the effective use of otoacoustic emissions. Ear Hear. (1990);11:93–105. doi: 10.1097/00003446-199004000-00004. [DOI] [PubMed] [Google Scholar]
- Lilly D. J., Shanks J. E. Hearing Assessment with the Acoustic Reflex. New York, NY: Grune & Stratton; (1981). Acoustic immittance of an enclosed volume of air. [Google Scholar]
- Neely S. T., Liu Z. EMAV: Otoacoustic emission averager, Technical Memo No. Omaha, NE: 17 Boys Town National Research Hospital; (1994). [Google Scholar]
- Neely S. T., Gorga M. P. Comparison between intensity and pressure as measures of sound level in the ear canal. J Acoust Soc Am. (1998);104:2925–2934. doi: 10.1121/1.423876. [DOI] [PubMed] [Google Scholar]
- Neely S. T., Stenfelt S., Schairer K. S. Alternative ear-canal measures related to absorbance. Ear Hear. (2013);34(Suppl 1):72S–77S. doi: 10.1097/AUD.0b013e31829c7229. [DOI] [PMC free article] [PubMed] [Google Scholar]
- Rasetshwane D. M., Neely S. T. Inverse solution of ear-canal area function from reflectance. J Acoust Soc Am. (2011);130:3873–3881. doi: 10.1121/1.3654019. [DOI] [PMC free article] [PubMed] [Google Scholar]
- Rasetshwane D. M., Neely S. T. Measurements of wide-band cochlear reflectance in humans. J Assoc Res Otolaryngol. (2012);13:591–607. doi: 10.1007/s10162-012-0336-1. [DOI] [PMC free article] [PubMed] [Google Scholar]
- Rosowski J. J., Nakajima H. H., Hamade M. A., et al. Ear-canal reflectance, umbo velocity, and tympanometry in normal-hearing adults. Ear Hear. (2012);33:19–34. doi: 10.1097/AUD.0b013e31822ccb76. [DOI] [PMC free article] [PubMed] [Google Scholar]
- Reuven M. L., Neely S. T., Kopun J. G., et al. Effect of calibration method on distortion-product otoacoustic emission measurements at and around 4 kHz. Ear Hear. (2013);34:779–788. doi: 10.1097/AUD.0b013e3182994f15. [DOI] [PMC free article] [PubMed] [Google Scholar]
- Sanford C. A., Feeney M. P. Effects of maturation on tympanometric wideband acoustic transfer functions in human infants. J Acoust Soc Am. (2008);124:2106–2122. doi: 10.1121/1.2967864. [DOI] [PMC free article] [PubMed] [Google Scholar]
- Scheperle R. A., Neely S. T., Kopun J. G., et al. Influence of in situ, sound-level calibration on distortion-product otoacoustic emission variability. J Acoust Soc Am. (2008);124:288–300. doi: 10.1121/1.2931953. [DOI] [PMC free article] [PubMed] [Google Scholar]
- Shahnaz N., Feeney M. P., Schairer K. S. Wideband acoustic immittance normative data: Ethnicity, gender, aging, and instrumentation. Ear Hear. (2013);34(Suppl 1):27S–35S. doi: 10.1097/AUD.0b013e31829d5328. [DOI] [PubMed] [Google Scholar]
- Souza N. N, Dhar S., Siegel J. H. “A Critical Test of Alternate Stimulus Level Measures for the Human Ear,” presented at the Midwinter Meeting of the Association for Research in Otolaryngology. (2010).
- Stepp C. E., Voss S. E. Acoustics of the human middle-ear air space. J Acoust Soc Am. (2005);118:861–871. doi: 10.1121/1.1974730. [DOI] [PubMed] [Google Scholar]
- Vander Werff K. R., Prieve B. A., Georgantas L. M. Test–retest reliability of wideband reflectance measures in infants under screening and diagnostic test conditions. Ear Hear. (2007);28:669–681. doi: 10.1097/AUD.0b013e31812f71b1. [DOI] [PubMed] [Google Scholar]
- Voss S. E., Allen J. B. Measurement of acoustic impedance and reflectance in the human ear canal. J Acoust Soc Am. (1994);95:372–384. doi: 10.1121/1.408329. [DOI] [PubMed] [Google Scholar]
- Voss S.E., Merchant G.R., Horton N.J. Effects of middle-ear disorders on power reflectance measured in cadaveric ear canals. Ear Hear. (2012);33:195–208. doi: 10.1097/AUD.0b013e31823235b5. [DOI] [PMC free article] [PubMed] [Google Scholar]
- Voss S., Neely S., Rosowski J., et al. Factors that introduce intra-subject variability into ear-canal absorbance measurements. Ear Hear. (2013);34:60S–64S. doi: 10.1097/AUD.0b013e31829cfd64. [DOI] [PMC free article] [PubMed] [Google Scholar]


