

ABSTRACT
Aim:
The main objective of this descriptive and development research was to introduce a design protocol to develop radiology dashboards.
Material and methods:
The first step was to determine key performance indicators for radiology department. The second step was to determine required infrastructure for implementation of radiology dashboards. Infrastructure was extracted from both data and technology perspectives. The third step was to determine main features of the radiology dashboards. The fourth step was to determine the key criteria for evaluating the dashboards. In all these steps, non-probability sampling methods including convenience and purposive were employed and sample size determined based on a persuasion model.
Results:
Results showed that there are 92 KPIs, 10 main features for designing dashboards and 53 key criteria for dashboards evaluation. As well as, a Prototype of radiology management dashboards in four aspects including services, clients, personnel and cost-income were implemented and evaluated. Applying such dashboards could help managers to enhance performance, productivity and quality of services in radiology department.
Keywords: Dashboards, Protocol, Radiology Department, Design
1. INTRODUCTION
The field of radiology is continuously growing. Since imaging services are widely used and affect on patient care in the hospital, much attention has been paid to quality assurance in radiology departments. Since, measuring the quality of imaging services is inherently difficult, standard sets of KPIs should be used as key tools for evaluating and improving departmental processes. In traditional method, the monitoring of indicators involved the review of patient records to document the effect of diagnostic imaging on the care outcome is costly in staff time and labor (1).
With the modernization of radiology departments, along with using electronic information systems such as PACS, RIS, speech recognition systems, preliminary report systems, hospital information systems, and electronic health records, workflow and informatics infrastructure supporting them became very complex. This is because it requires combining many computerized systems with different user environments to provide quality efficient services in less time (2-3).
Since within this complexity, close monitoring the operational and financial data is an essential element for the management; Traditional methods of data involving review of Key Performance Indicators become quickly outdated and changed to use new technologies. In recent year, a variety of management tools have been introduced to digitally monitor essential data under the general name of dashboards (4).
Dashboards is an intellectual and visual tool for monitoring of KPI which can capture key data from different systems and represent them summarized and useful in real-time with easier reading and interpretation for users (5). This business intelligence tool can applied in radiology department as used in other sections such as operation rooms (6), emergency rooms (7), diabetes (8), and hospital infection control (9).
In radiology department, workflow are optimized when radiologists have real-time information to make informed decisions, and the capacity to efficiently act on that information. Dashboards technology can facilitate informed, optimized decisions about workflow by link directly to the electronic information systems and provide the right information in a right format at the right time to monitor productivity in order to improve in performance and effectiveness of activity (10). In this research, a design protocol to develop radiology dashboards in order to enhance performance, productivity and quality of services in this department, has been proposed. As well, a prototype of radiology management dashboards were implemented and evaluated using data obtained from a selected hospital affiliated to Tehran University of Medical Sciences.
2. RESEARCH METHOD
This descriptive and development research has been done in 4 steps during 2012 up to 2014.
Determine Key Performance Indicators for radiology department: This descriptive study was conducted using the Delphi technique. In this step, study population was including 30 radiologists who were members of Iranian Radiology Association and had professional experience in managing of radiology department. Non-probability sampling method including convenience and purposive were employed. Electronic questionnaire was used to collect information. At the end of the two-stage Delphi technique 92 key indicators to assess the performance of the radiology department into 7 main categories including “safety, service, internal and external customers, teaching and research, resource utilization, financial performance and excellence in the workplace” was determined.
Determine a comprehensive model for designing of dashboards: This step of the research is descriptive. The study population was composed of 15 specialists in the field of informatics who had experience in creating dashboards. Non-probability sampling method including convenience and purposive were employed. Electronic questionnaire was used to collect information. At the end of this stage, 10 main features including” determining the goal of dashboards design, aligning with organizational goals, determining KPIs, setting a time frame, extracting the accurate data, flexibility, drilling-down capabilities, security, how to representation and display alert” were determined as a model for designing dashboards.
Determine required infrastructure for implementation of Radiology Management Dashboards: Infrastructure was extracted from both data and technology perspectives and the following steps are performed:
Determining the goals of the dashboards design in order to determine the KPIs
Defining the target group who are authorized to use dashboards
Determining whether the dashboards show the retrospective data or real-time data?
Determining KPIs to achieve defined goals and how to calculate them
Identifying the required data to achieve these indicators and sources of data
Setting intervals to update the information
Identifying the reporting format of the data resource
Specifying how to extract data
Determine the key criteria for assessing the dashboards: In this step, a total of 46 specialists from medical informatics, health information management, software engineering, and radiology field who had experience in the field of business intelligence were chosen as study population. Non-probability sampling method including convenience and purposive were employed. Electronic questionnaire was used to collect information. At the end of this stage, 53 key criteria in seven categories including“user-customization, knowledge discovery, security, information delivery, visual design, alerts, connectivity and integration” were determined for dashboards evaluation.
3. RESULTS
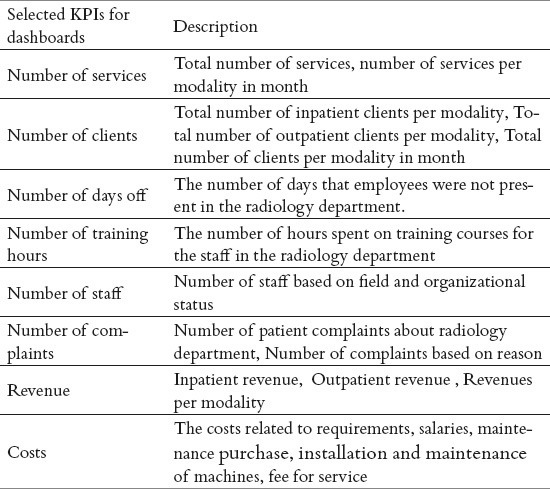
The findings based on the research steps are the following: In first step, as shown in Table (1), 92 key indicators to assess the performance of the radiology department at the seven categories were determined. In the second step, a comprehensive model for the design of the dashboards as shown in Table (2) was determined. In the third step, to prepare prototype radiology management of dashboards, QlikView software as open source integration software that is executable in a hospital operating systems including Windows XP, Windows 7 and Windows 8 are from Microsoft, was used. As well as, some KPI as shown in table (3) was selected from table (1) to display in radiology management dashboards, the data was captured form radiology information system, financial information system and personnel information system and the time interval for updating was monthly. In the fourth step, the dashboards evaluation criteria were determined which are presented in Tables 1-4 (4).
Table 1.
Key performance indicators in radiology department
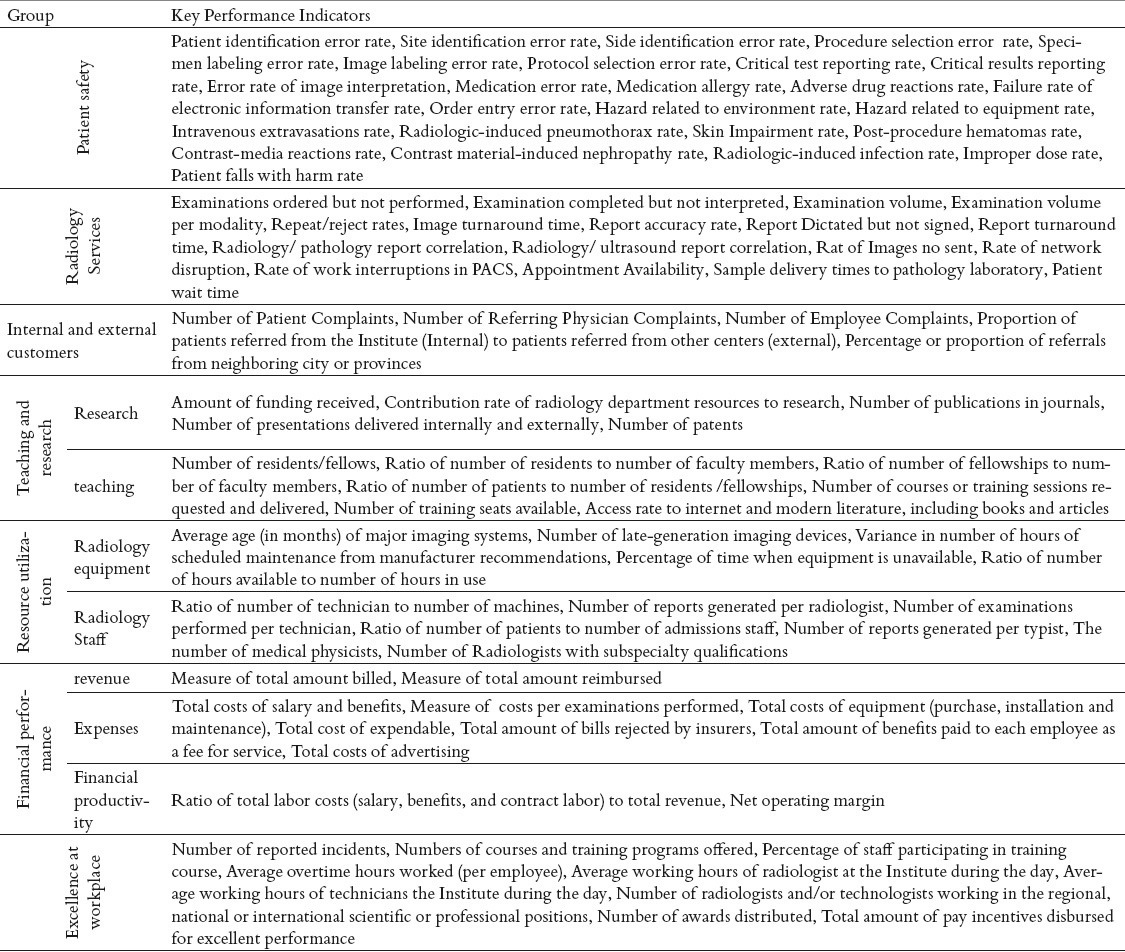
Table 4.
key criteria for the dashboards evaluation
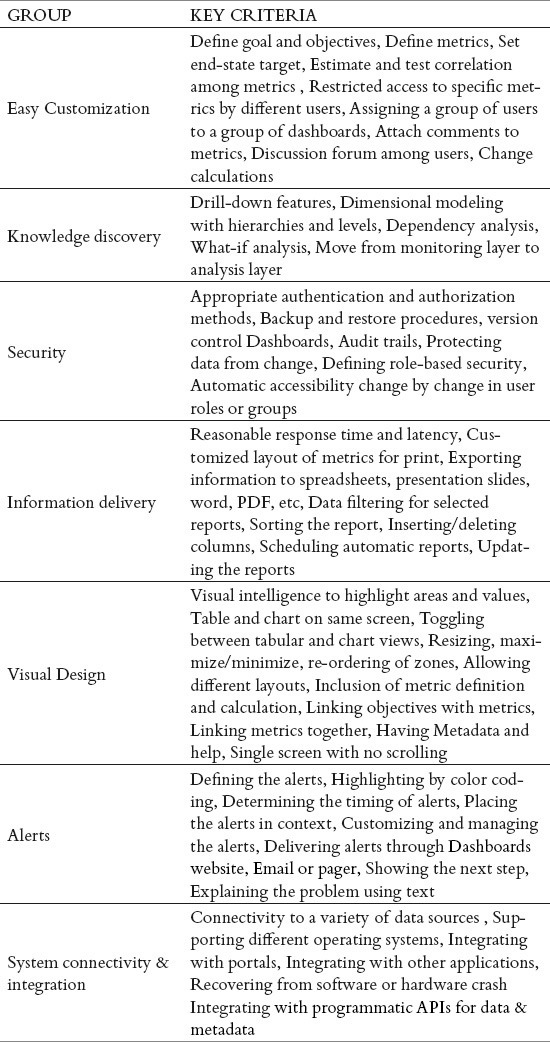
Table 2.
A Comprehensive Model for Designing Radiology Dashboards
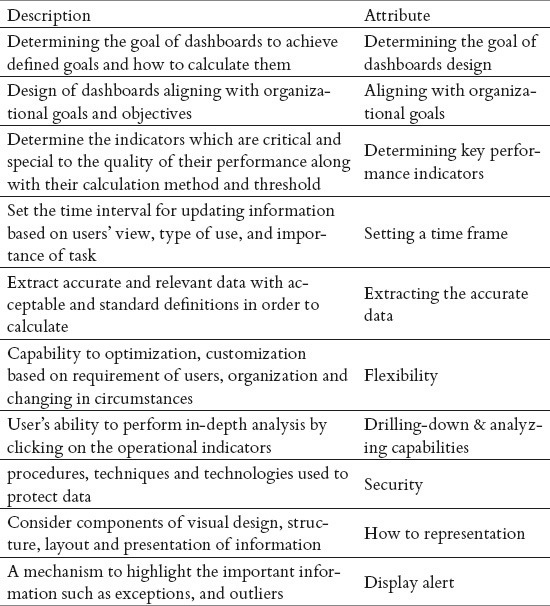
Table 3.
Selected KPIs for radiology department management dashboards
4. DISCUSSION
Given the above it can be concluded that the field of radiology is faced with the challenges of increasing service use, declining reimbursements, and staff shortages. In such an economically challenging environment, it becomes crucial for radiology departments to monitor their performance so that they can provide a high quality of services while staying within operational boundaries (11). Accordingly, in this research, enhancement of performance, productivity and quality of services in radiology department as the aims of dashboards designing was considered.
In this field, Performance improvement is a process that differs from analyses made in commercial companies, where increased revenue is the major goal. In healthcare, the benefit to the individual patient is the main goal, with less emphasis being placed on economic implications (12). So to improve the quality required to ensure the proper planning done. A key element to planning is to select required data, and then adopt appropriate methods to collect data actively, consistently and effectively and represent them in performance indicator format (13).
Therefore it is necessary to instill a culture to determine necessary data to calculate the KPIs, the ways to collect these data and appropriate tools should be used for data analysis and trending. However, it should be noted that quality is not a goal at the radiology department but it is responsibility and accountability of and necessary to create a shared vision by hospital and radiology practice leadership that centers on patient.
About Dashboards design, because of radiology department is complex environment and has a variety of services, clients, personnel, equipment, technologies, data and information which are generated, the following key points need to be considered:
Organizational culture: Organizational culture is the normal behaviors dominating an organization (14) and can be an important factor in successful implementation of technology(15). Implementing dashboards requires organizational culture to accept objective data as the basis for decision making (6).
Determining the goal of dashboards design: Experts believe that dashboards objectives should be limited in order for the managers to allocate the resources to critical issues (16)and divide the objectives into three groups: financial, operational and quality (17). Therefore, the goals of dashboards design for the department should be clear; whether it is for workflow consolidation, workload distribution, urgency evaluation (18), capacity and workflow management (19), surveillance (20, 21), or financial reporting (22).
Involving users: in designing a comprehensive dashboards, it is necessary to involve users in the design and development processes because expectations will closely match to functionality and users provide suggestions based on their needs which can reduce the time of development and dashboards redesign after implementation as feedbacks and evaluations are provided (8, 15).
Aligning with organizational goals: Dashboards should be designed based on overall goals and objectives of organization in such a way that each department by monitoring its KPIs facilitates achieving its objectives besides the strategic goals of organization (1, 6, 8, 16, 23, 24, 25).
Determining KPIs and benchmark standards: Selecting the type of indicators which should be included in dashboards is important. Depending on its situation, each department needs to measure the indicators related to its own area of performance, not all the indicators (9, 26), in other words, indicators which are critical and special to the quality of their performance (27). Each indicator is selected according to business purpose and the ability to be gathered easily through standard business functions (28) and besides accurate measurement of the indicator (9), we should identify dashboards metrics from regulatory standards which we need for accreditation or credentials (29). In designing an effective dashboards, the number of measurements should be limited, at least 15 to 25, in order to be viewed at a glance (17).
Data: A well designed dashboards should include accurate data which is related to business process from different sources and based on acceptable and standard definitions in order to be used in benchmarking process (30). In addition, data storage should be based on standard format and coding to be able to manipulate them easily, to facilitate sharing them, and reduce their processing time while updating and querying from dashboards (20).
Knowledge discovery: It is necessary that the structure of data storage be in a logical hierarchy and with required granularity (6) for data mining (30) and online analytical processing (OLAP) (31) in order to extract knowledge from the data in dashboards. This will enable the user to drill down data with clicking on operational indicator to gain deep analysis of that indicator to prospectively predict the effects of decisions (6, 32-33) and preparing the reports in the form of pdf and Excel (31). Regarding knowledge extraction, considering the time of search, number of clicks, and the precision and accuracy of data are critical (8).
Flexibility: According to (18) dashboards should have the ability to be optimized, customized, workflow-integrated, and context-specified. This feature is also important for determining indicators such that the user can have access to the information for specific purposes(17) and can organize them according to his or her preferences and save them to reuse in future(34). In designing dashboards it is also important that dashboards would have the capability to add required metrics or make change in it (26, 29).
Security: It is important to make sure about the security of data at all times because in radiology department, dashboards data is the result of integration of a number of information systems and also based on the internet or intranet. According to (33) it is necessary to consider a unique accession number for connecting data parts together and a secure log-in to have access to pages containing personal health information. In addition, utilizing ‘single sign -on’ technology for the user to have access to each application is suggested (3, 34).
Time frame: The frequency of measurement of indicators depends on the nature of indicator and its effectiveness and importance on operation of department. The focus of measurement should change from period to period (9). Updating information based on users’ view, type of use, and importance of task can be from every second to every month.
Representation: Since dashboards is a tool for quick, brief, and real-time representation of data, organizing and displaying data should be such that it could be easily read and interpreted (35) and the user does not need to scroll the pages (20). Depending on the type of indicators and their numbers, we can use tables or graphs to display for users to understand and make decisions (30). It is better to provide visualization in the form of graphs according to the type of indicator (36) to show benchmarking comparison (34) because tables cannot be easily and quickly read (36). What is critical is that the direct representation should be able to alert by color coding to show levels of threats. These alerts are based on performance target thresholds which are derived from the yearly goals and objectives (33). According to (3) user interface dashboards in radiology department should be divided into three groups: User, Division, and System. They can be represented in different colors based on the priority of alerts like the traffic light (a red, yellow, or green circle) (3, 9, 19, 33, 37).
Dashboards Assessment: assessment should be considered based on two aspects. One is the verification of dashboards and other side is evaluation of dashboards itself to find out its effect on the department performance which can be done through questionnaires given to users(32). The results can be published in the form of newsletter in order for the users to make a general evaluation of their own and the department's performance over time (25, 37).
About dashboards implementation, for achieve to a comprehensive set of dashboards that contain managerial and clinical operations of the radiology department So as to be able to create the accountability and strategic value in all aspects of financial, quality and clinical, the following technical infrastructure is necessary to be considered:
Designing data warehouse for gathering data from a variety of systems such as clinical information system and financial information system in order to get a comprehensive view of operations (34)
Using back-end algorithm of indicators or statistics for providing general and detailed reports (20)
Accessibility to Internet or Intranet in order to facilitate sharing data and maintain data dynamism (6, 31, 34)
Utilizing SOA architecture to encapsulate data in middle ware layer to be of use in different systems (3)
Using API to create a hyperlink in dashboards alert to load a study when clicked by the user (3)
Using relational database with a web service interface for modifying and querying state (3)
Utilizing interoperability standards such as HL7 messaging standards and DICOM to make connections and data exchange among different systems (3, 33)
Using agents in data models for registering and managing alerts if alerts are to be shown in groups or individual (3)
Designing dashboards in. Net environment because it will result in flexibility, ease and integration with the system (31, 34)
Utilizing web based interfaces for visualizing information (33)
Displaying graphics using server based web control which is much faster than the client based control (34)
5. CONCLUSION
In this research, the key performance indicators were determined in order to performance assessment of academic radiology departments. On top of this, a comprehensive model for designing of dashboards and a checklist including key criteria for assessing of dashboards were provided. It should be noted that the model and assessment checklist could be used for all types of dashboards.
Finally a prototype of radiology management dashboards was implemented in four aspects including services, clients, personnel and cost-income. Applying such dashboards could help managers to evaluate radiology department from desirable or undesirable stance of performance, resource consumption and distribution of manpower at a glance, as well as identifying problems, root cause analysis and solving them using valid information driven from dashboards. In addition, it allows enhancing performance, productivity and quality of services in radiology department.
Acknowledgments
We thank of Innovation Initiative of Tehran University of Medical Sciences, Iranian Society of Radiology and Medical Imaging Informatics Research and Education Centre (MIIREC) for help in conducting this research
Footnotes
CONFLICT OF INTEREST: NONE DECLARED.
REFERENCES
- 1.Abujudeh HH, Kaewlai R, Asfaw BA, Thrall JH. Quality initiatives: Key performance indicators for measuring and improving radiology department performance. Radiographics. 2010 May;30(3):571–580. doi: 10.1148/rg.303095761. [DOI] [PubMed] [Google Scholar]
- 2.Morgan MB, Chang PJ. The radiology dashboards: A user's guide to a “high-performance” PACS. Applied Radiology. 2005;34(5):17–21. [Google Scholar]
- 3.Morgan MB, Branstetter BFt, Lionetti DM, Richardson JS, Chang PJ. The radiology digital dashboards: effects on report turnaround time. J Digit Imaging. 2008 Mar;21(1):50–58. doi: 10.1007/s10278-007-9008-9. [DOI] [PMC free article] [PubMed] [Google Scholar]
- 4.Mansoori B, Novak RD, Sivit CJ, Ros PR. Utilization of dashboards technology in academic radiology departments: results of a national survey. J Am Coll Radiol. 2013 Apr;10(4):283–288. doi: 10.1016/j.jacr.2012.09.030. [DOI] [PubMed] [Google Scholar]
- 5.Karami M, Safdari R, Rahimi A. Effective radiology dashboardss: key research findings. Radiol Manage. 2013 Mar-Apr;35(2):42–45. [PubMed] [Google Scholar]
- 6.Park KW, Smaltz D, McFadden D, Souba W. The operating room dashboards. J Surg Res. 2010 Dec;164(2):294–300. doi: 10.1016/j.jss.2009.09.011. [DOI] [PubMed] [Google Scholar]
- 7.Stone-Griffith S, Englebright JD, Cheung D, Korwek KM, Perlin JB. Data-driven process and operational improvement in the emergency department: the ED Dashboards and Reporting Application. J Healthc Manag. 2012 May-Jun;57(3):167–180. [PubMed] [Google Scholar]
- 8.Koopman RJ, Kochendorfer KM, Moore JL, Mehr DR, Wakefield DS, Yadamsuren B, et al. A diabetes dashboards and physician efficiency and accuracy in accessing data needed for high-quality diabetes care. Ann Fam Med. 2011 Sep-Oct;9(5):398–405. doi: 10.1370/afm.1286. [DOI] [PMC free article] [PubMed] [Google Scholar]
- 9.Blais R, Champagne F, Rousseau L. TOCSIN: a proposed dashboards of indicators to control healthcare-associated infections. Healthc Q. 2009;12(Spec No Patient):161–167. doi: 10.12927/hcq.2009.20985. [DOI] [PubMed] [Google Scholar]
- 10.Karami M, editor. 28th Iranian congress of Radiology. Iran: Iranian Society of Radiology; 2012. Operational Radiology Dashboards: A Tool for Optimizing Workflow Management. [Google Scholar]
- 11.Ondategui-Parra S, Bhagwat JG, Zou KH, Nathanson E, Gill IE, Ros PR. Use of productivity and financial indicators for monitoring performance in academic radiology departments: U.S. nationwide survey. Radiology. 2005 Jul;236(1):214–219. doi: 10.1148/radiol.2361040456. [DOI] [PubMed] [Google Scholar]
- 12.Kruskal JB, Anderson S, Yam CS, Sosna J. Strategies for establishing a comprehensive quality and performance improvement program in a radiology department. Radiographics. 2009 Mar-Apr;29(2):315–329. doi: 10.1148/rg.292085090. [DOI] [PubMed] [Google Scholar]
- 13.Kruskal JB, Reedy A, Pascal L, Rosen MP, Boiselle PM. Quality initiatives: learn approach to improving performance and efficiency in a radiology department. Radiographics. 2012 Mar-Apr;32(2):573–587. doi: 10.1148/rg.322115128. [DOI] [PubMed] [Google Scholar]
- 14.Yaghoubi N, Moloudi J, Haghi A. Relationship of organizational culture and organization intelligence in public organization. EMQR. 2010;1(1):8. [Google Scholar]
- 15.Randell R, Dowding D. Organisational influences on nurses’ use of clinical decision support systems. Int J Med Inform. 2010 Jun;79(6):10. doi: 10.1016/j.ijmedinf.2010.02.003. [DOI] [PubMed] [Google Scholar]
- 16.Hardee S. Magnet hospitals and benchmarking: The Perioperative dashboards. SSM. 2003;9(3):13–17. [Google Scholar]
- 17.Serb C. Effective dashboardss. What to measure and how to show it. Hosp Health Netw. 2011 Jun;85(6):8–40. [PubMed] [Google Scholar]
- 18.Morgan MB, Branstetter BFt, Mates J, Chang PJ. Flying blind: using a digital dashboards to navigate a complex PACS environment. J Digit Imaging. 2006 Mar;19(1):69–75. doi: 10.1007/s10278-005-8732-2. [DOI] [PMC free article] [PubMed] [Google Scholar]
- 19.McLeod B, Zaver F, Avery C, Martin DP, Wang D, Jessen K, et al. Matching capacity to demand: a regional dashboards reduces ambulance avoidance and improves accessibility of receiving hospitals. Acad Emerg Med. 2010 Dec;17(12):1383–1389. doi: 10.1111/j.1553-2712.2010.00928.x. [DOI] [PubMed] [Google Scholar]
- 20.Cheng CK, Ip DK, Cowling BJ, Ho LM, Leung GM, Lau EH. Digital dashboards design using multiple data streams for disease surveillance with influenza surveillance as an example. J Med Internet Res. 2011;13(4):e85. doi: 10.2196/jmir.1658. [DOI] [PMC free article] [PubMed] [Google Scholar]
- 21.Waitman LR, Phillips IE, McCoy AB, Danciu I, Halpenny RM, Nelsen CL, et al. Adopting Real-Time Surveillance Dashboardss as a Component of an Enterprisewide Medication Safety Strategy. The Joint Commission Journal on Quality and Patient Safety. 2011;37(7):326–332. doi: 10.1016/s1553-7250(11)37041-9. [DOI] [PubMed] [Google Scholar]
- 22.Cleverley WO. Financial dashboards reporting for the hospital industry. J Health Care Finance. 2001 Spring;27(3):30–40. [PubMed] [Google Scholar]
- 23.Wadsworth T, Graves B, Glass S, Harrison A, Donovan C, Proctor A. using business intelligence to improve performance. Healthcare Financial Management. 2009;63:68–78. [PubMed] [Google Scholar]
- 24.Bannon E. Clinical Dashboards. Hospitals & Health Networks. 2005;79(10):16–8. [PubMed] [Google Scholar]
- 25.Loeb BB. A dashboards for medical staff goals. Trustee. 2010 Mar;63(3):35–36. [PubMed] [Google Scholar]
- 26.Clarke S. Your business dashboards: Knowing when to change the oil. Journal of Corporate Accounting & Finance. 2005;16(2):51–54. [Google Scholar]
- 27.Hoekzema G, Abercrombie S, Carr S, Gravel JW, Jr, Hall KL, Kozakowski S, et al. Residency “dashboards”: family medicine GME's step towards transparency and accountability? Ann Fam Med. 2010 Sep-Oct;8(5):470. doi: 10.1370/afm.1181. [DOI] [PMC free article] [PubMed] [Google Scholar]
- 28.Barta RA. Dashboardss: a required business management tool. Biomed Instrum Technol. 2010 May-Jun;44(3):228–230. doi: 10.2345/0899-8205-44.3.228. [DOI] [PubMed] [Google Scholar]
- 29.Mick J. Data-driven decision making: a nursing research and evidence-based practice dashboards. J Nurs Adm. 2011 Oct;41(10):391–393. doi: 10.1097/NNA.0b013e31822edb8c. [DOI] [PubMed] [Google Scholar]
- 30.Frith KH, Anderson F, Sewell JP. Assessing and selecting data for a nursing services dashboards. J Nurs Adm. 2010 Jan;40(1):10–16. doi: 10.1097/NNA.0b013e3181c47d45. [DOI] [PubMed] [Google Scholar]
- 31.Aydin CE, Bolton LB, Donaldson N, Brown DS, Mukerji A. Beyond Nursing Quality Measurement: The Nation's First Regional Nursing Virtual Dashboards Assessment. 2008 Aug; [PubMed] [Google Scholar]
- 32.Lindberg MC. Real-time analytics increase early discharges. Dashboards lowers cost per case, improves patient satisfaction and minimizes staff frustration. Health Manag Technol. 2011 May;32(5):24–25. [PubMed] [Google Scholar]
- 33.Nagy PG, Warnock MJ, Daly M, Toland C, Meenan CD, Mezrich RS. Informatics in radiology: automated Web-based graphical dashboards for radiology operational business intelligence. Radiographics. 2009 Nov;29(7):1897–1906. doi: 10.1148/rg.297095701. [DOI] [PubMed] [Google Scholar]
- 34.Maya Olsha-Yehiav JSE, Eunice Jung, Jeffrey A, Linder, Julie Greim RN, Qi Li, Jeffrey L, Schnipper, Blackford Middleton., editors. Quality Dashboardss: Technical and Architectural Considerations of an Actionable Reporting Tool for Population Management. AMIA. 2006:1052. Symposium Proceedings. [PMC free article] [PubMed] [Google Scholar]
- 35.Masum H, Singer PA. A visual dashboards for moving health technologies from “lab to village”. J Med Internet Res. 2007;9(4):e32. doi: 10.2196/jmir.9.4.e32. [DOI] [PMC free article] [PubMed] [Google Scholar]
- 36.Few S. first ed. Sebastopol, CA: O’Reilly Media; 2006. Information Dashboards Design: The Effective Visual Communication of Data. [Google Scholar]
- 37.Woodcock EW. Practice dashboards. Dermatology Times. 2006;27(1):70–77. [Google Scholar]