Abstract
AIM: To assess the regulatory effect of microRNA-185 (miR-185) on lipid metabolism and the insulin signalling pathway in human HepG2 hepatocytes and a high-fat diet mouse model.
METHODS: Quantitative reverse transcription-polymerase chain reaction was used to assess the mRNA levels of lipogenic genes after loss or gain of miR-185. In addition, the amounts of insulin signalling intermediates were determined after transfection of HepG2 cells with pre-miR-185.
RESULTS: MiR-185 levels decreased in a time- and dose-dependent manner in response to palmitic acid in human HepG2 hepatocytes. Transfection of HepG2 cells with miR-185 significantly decreased the mRNA levels of fatty acid synthase, 3-hydroxy-3-methylglutaryl-CoA reductase, sterol-regulatory element binding protein-2, and sterol-regulatory element binding protein-1c, whereas inhibition of miR-185 using an anti-miR-185 oligonucleotide produced the opposite effect in HepG2 cells. In a high-fat diet mouse model, the accumulation of lipids was significantly improved after treatment with miR-185, compared with control animals. Induction of miR-185 enhanced the insulin signalling pathway by up-regulating the insulin-receptor substrate-2.
CONCLUSION: These findings suggest that miR-185 plays an important role in regulating fatty-acid metabolism and cholesterol homeostasis in hepatocytes, as well as in improving insulin sensitivity, both in vitro and in vivo.
Keywords: MiR-185, Insulin signalling pathway, Lipid metabolism, Non-alcoholic fatty liver disease
Core tip: Our study presents important information on the pathogenesis of non-alcoholic fatty liver disease (NAFLD) and insulin resistance. We used a bioinformatics method to identify microRNAs potentially involved in the regulation of lipid metabolism and insulin signalling. We chose microRNA-185 (miR-185) to validate in vitro and in vivo in regard to regulation of lipid metabolism gene expression and blockade of the insulin signalling pathway. We found that overexpression of miR-185 improved insulin sensitivity and reduced liver steatosis in an NAFLD animal model. No previous studies have reported the regulatory effect of miR-185 on the insulin signalling pathway. MiR-185 might be useful in the design of therapeutic strategies for treating NAFLD and insulin resistance.
INTRODUCTION
Non-alcoholic fatty liver disease (NAFLD) is a complex metabolic disease characterised by accumulation of triglycerides and free cholesterol in the liver. This condition is caused by an imbalance in lipid metabolism pathways involved in triacylglycerol delivery, synthesis, export or oxidation[1]. Indeed, the liver plays a central role in modulating lipid metabolism and homeostasis, and a disruption of lipid metabolism and insulin signalling is frequently closely associated with NAFLD[2-4]. Therefore, identification of the regulators that control lipid metabolism and insulin resistance is critical.
We previously analysed microarray expression profiles in NAFLD and insulin resistance in an effort to identify such regulators, using samples from eight-week-old C57bl/6 mice fed a high-fat diet (HFD)[5] and hepatic c-Jun amino-terminal kinase 1 (JNK1) knockout DIO mice[6], respectively. From a pool of thousands of genes, we identified 21 genes that were co-differentially expressed in NAFLD and insulin resistance groups, compared with normal liver tissue, using significance analysis of microarray data (Wang, Zhan et al, unpublished data). TargetScan algorithms[7] (http://www.targetscan.org) were used to predict miRNAs potentially targeting the 21 co-differentially expressed genes. Ultimately, microRNA-185 (miR-185) was predicted to modulate seven of the 21 co-differentially expressed genes. The putative interactions between miR-185 and these genes indicate its potential impact on NAFLD pathogenesis and insulin resistance. However, the exact role of miR-185 in the regulation of lipid metabolism and the insulin signalling pathway is yet to be determined. In addition, the accuracy of the bioinformatics prediction needs to be experimentally confirmed.
Hepatic insulin resistance plays a fundamental role in both carbohydrate and lipid metabolism[8]. Indeed, insulin-mediated activation of insulin-receptor substrate (IRS) and Akt2 is indispensable for glucose and lipid metabolism[9]. Recent evidence has emerged that the phosphatidylinositide 3-kinase (PI3K)/Akt signalling pathway activates the sterol-regulatory element-binding proteins (SREBPs), which results in dramatic effects on lipogenic gene expression, inducing steatosis[10]. It has been shown that SREBP-1 activation contributes to fatty acid and lipid accumulation, while SREBP2 is mainly responsible for cholesterol metabolism[11,12]. Recently, Li et al[13] have confirmed the regulatory role of miR-185 in lipogenesis and cholesterogenesis through targeting SREBP1 and SREBP2 in prostate cancer cells.
To date, no report is available on the role of miR-185 in lipid metabolism and the insulin signalling pathway in mice and HepG2 cells. Therefore, this study aimed to characterize the effect of miR-185 on NAFLD and insulin resistance in vivo and in vitro.
We herein validated the regulatory effect of miR-185 on lipid metabolism and the insulin signalling pathway. Indeed, we demonstrated that miR-185 is actively involved in the regulation of lipid metabolism and insulin sensitivity, using both in vitro assays and a C57BL/6 mouse model of NAFLD. These findings further reveal the critical role of miR-185 in various cellular processes, and provide a basis for the use of this potent regulator in the design of novel and better molecular targets for the treatment of NALFD and, to some extent, diabetes.
MATERIALS AND METHODS
Culture and transfection of HepG2 cells
HepG2 cells were cultured in DMEM containing 10% foetal bovine serum, 1% of an antibiotic cocktail containing penicillin (10000 U/mL) and streptomycin (10000 μg/mL), 1% non-essential amino acid solution, 1% L-glutamine and 5.0 mmol/L glucose, in a humidified environment with 5% CO2 at 37 °C. MiR-185, control microRNA, anti-miR-185 and control antisense oligonucleotides (ASOs) were synthesized by RiboBio Co., Ltd. (Guangzhou, China); the oligonucleotides were transfected into HepG2 cells using the Lipofectin transfection reagent (Invitrogen, United States), according to the manufacturer’s instructions.
Animals and diets
The animal study was approved by the ethics committee of Harbin Medical University (Harbin, Heilongjiang, China) and experiments were conducted according to the National Institutes of Health guidelines for humane treatment of laboratory animals. Eight-week-old male C57Bl/6 mice were obtained from Harbin Medical University Laboratories (Harbin, Heilongjiang, China) and housed with a 12 h light/dark cycle, allowing free access to water and pellet chow. To assess miR-185 expression levels, C57BL/6 mice were divided into two groups, fed a normal laboratory diet and an HFD (30% fat, 15% protein, 45% carbohydrate, and 1.15% cholesterol), respectively, for 12 wk. At 4, 8 and 12 wk, liver tissues were harvested for quantitative reverse transcription-polymerase chain reaction (qRT-PCR) experiments respectively.
For miR-185 treatment, 20 eight-week-old male C57BL/6 mice were fed an HFD for 12 wk. Then, half of the mice (n = 10) were intravenously injected with 20 mg/kg miR-185 while the other half, used as controls (n = 10), were administered equal amounts of the control microRNA weekly for 8 wk. Mouse body weights were recorded weekly.
Quantitative real-time RT-PCR
To determine whether miR-185 acts as a regulator in lipid metabolism, we first quantitated alterations in miR-185 expression in response to palmitic acid (PA) stimulation. The HepG2 cells were treated with 1.0 × 10⁻⁴ or 5.0 × 10⁻⁴ mmol/L PA, and qRT-PCR was used to assess miR-185 levels after 24 h and 48 h of culture.
Total RNA was isolated from the liver tissue or cultured cells using a High Pure miRNA Isolation Kit (5080576001, ROCHE, Germany) according to the manufacturer’s instructions. Then cDNA was synthesized using a miRcute miRNA cDNA kit (KR201-01, Invitrogen, United States). qRT-PCR was performed on an Applied Biosystems 7900HT Sequence Detection System (Applied Biosystems, United States).
To assess mRNA levels of SREBP1, SREBP2, fatty acid synthase (FAS), and 3-hydroxy-3-methylglutaryl-CoA reductase (HMGCR), total RNA was extracted and purified using Trizol (Invitrogen, United States) and the RNeasy Mini kit (Qiagen), respectively, according to the manufacturers’ instructions. The purified RNA was treated with DNase I and reverse transcribed using the MMLV Reverse Transcriptase First Strand cDNA Synthesis Kit (Invitrogen, United States). All reactions were performed in triplicate, and RNU6-2 or β-actin was selected as an internal control for normalization. Relative fold changes in gene expression were determined by the 2−ΔΔCt method[14]. The primer sequences used for RT-PCR are listed in Table 1.
Table 1.
The primer sequences
| SREBP1 |
| 5'-ACC CCT GTG TTA GGC TAC CCC AGC CCT C-3' |
| 5'-TCT CCG CAT CTA CGA CCA GTG GGA CTG T-3' |
| 427 bp |
| SREBP2 |
| 5'-TCA AAC TCA GCT GCA ACA ACA GAC GGT A-3' |
| 5'-AAT GAT ATT ATG GGT TGT CCG CCT TTC T-3' |
| 592 bp |
| GAPDH |
| 5'-TGC CAA ATA TGA TGA CAT CAA GAA GGT G-3' |
| 5'-GTC ATA CCA GGA AAT GAG CTT GAC AAA G-3' |
| 190 bp |
| FAS |
| 5'-CTG GCT ACC TGA GCA TAG TGT GGA AGA C-3' |
| 5'-TGC AGT GTG TAC AGC TTC TGC CTG TGG G-3' |
| 544 bp |
| HMGCR |
| 5'-ACA ATA AGA TCT GTG GTT GGA ATT ATG A-3' |
| 5'-CCT AAA ATT GCC ATT CCA CGA GCA ATA T-3' |
| 376 bp |
SREBP1: Sterol-regulatory element-binding proteins-1; SREBP2: Sterol-regulatory element-binding proteins-2; GAPDH: Reduced glyceraldehyde-phosphate dehydrogenase; FAS: Fatty acid synthase; HMGCR: 3-hydroxy-3-methylglutaryl-CoA reductase.
Assessment of fatty acid oxidation and sterol synthesis rates in HepG2 cells
HepG2 cells were cultured in 12-well plates and transfected with miR-185 (20 nmol/L), anti–miR-185 (40 nmol/L), or negative controls (con-miR and con-anti-miR). After 48 h, the fatty acid oxidation rate was evaluated by quantifying the oxidation of [1-14C] oleate into 14CO2, as previously described (Yu et al, 1997). The sterol synthesis rate was estimated by measuring the amounts of [14C] acetate incorporated into cellular sterols, as described previously (Ettinger et al, 1994). Each experiment was performed in triplicate.
Western blot
Forty-eight hours after transfection, cells were washed in phosphate-buffered saline (PBS) and lysed with 300 μL RIPA lysis buffer (Solarbio, Beijing, China) containing a protease inhibitor mixture (Roche Applied Science, Germany). Proteins were resolved by SDS-PAGE and transferred onto PVDF membranes. The membranes were blocked with 5% non-fat dry milk and probed with primary antibodies raised against insulin receptor substrate (IRS) 1 (Abcam, United States), IRS-2 (Santa Cruz, United States), AKT2 (Santa Cruz, United States), PI3K (Santa Cruz, United States), and β-actin (Sigma, United States). After three washes with TBS-T, the membranes were incubated with appropriate horseradish peroxidase-conjugated secondary antibodies (Santa Cruz, United States). The signals were visualised with an ECL kit (GE Healthcare, CT, United States).
Evaluation of clinical chemistry parameters
Plasma concentrations of total cholesterol (CHOL), triglycerides (TG), and alanine aminotransferase (ALT) were determined after the last injection using spectrophotometric assay kits (Sigma-Aldrich, St. Louis, MO, United States) according to the manufacturer’s instructions.
Intraperitoneal insulin tolerance test
Mice were submitted to 8 h fasting and administered insulin by intraperitoneal injection. Then, plasma insulin levels were measured by ELISA and blood glucose levels (in tail vein blood) were assessed at 0, 15, 30, 60, and 120 min after insulin (1.0 U/kg body weight) treatment using a blood glucose meter (One Touch Ultra, Lifescan, United States) according to the manufacturer’s instructions.
Histological analysis
To evaluate the effect of miR-185 on hepatic steatosis, liver tissues were harvested from mice after the last injection of miR-185, fixed in 10% formalin solution, and embedded in paraffin. The sections were stained with hematoxylin and eosin according to standard protocols.
Statistical analysis
Statistical analyses were carried out using SPSS statistical software version 12.0 (SPSS Inc., Chicago, IL, United States). Data are expressed as mean ± SD. Student’s t-test and one way analysis of variance (ANOVA) were used to compare the differences between two or among more than two groups, respectively. P < 0.05 and P < 0.01 were considered statistically significant and highly significant, respectively.
RESULTS
MiR-185 expression is regulated by palmitic acid in HepG2 cells
In the presence of palmitic acid, miR-185 expression levels decreased by approximately 20% and approximately 35% after treatment with 1.0 × 10⁻⁴ mmol/L PA (P < 0 .01) and 5.0 × 10⁻⁴ mmol/L PA (P < 0.05), respectively, after 24-h incubation compared with control cells (Figure 1A). This effect was increased after 48-h incubation, with miR-185 expression decreasing by approximately 42% (1.0 × 10⁻⁴ mmol/L PA, P < 0.01) and 60% (5.0 × 10⁻⁴ mmol/L PA, P < 0.05) compared with the control group (Figure 1B). These data suggested that miR-185 expression levels decreased in a time- and dose-dependent manner in response to PA in HepG2 cells.
Figure 1.
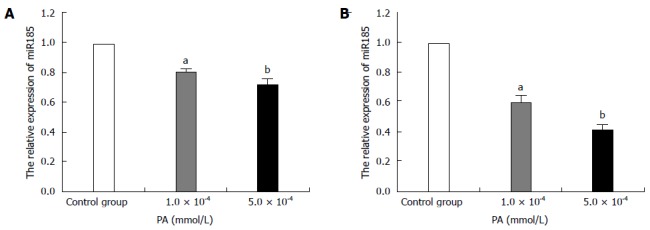
MicroRNA-185 expression levels in palmitic acid-treated HepG2 cells. HepG2 cells were treated with 1.0 × 10⁻⁴ or 5.0 × 10⁻⁴ mmol/L PA; qRT-PCR detected microRNA-185 (miR-185) levels after 24-h (A) or 48-h (B) incubation. RNU6-2 was used as an internal control for miR-185. Data are mean ± SEM from three separate experiments. aP < 0.05, bP < 0.01 vs the normal control group. PA: Palmitic acid; qRT-PCR: Quantitative reverse transcription-polymerase chain reaction.
Effect of miR-185 on lipid metabolism in HepG2 cells
To evaluate the modulatory effect of miR-185 on lipid metabolism, HepG2 cells were transfected with pre-miR-185 or anti-miR-185, and fatty acid oxidation and sterol synthesis rates were determined. Compared with control cells, HepG2 cells overexpressing miR-185 displayed a stark decrease in the sterol synthesis rate of approximately 30% (P < 0.01; Figure 2A) and an increased fatty acid oxidation rate (1.9-fold, P < 0.01; Figure 2B). Inhibition of miR-185 by anti-miR-185 resulted in a 2.2-fold increase in the sterol synthesis rate (P < 0.01, Figure 2C) and approximately 38% decrease in the fatty acid oxidation rates (P < 0.01, Figure 2D) compared with controls.
Figure 2.
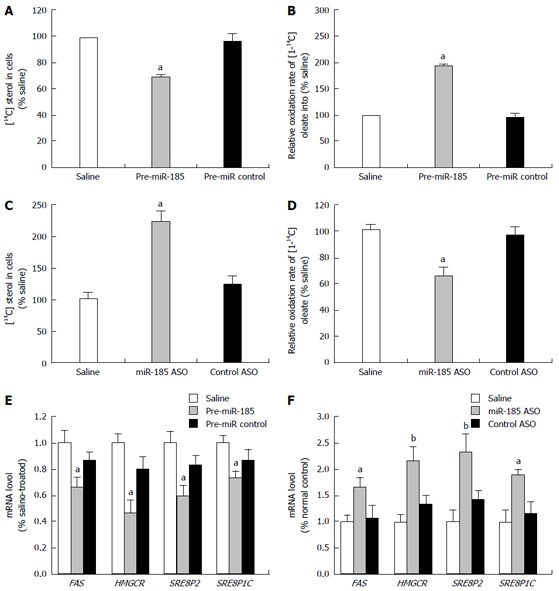
Effect of miR-185 on lipid metabolism in HepG2 cells. HepG2 cells were transfected with pre-miR-185 or anti-miR-185 (an antisense oligonucleotide against miR-185), and fatty acid oxidation and sterol synthesis rates were determined. A: The sterol synthesis rate was determined by the amount of [14C] acetate incorporated into HepG2 cell sterols after transfection with pre-miR-185; B: The fatty acid oxidation rate was measured by the oxidation of [1-14C] oleate into 14CO2 after transfection with pre-miR-185; C: Sterol synthesis rates in HepG2 cells after transfection with miR-185 inhibitors; D: Fatty acid oxidation rates in HepG2 cells after transfection with miR-185 inhibitors; E: Quantitative reverse transcription-PCR was used to assess the mRNA levels of key lipid metabolism-associated genes in HepG2 cells after overexpression of miR-185; F: mRNA levels of lipid metabolism-associated genes after miR-185 inhibition. Data are mean ± SEM from three separate experiments. aP < 0.05, bP < 0.01 vs the normal control group. miR-185: microRNA-185; ASO: Antisense oligonucleotide; SREBP-1C: Sterol-regulatory element-binding proteins 1C; SREBP-2: Sterol-regulatory element-binding proteins 2; HMGCR: 3-hydroxy-3-methylglutaryl-CoA reductase.
Since multiple studies have shown that FAS, HMGCR, SREBP2, and SREBP1c are strongly associated with lipid metabolism, the effect of miR-185 on these lipid metabolism-associated genes was assessed. Gene expression levels of FAS, HMGCR, SREBP2, and SREBP1c were measured after induction or inhibition of miR-185. qRT-PCR data revealed dramatically reduced expression of FAS, HMGCR, SREBP2, and SREBP1c after miR-185 overexpression in HepG2 cells (Figure 2E). Conversely, inhibition of miR-185 in HepG2 cells resulted in increased FAS, HMGCR, SREBP2, and SREBP1c mRNA levels (Figure 2F). These findings indicated that miR-185 regulates fatty acid metabolism and cholesterol homeostasis by suppressing the expression of lipogenic genes in hepatocytes.
Effect of a high fat diet on miR-185 expression in C57BL/6J mice
The in vitro data described above prompted us to further investigate the role of miR-185 in regulating lipid metabolism in vivo. C57BL/6J mice were fed a normal chow or a high fat diet for 12 wk, and liver tissues were harvested after sacrifice at weeks 4, 8, and 12 for qRT-PCR experiments. MiR-185 expression was decreased by approximately 22% at 8 wk (P < 0.01) and further declined (approximately 30%) at 12 wk (P < 0.01) compared with normal controls. In agreement with the in vitro data, miR-185 expression declined in the HFD group in a time-dependent manner (Figure 3).
Figure 3.
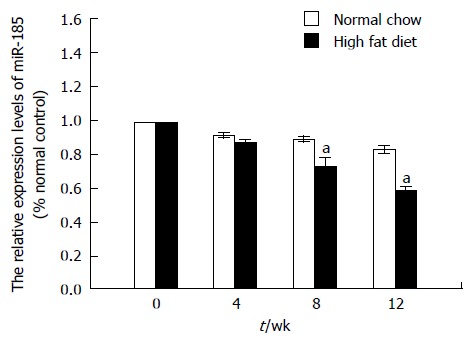
MicroRNA-185 expression levels in C57BL/6J mice fed a high fat diet. C57BL/6J mice were fed a normal chow or a high fat diet for 12 wk and liver tissues were harvested at 4, 8, and 12 wk. The miR-185 levels were determined by quantitative reverse transcription-PCR (n = 10). Data are mean ± SEM from three separate experiments. aP < 0.05 vs the normal control group. miR-185: microRNA-185.
Overexpression of miR-185 reduces liver steatosis and improves insulin sensitivity in vivo
To elucidate the regulatory effect of miR-185 on insulin sensitivity and lipid metabolism, c57BL/6 mice were fed a high-fat diet for 12 wk, then treated intraperitoneally weekly with miR-185 (20 mg/kg) for 8 wk. To determine insulin sensitivity, an ITT was performed after the last miR-185 administration. The results showed significantly lower plasma glucose concentrations in the HFD + miR-185 group compared with the HFD + con-miR group at all time points after injection of 1U/kg insulin (Figure 4A).
Figure 4.
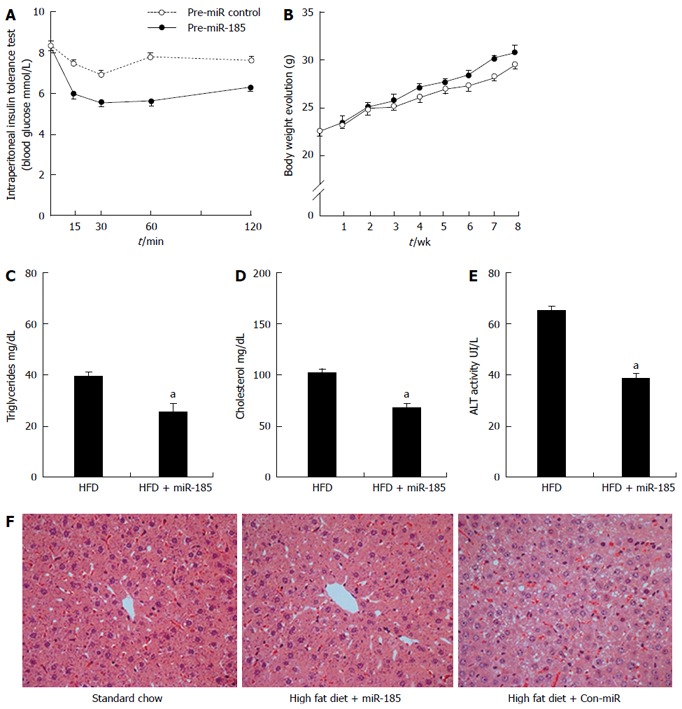
Overexpression of microRNA-185 improves insulin sensitivity and reduces liver steatosis. Eight-week-old male C57BL/6 mice were fed a high-fat diet for 12 wk. One half of the mice (n = 10) were injected with miR-185 (20 mg/kg body weight) and the control group (n = 10) received injections of control microRNA for 8 wk. A: ITT was performed after the last injection, and mice were submitted to 8 h fasting before intraperitoneal administration of insulin; B: Body weights were recorded weekly during the treatment period; C-E: Triglycerides, cholesterol and alanine aminotransferase levels were assessed after the last injection; F: At the end of the treatment, liver sections were stained by haematoxylin and eosin stain to assess lipid accumulation (magnification × 400). Where applicable, data are mean ± SEM from three separate experiments, n = 10, aP < 0.05 vs the normal control group. HFD: High-fat diet.
The effect of miR-185 overexpression on NAFLD was also assessed. After the 8-wk treatment regimen, no significant difference was observed between the HFD + con-miR and HFD + miR-185 groups in terms of mouse body weights (Figure 4B); TG, CHOL and ALT levels decreased after miR-185 treatment compared with the HFD + con-miR group (Figure 4C-E). In addition, HE staining showed enlarged cells with hepatocellular ballooning in the HFD + con-miR group. Finally, lipid accumulation decreased significantly after miR-185 treatment (Figure 4F). These data suggested that miR-185 overexpression alleviates liver fat content in C57BL/6 mice.
MiR-185 regulates the insulin signalling pathway in vitro
To explore whether miR-185 regulates the insulin signalling pathway, we assessed the expression of key pathway components (IRS-1, IRS-2, PI3K and Akt2) and the phosphorylation of Akt2 and PI3K after transfection of HepG2 cells with pre-miR-185. As shown in Figure 5A, IRS-2 expression was significantly elevated (3-fold) after miR-185 overexpression, whereas the expression levels of IRS-1, PI3K and Akt2 were unchanged. Moreover, both pPI3K and pAkt2 were markedly increased (Figure 5B), suggesting that miR-185 promotes the PI3K/Akt2 pathway by inducing IRS-2 expression rather than IRS-1.
Figure 5.
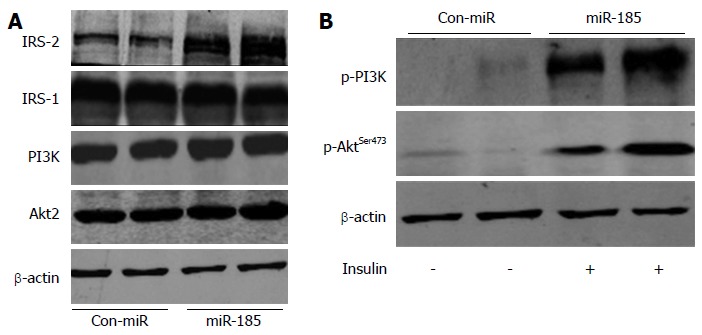
MicroRNA-185 regulates the insulin signalling pathway in HepG2 cells. A: The HepG2 cells were transfected with pre-miR-185 or pre-miR control and, after 48 h, the protein expression levels of insulin receptor substrate (IRS)-1, IRS-2, phosphatidylinositide 3-kinase (PI3K) and Akt2 were detected by Western blot; B: Effect of miR-185 on Akt2 and PI3K phosphorylation. miR-185: microRNA-185.
DISCUSSION
Insulin resistance is critical in the pathogenesis of NAFLD, and both pathologies are frequently present concurrently[15-17]. Our previous work has focused on the molecular interaction between NAFLD and insulin resistance. Although the pathogenesis of NAFLD is not entirely understood, the critical role of miRNAs as major regulators of fatty acid and cholesterol homeostasis deserves attention[18-21]. Indeed, single miRNAs could regulate complex disease processes by targeting the biological pathways of multiple proteinases and transcription factors; increasing evidence supports key roles for miRNAs in regulating lipid metabolism and insulin sensitivity, e.g., miR-33a and miR-33b target key enzymes involved in fatty acid oxidation[22]. In addition, miR-181d expression decreases triglyceride and cholesterol levels in cells[23]; miR-122 overexpression induces cholesterol and triglyceride biosynthesis in the adult liver[24]; and miR-126 affects insulin sensitivity in hepatocytes[25]. It has recently been reported that miR-185 regulates cholesterol metabolism by directly targeting the 3’-untranslated region (UTR) of hepatic scavenger receptor class B type I (SR-BI) and decreasing HDL uptake[26]. In our previous study using bioinformatics, miR-185 was predicted to be involved in the regulation of both NAFLD pathogenesis and insulin resistance (Wang, Zhan et al unpublished data).
Herein, we uncovered a potential role of miR-185 in the regulation of hepatic lipid metabolism, the development of NAFLD, and insulin resistance. Wang et al[26] have recently shown that miR-185 was decreased in liver tissues from ApoE knockout mice after 8 wk on a HFD. In accordance with our results, miR-185 expression declined in a time-dependent manner in C57BL/6J mice fed a HFD from the 8th week, and miR-185 expression levels decreased in a time- and dose-dependent manner in response to PA in HepG2 cells (Figure 6).
Figure 6.
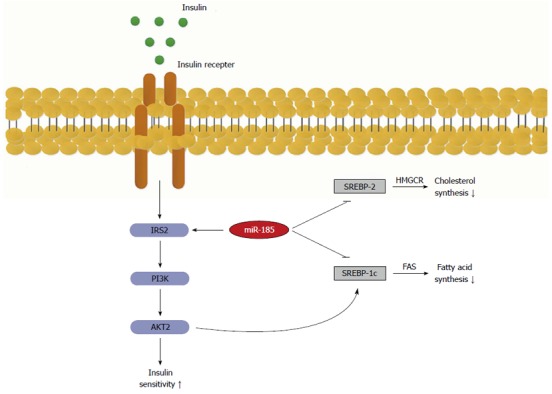
Role of microRNA-185 in the regulation of insulin signalling transduction and lipid metabolism. MicroRNA-185 up-regulates the key effector insulin receptor substrate-2 (IRS-2), which in turn activates the phosphatidylinositide 3-kinase/Akt2 signalling that increases insulin sensitivity. On the other hand, miR-185 represses SREBP-1c and 2, which ultimately results in decreased lipid synthesis. SREBP-1C: Sterol-regulatory element-binding proteins 1C; SREBP-2: Sterol-regulatory element-binding proteins 2; FAS: Fatty acid synthase.
These findings demonstrate that overexpression of miR-185 contributes to reduced fatty acid and cholesterol biosynthesis, which paralleled the observed decreases in mRNA levels of the fatty acid metabolism-related gene FAS and multiple cholesterol metabolism-related genes, including HMGCR, SREBP-2 and SREBP-1c. Inhibition of miR-185 in HepG2 cells caused elevated fatty acid and cholesterol biosynthesis, which was accompanied by increases in the mRNA levels of these key lipogenic genes. Similarly, Li et al[13] found that miR-185 inhibited fatty acid and cholesterol biosynthesis in prostate cancer cells, where it regulated SREBP-1 and SREBP-2 gene expression by directly binding their 3’-UTRs. In agreement with this, Yang et al[27] have demonstrated that miR-185 post-transcriptionally represses SREBP-2 expression. However, these authors found no significant alteration in HMGCR expression after treatment of HepG2 cells with miR185[27]. Such a discrepancy might result from differences in the experimental conditions between their study and ours.
SREBP-1 controls the genes involved in fatty acid biosynthesis, whereas SREBP-2 predominantly regulates cholesterol metabolism[28-31]. They often act as key regulators to induce the transcription of lipid-related genes, including FASN, FDFT1 and HMGCR, which results in an increase in fatty acid and cholesterol biosynthesis[32-35]. Our animal model provided strong evidence that miR-185 inhibits lipid metabolism. MiR-185 likely affects fatty acid and cholesterol metabolism in hepatic cells at least in part by inhibiting SREBP-1 and SREBP-2 mRNA expression.
Insulin resistance was markedly improved by miR-185. No previous studies have reported that miR-185 regulates the insulin-signalling pathway. Interestingly, Ryu et al[25] have demonstrated that miR-126 overexpression causes insulin resistance in hepatocytes through direct targeting of IRS-1 mRNA. Likewise, Karolina et al[36] found that miR-144 directly inhibits IRS1 at the mRNA and protein levels, and constitutes a critical component in insulin signalling. As shown above, miR-185 overexpression enhanced IRS-2 expression, and insulin stimulated its downstream kinases PI3K and Akt2 in hepatocytes. We found significantly improved insulin sensitivity after treatment of HFD animals with miR-185. Although miR-185 affected IRS-2 protein expression as shown above, it is unlikely that miR-185 directly regulates IRS-2, i.e., by interaction with the 3’-UTR of the gene, since IRS-2 is devoid of seed sequences for miR-185 binding. One possibility is that miR-185 targets other genes that in turn regulate IRS-2; this hypothesis merits further exploration.
We comprehensively describe the regulatory effect of miR-185 on lipid metabolism and insulin signalling in vivo and in vitro. Overall, our findings define additional functional relevance of miR-185 that might be useful in the design of therapeutic strategies for treating NAFLD and improving insulin resistance.
COMMENTS
Background
Lipid metabolism and the insulin signalling pathway are frequently closely associated with non-alcoholic fatty liver disease (NAFLD). Therefore, identification of the regulators that control lipid metabolism and insulin resistance is critical.
Research frontiers
No previous studies have reported that an microRNA co-regulated lipid metabolism and the insulin signalling pathway.
Innovations and breakthroughs
This is the first study to demonstrate that microRNA-185 (miR-185) regulates lipid metabolism and insulin signalling in vivo and in vitro.
Applications
Our findings define additional functional relevance of miR-185 that might be useful in the design of therapeutic strategies for treating NAFLD and improving insulin resistance.
Terminology
Insulin signalling pathways includes the phosphatidylinositide 3-kinase/Akt pathway and Ras/MAPK pathway. MicroRNAs are endogenous non-protein coding small RNA molecules (22 nucleotides in length) that negatively regulate target gene expression by suppressing the translation of specific mRNAs.
Peer review
This is a well-written paper with well thought out experiments, and each finding in this study may be worth reporting. The paper reports the significance of miR185 in the regulation of lipid metabolism gene expression and blockade of the insulin signalling pathway in vitro and in vivo.
Footnotes
Supported by National Natural Science Foundation of China, No. 30950005; and the Department of Education of Heilongjiang Province, No. 12511233
P- Reviewer: Kehagias DT, Rozzini R S- Editor: Yu J L- Editor: Wang TQ E- Editor: Wang CH
References
- 1.Yamaguchi K, Yang L, McCall S, Huang J, Yu XX, Pandey SK, Bhanot S, Monia BP, Li YX, Diehl AM. Inhibiting triglyceride synthesis improves hepatic steatosis but exacerbates liver damage and fibrosis in obese mice with nonalcoholic steatohepatitis. Hepatology. 2007;45:1366–1374. doi: 10.1002/hep.21655. [DOI] [PubMed] [Google Scholar]
- 2.Samuel VT, Liu ZX, Qu X, Elder BD, Bilz S, Befroy D, Romanelli AJ, Shulman GI. Mechanism of hepatic insulin resistance in non-alcoholic fatty liver disease. J Biol Chem. 2004;279:32345–32353. doi: 10.1074/jbc.M313478200. [DOI] [PubMed] [Google Scholar]
- 3.Birkenfeld AL, Shulman GI. Nonalcoholic fatty liver disease, hepatic insulin resistance, and type 2 diabetes. Hepatology. 2014;59:713–723. doi: 10.1002/hep.26672. [DOI] [PMC free article] [PubMed] [Google Scholar]
- 4.Weickert MO, Pfeiffer AF. Signalling mechanisms linking hepatic glucose and lipid metabolism. Diabetologia. 2006;49:1732–1741. doi: 10.1007/s00125-006-0295-3. [DOI] [PubMed] [Google Scholar]
- 5.Yang R, Wilcox DM, Haasch DL, Jung PM, Nguyen PT, Voorbach MJ, Doktor S, Brodjian S, Bush EN, Lin E, et al. Liver-specific knockdown of JNK1 up-regulates proliferator-activated receptor gamma coactivator 1 beta and increases plasma triglyceride despite reduced glucose and insulin levels in diet-induced obese mice. J Biol Chem. 2007;282:22765–22774. doi: 10.1074/jbc.M700790200. [DOI] [PubMed] [Google Scholar]
- 6.Duval C, Thissen U, Keshtkar S, Accart B, Stienstra R, Boekschoten MV, Roskams T, Kersten S, Müller M. Adipose tissue dysfunction signals progression of hepatic steatosis towards nonalcoholic steatohepatitis in C57BL/6 mice. Diabetes. 2010;59:3181–3191. doi: 10.2337/db10-0224. [DOI] [PMC free article] [PubMed] [Google Scholar]
- 7.Yang M, Eyers F, Xiang Y, Guo M, Young IG, Rosenberg HF, Foster PS. Expression profiling of differentiating eosinophils in bone marrow cultures predicts functional links between microRNAs and their target mRNAs. PLoS One. 2014;9:e97537. doi: 10.1371/journal.pone.0097537. [DOI] [PMC free article] [PubMed] [Google Scholar]
- 8.Matsumoto M, Han S, Kitamura T, Accili D. Dual role of transcription factor FoxO1 in controlling hepatic insulin sensitivity and lipid metabolism. J Clin Invest. 2006;116:2464–2472. doi: 10.1172/JCI27047. [DOI] [PMC free article] [PubMed] [Google Scholar]
- 9.Bouzakri K, Zachrisson A, Al-Khalili L, Zhang BB, Koistinen HA, Krook A, Zierath JR. siRNA-based gene silencing reveals specialized roles of IRS-1/Akt2 and IRS-2/Akt1 in glucose and lipid metabolism in human skeletal muscle. Cell Metab. 2006;4:89–96. doi: 10.1016/j.cmet.2006.04.008. [DOI] [PubMed] [Google Scholar]
- 10.Wan M, Leavens KF, Saleh D, Easton RM, Guertin DA, Peterson TR, Kaestner KH, Sabatini DM, Birnbaum MJ. Postprandial hepatic lipid metabolism requires signaling through Akt2 independent of the transcription factors FoxA2, FoxO1, and SREBP1c. Cell Metab. 2011;14:516–527. doi: 10.1016/j.cmet.2011.09.001. [DOI] [PMC free article] [PubMed] [Google Scholar]
- 11.Horton JD, Goldstein JL, Brown MS. SREBPs: activators of the complete program of cholesterol and fatty acid synthesis in the liver. J Clin Invest. 2002;109:1125–1131. doi: 10.1172/JCI15593. [DOI] [PMC free article] [PubMed] [Google Scholar]
- 12.Shimano H, Shimomura I, Hammer RE, Herz J, Goldstein JL, Brown MS, Horton JD. Elevated levels of SREBP-2 and cholesterol synthesis in livers of mice homozygous for a targeted disruption of the SREBP-1 gene. J Clin Invest. 1997;100:2115–2124. doi: 10.1172/JCI119746. [DOI] [PMC free article] [PubMed] [Google Scholar]
- 13.Li X, Chen YT, Josson S, Mukhopadhyay NK, Kim J, Freeman MR, Huang WC. MicroRNA-185 and 342 inhibit tumorigenicity and induce apoptosis through blockade of the SREBP metabolic pathway in prostate cancer cells. PLoS One. 2013;8:e70987. doi: 10.1371/journal.pone.0070987. [DOI] [PMC free article] [PubMed] [Google Scholar]
- 14.Livak KJ, Schmittgen TD. Analysis of relative gene expression data using real-time quantitative PCR and the 2(-Delta Delta C(T)) Method. Methods. 2001;25:402–408. doi: 10.1006/meth.2001.1262. [DOI] [PubMed] [Google Scholar]
- 15.Bugianesi E, Gastaldelli A, Vanni E, Gambino R, Cassader M, Baldi S, Ponti V, Pagano G, Ferrannini E, Rizzetto M. Insulin resistance in non-diabetic patients with non-alcoholic fatty liver disease: sites and mechanisms. Diabetologia. 2005;48:634–642. doi: 10.1007/s00125-005-1682-x. [DOI] [PubMed] [Google Scholar]
- 16.Bugianesi E, McCullough AJ, Marchesini G. Insulin resistance: a metabolic pathway to chronic liver disease. Hepatology. 2005;42:987–1000. doi: 10.1002/hep.20920. [DOI] [PubMed] [Google Scholar]
- 17.Sanyal AJ, Campbell-Sargent C, Mirshahi F, Rizzo WB, Contos MJ, Sterling RK, Luketic VA, Shiffman ML, Clore JN. Nonalcoholic steatohepatitis: association of insulin resistance and mitochondrial abnormalities. Gastroenterology. 2001;120:1183–1192. doi: 10.1053/gast.2001.23256. [DOI] [PubMed] [Google Scholar]
- 18.Yang WM, Jeong HJ, Park SY, Lee W. Induction of miR-29a by saturated fatty acids impairs insulin signaling and glucose uptake through translational repression of IRS-1 in myocytes. FEBS Lett. 2014;588:2170–2176. doi: 10.1016/j.febslet.2014.05.011. [DOI] [PubMed] [Google Scholar]
- 19.Jiang X, Yang L, Pang L, Chen L, Guo X, Ji C, Shi C, Ni Y. Expression of obesity-related miR-1908 in human adipocytes is regulated by adipokines, free fatty acids and hormones. Mol Med Rep. 2014;10:1164–1169. doi: 10.3892/mmr.2014.2297. [DOI] [PubMed] [Google Scholar]
- 20.Aranda JF, Madrigal-Matute J, Rotllan N, Fernández-Hernando C. MicroRNA modulation of lipid metabolism and oxidative stress in cardiometabolic diseases. Free Radic Biol Med. 2013;64:31–39. doi: 10.1016/j.freeradbiomed.2013.07.014. [DOI] [PMC free article] [PubMed] [Google Scholar]
- 21.Adlakha YK, Khanna S, Singh R, Singh VP, Agrawal A, Saini N. Pro-apoptotic miRNA-128-2 modulates ABCA1, ABCG1 and RXRα expression and cholesterol homeostasis. Cell Death Dis. 2013;4:e780. doi: 10.1038/cddis.2013.301. [DOI] [PMC free article] [PubMed] [Google Scholar]
- 22.Dávalos A, Goedeke L, Smibert P, Ramírez CM, Warrier NP, Andreo U, Cirera-Salinas D, Rayner K, Suresh U, Pastor-Pareja JC, et al. miR-33a/b contribute to the regulation of fatty acid metabolism and insulin signaling. Proc Natl Acad Sci United States. 2011;108:9232–9237. doi: 10.1073/pnas.1102281108. [DOI] [PMC free article] [PubMed] [Google Scholar]
- 23.Whittaker R, Loy PA, Sisman E, Suyama E, Aza-Blanc P, Ingermanson RS, Price JH, McDonough PM. Identification of MicroRNAs that control lipid droplet formation and growth in hepatocytes via high-content screening. J Biomol Screen. 2010;15:798–805. doi: 10.1177/1087057110374991. [DOI] [PubMed] [Google Scholar]
- 24.Krützfeldt J, Rajewsky N, Braich R, Rajeev KG, Tuschl T, Manoharan M, Stoffel M. Silencing of microRNAs in vivo with ‘antagomirs’. Nature. 2005;438:685–689. doi: 10.1038/nature04303. [DOI] [PubMed] [Google Scholar]
- 25.Ryu HS, Park SY, Ma D, Zhang J, Lee W. The induction of microRNA targeting IRS-1 is involved in the development of insulin resistance under conditions of mitochondrial dysfunction in hepatocytes. PLoS One. 2011;6:e17343. doi: 10.1371/journal.pone.0017343. [DOI] [PMC free article] [PubMed] [Google Scholar]
- 26.Wang L, Jia XJ, Jiang HJ, Du Y, Yang F, Si SY, Hong B. MicroRNAs 185, 96, and 223 repress selective high-density lipoprotein cholesterol uptake through posttranscriptional inhibition. Mol Cell Biol. 2013;33:1956–1964. doi: 10.1128/MCB.01580-12. [DOI] [PMC free article] [PubMed] [Google Scholar]
- 27.Yang M, Liu W, Pellicane C, Sahyoun C, Joseph BK, Gallo-Ebert C, Donigan M, Pandya D, Giordano C, Bata A, et al. Identification of miR-185 as a regulator of de novo cholesterol biosynthesis and low density lipoprotein uptake. J Lipid Res. 2014;55:226–238. doi: 10.1194/jlr.M041335. [DOI] [PMC free article] [PubMed] [Google Scholar]
- 28.Walker AK, Jacobs RL, Watts JL, Rottiers V, Jiang K, Finnegan DM, Shioda T, Hansen M, Yang F, Niebergall LJ, et al. A conserved SREBP-1/phosphatidylcholine feedback circuit regulates lipogenesis in metazoans. Cell. 2011;147:840–852. doi: 10.1016/j.cell.2011.09.045. [DOI] [PMC free article] [PubMed] [Google Scholar]
- 29.Horton JD, Bashmakov Y, Shimomura I, Shimano H. Regulation of sterol regulatory element binding proteins in livers of fasted and refed mice. Proc Natl Acad Sci United States. 1998;95:5987–5992. doi: 10.1073/pnas.95.11.5987. [DOI] [PMC free article] [PubMed] [Google Scholar]
- 30.Wang X, Sato R, Brown MS, Hua X, Goldstein JL. SREBP-1, a membrane-bound transcription factor released by sterol-regulated proteolysis. Cell. 1994;77:53–62. doi: 10.1016/0092-8674(94)90234-8. [DOI] [PubMed] [Google Scholar]
- 31.Hagen RM, Rodriguez-Cuenca S, Vidal-Puig A. An allostatic control of membrane lipid composition by SREBP1. FEBS Lett. 2010;584:2689–2698. doi: 10.1016/j.febslet.2010.04.004. [DOI] [PubMed] [Google Scholar]
- 32.Elhanati S, Kanfi Y, Varvak A, Roichman A, Carmel-Gross I, Barth S, Gibor G, Cohen HY. Multiple regulatory layers of SREBP1/2 by SIRT6. Cell Rep. 2013;4:905–912. doi: 10.1016/j.celrep.2013.08.006. [DOI] [PubMed] [Google Scholar]
- 33.Qiu C, Dongol S, Lv QT, Gao X, Jiang J. Sterol regulatory element-binding protein-1/fatty acid synthase involvement in proliferation inhibition and apoptosis promotion induced by progesterone in endometrial cancer. Int J Gynecol Cancer. 2013;23:1629–1634. doi: 10.1097/IGC.0000000000000004. [DOI] [PubMed] [Google Scholar]
- 34.Nakakuki M, Kawano H, Notsu T, Imada K, Mizuguchi K, Shimano H. A novel processing system of sterol regulatory element-binding protein-1c regulated by polyunsaturated fatty acid. J Biochem. 2014;155:301–313. doi: 10.1093/jb/mvu019. [DOI] [PubMed] [Google Scholar]
- 35.Wani S. Basic techniques in endoscopic ultrasound-guided fine-needle aspiration: Role of a stylet and suction. Endosc Ultrasound. 2014;3:17–21. doi: 10.4103/2303-9027.123008. [DOI] [PMC free article] [PubMed] [Google Scholar]
- 36.Karolina DS, Armugam A, Tavintharan S, Wong MT, Lim SC, Sum CF, Jeyaseelan K. MicroRNA 144 impairs insulin signaling by inhibiting the expression of insulin receptor substrate 1 in type 2 diabetes mellitus. PLoS One. 2011;6:e22839. doi: 10.1371/journal.pone.0022839. [DOI] [PMC free article] [PubMed] [Google Scholar]


