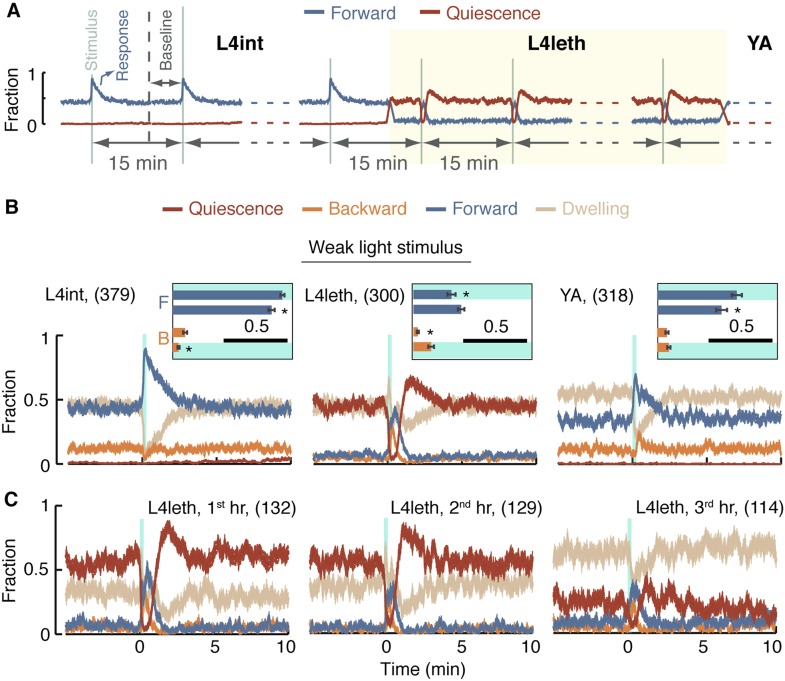
Figure 3. A posture-based analysis of locomotion responses to weak light stimuli.
(A) A diagram describing the repeated stimulus assay, in which a generic brief stimulus (vertical lines) was repeatedly delivered at 15 min intervals (long horizontal arrows). Each assay started at the mid L4int stage, continuously progressed through L4leth (shaded area), and ended at the mid YA stage. For the purpose of illustration, the blue and red lines symbolize tentative probabilities of forward locomotion and quiescence, respectively. Baseline behavior was measured during the 5-min period starting 10 min after a stimulus, or equivalently, 5 min prior to the subsequent stimulus. The beginning of the first baseline period is depicted by a dashed vertical line. (B) The fraction of forward locomotion, backward locomotion, dwelling, and quiescence before, during, and after a weak (15 s, 20 mW/cm2 blue light) stimulus provided at the L4int (left), L4leth (middle), and YA (right) stages. A compensatory post-stimulus enhancement of quiescence, as well as enhanced reversals during the stimulus, and a rising propensity for forward locomotion after the stimulus was turned off were uniquely observed during lethargus. Insets: the fraction of forward locomotion before and after the offset of the stimulus (top) and the fraction of backward locomotion before and after the onset of the stimulus. Shading denotes the presence of the light stimulus. All fractions were calculated from the 7.5-s period (half of the duration of the stimulus), the scale bars represent a fraction of 0.5, and asterisks denote p < 0.05. (C) The data from the middle panel of (B) plotted separately for the first, second, and third hours of L4leth. Enhanced quiescence was observed in all three cases, although it was less prominent during the third hour. Plots in panels (B, C) depict mean ± s.e.m and the number of stimuli assayed is noted in parentheses for each condition.


