

Abstract
Introduction
Acute effects of incidental cardiac irradiation in patients treated for thoracic cancer are not well characterized. We evaluated longitudinal changes in cardiac biomarkers for patients undergoing conformal radiation therapy (RT) with thoracic malignancies with high-dose cardiac exposure.
Methods
Twenty-five patients enrolled in a prospective trial (February 2009–December 2012) received ≥45 Gy to the thorax, with pretreatment estimates of ≥20 Gy to the heart. Chemotherapy was allowed except for doxorubicin or fluorouracil. Electrocardiographic (ECG), troponin-I (TnI), and brain natriuretic peptide (BNP) measurements were obtained before RT, within 24 hours of the first fraction, at the end of RT, and at first follow-up (1–2 months). These biomarkers were quantified at specific times and changes from baseline were evaluated with paired t tests.
Results
The median heart dose was 25.9 Gy (range 10.1–35.1 Gy). After the first RT fraction, no changes were noted in ECG or median Tnl or BNP levels; at the end of RT, two patients had elevated TnI and BNP, but neither difference was statistically significant. At first follow-up, TnI had returned to normal but the median BNP remained elevated (P=0.042). BNP did not increase over time in the 18 patients who received only RT. Twelve patients experienced acute ECG changes during RT, which resolved in seven patients by the next measurement. No patients experienced clinically significant RT-related events.
Conclusion
Increases in BNP and ECG changes were observed during high doses of radiation to the heart. The findings of this pilot study warrant further investigation and validation.
Keywords: cardiac toxicity, radiation therapy, lung cancer, brain natriuretic peptide
INTRODUCTION
Radiation therapy (RT) for cancer that involves the thorax sometimes involves unavoidable exposure of the heart to high radiation doses, even when advanced RT technologies are used. Although the long-term effects of low-dose cardiac exposure are relatively well known, the acute effects, if any, are not. Moreover, most prior studies have focused on the long-term effects of radiation amongst survivors of Hodgkin’s lymphoma or patients receiving radiation for left-sided breast cancer, and most involved exposure of large portions of the heart to low radiation doses.1–5 The conclusions from these studies cannot be extrapolated to patients being treated for thoracic malignancies such as lung cancer for several reasons. First, with the advent of increasingly conformal RT techniques, the dose distributions across the heart can differ substantially, with focal regions receiving high doses but other portions spared almost completely. Second, patients being treated for lung cancer often differ from those treated for breast cancer or Hodgkin’s lymphoma in that they tend to be older and to have underlying cardiopulmonary conditions such as coronary artery disease or chronic obstructive pulmonary disease. For these reasons, heart exposure for patients being treated for thoracic malignanices, with modern techniques, should be studied separately from that for patients with other forms of cancer.
The purpose of this study was to prospectively evaluate biomarkers of cardiac function among patients receiving high-dose conformal RT for thoracic malignancies. Specifically, we quantified brain natriuretic peptide (BNP) and troponin I (TnI) levels, and electrocardiographic (ECG) differences, before, during, and after RT, and we assessed whether cardiac dose was associated with changes in these values over time. We also documented clinical events to determine if the occurrence of such events correlated with changes in these biomarkers.
MATERIALS AND METHODS
Patient Selection
This study was approved by the appropriate institutional review board at The University of Texas MD Anderson Cancer Center. Patients were enrolled from 2/2009 – 12/2012. Inclusion criteria were having (1) a primary thoracic malignancy (lung cancer, esophageal cancer, thymoma, or malignant mesothelioma) and (2) an estimated mean cardiac dose of ≥20 Gy at treatment simulation (assessed by the treating physician). Our institution treats approximately 200 patients per year definitively for lung cancer, and as such the study was initially designed to include patients who received only RT. However, initially there were difficulties with enrollment because many patients who had a mean heart dose>20 Gy received chemotherapy or had other histologies (e.g. mesothelioma). At that point, in late 2011, the enrollment criteria were expanded to include patients with other histologies and patients treated with concurrent chemotherapy as long as the chemotherapy regimen did not include doxorubicin or fluorouracil owing to the potential cardiotoxicity of those drugs. Enrollment then increased substantially and the trial was closed in the next year. Exclusion criteria of the study were a recent (within 3 months) history of cardiac events (myocardial infarction, decompensated heart failure, or myocarditis/pericarditis) or renal failure (serum creatinine ≥2.0), or having a pulmonary embolus during the month before RT. Patients with a remote history of these events were not excluded because we sought to evaluate acute changes regardless of cardiac history.
Study Evaluations
All patients underwent a complete history and physical examination as well as ECG, BNP, and troponin level measurements before study entry. ECG measurements were obtained with 12-lead devices, and blood samples were drawn for BNP and TnI assessment after the first RT fraction, on the last day of radiation or chemoradiation, and at the first follow-up visit (1–2 months after completing RT). These measurement points were chosen to address the primary study aim, that is, determine if high radiation doses led to acute changes in these cardiac biomarkers or ECG findings; a future aim was to determine if such changes could be associated with subsequent longer-term events.
Heart Contouring
For all patients, the heart was contoured by using a model-based segmentation method that was then adjusted manually to ensure that the entire structure was encompassed. For the purposes of treatment planning, the heart was defined superiorly as directly inferior to the aortic arch through the apex, and included both atria and ventricles. The pericardium was also encompassed within the heart contour.
Cardiac Biomarkers
For the cardiac biomarker analysis, we chose to assess TnI because it is a more sensitive measure of myocardial injury than is creatine kinase-myocardial band (CK-MB) or troponin T (TnT). We chose to assess BNP as an indicator of left ventricular function and congestive heart failure.
TnI levels were measured with the Unicel Dxl Access Immunoassay System (Beckman Coulter, Brea, CA), in which concentrations of the analyte are determined from a stored, multipoint calibration curve. The detection limit of this assay for TnI is 0.03 ng/mL (normal range 0–0.03 ng/mL, reportable range 0.03–100 ng/mL). BNP was measured by using the Triage Method with a Beckman Coulter UniCel Dxl 600 Access Immunoassay system (normal range 0–100 pg/mL; reportable range 1–5000 pg/mL). The sensitivity, specificity, and negative predictive value of troponin for myocardial infarction has been shown in previous studies to be 85% or higher, while the positive predictive value ranges from 65% to almost 90%6, 7.
Blinded Analysis of Electrocardiograms
All ECGs were analyzed after acquisition by a cardiologist (WY) in a blinded manner for the following characteristics: normal ECG, sinus tachycardia/bradycardia, conduction abnormalities (e.g., bundle branch block, atrial fibrillation), and ischemic changes. Subsequent ECGs were then analyzed to determine if any acute changes had resolved.
Statistical Methods
Our primary objective was to investigate (1) the relationship between cardiac radiation dose and cardiac biomarker levels and (2) the temporal relationship between RT delivery and anticipated elevation of cardiac biomarkers. The distribution of BNPlevels was reported as baseline (i.e., before RT) and change over time. Paired t tests were used to assess whether BNP levels changed over time, specifically if the change in mean levels was different than 0. Repeated measures regression analysis was then used to determine the effect of heart dose and time since baseline on BNP level. Ninety-five percent confidence intervals (CIs) were determined for the mean change in BNP from baseline to day 1 of RT; to the end of RT; and to the first follow-up visit. Repeated measures regression analysis was used to assess the time since baseline on BNP level and to identify any statistically significant increases in BNP level over time. We also included an interaction term for MHD and time in our model to allow for the possibility that the effect of MHD on change in BNP varied with time. Because of the repeated measures analysis, we had 40 degrees of freedom for testing the interaction term and the term for time, since patients contribute data at each time point. Finally, we used the Spearman correlation to determine the correlation between mean heart radiation dose and change in BNP, both at the end of RT and at the 1–2 month follow-up period. These analyses were then repeated for the 18 patients who received only RT to identify trends without the potential confounding effect of chemotherapy.
A Bonferroni correction was used in the sample-size justification based on tests of the correlation between radiation dose and the change from baseline at three different time points for all patients and for patients who received RT alone, for a total of six tests. With 25 patients, we had 80% power to detect a correlation of 0.60 or greater, with a one-sided significance level of 0.008.
RESULTS
Patient Characteristics
Characteristics of the 25 patients enrolled in this study are listed in Table 1. Most patients (72%) were male and had received RT in conventionally fractionated regimens, with prescribed doses ranging from 45 to 50 Gy (to target microscopic disease after surgery) to 66 to 70 Gy as definitive RT. Most patients had preexisting cardiac conditions, primarily hypertension (52%) and hyperlipidemia (28%), with 48% of patients having more than one preexisting condition.
Table 1.
Patient Characteristics (n=25)
| Characteristic | Value or No. of Patients (% or Range) |
|---|---|
| Age at diagnosis, years | |
| Median (range) | 63 (31–75) |
| Sex | |
| Male | 18 (72) |
| Female | 7 (28) |
| Tumor Type | |
| Mesothelioma | 16 (64) |
| NSCLC | 5 (20) |
| Thymoma | 2 (8) |
| Other† | 2 (8) |
| Prescription Radiation Dose, Gy | |
| Median (range) | 50 (45–70) |
| Radiation Fraction Size, Gy | |
| Median (range) | 2 (1.8–3) |
| Cardiac Comorbid Conditions | |
| Hypertension | 13 (52) |
| Hyperlipidemia | 7 (28) |
| Diabetes mellitus | 6 (24) |
| Arrhythmia | 2 (8) |
| Myocardial infarction | 1 (4) |
| Mean Heart Dose, Gy | |
| Median (range) | 26.5 (10.1–35.1) |
| Heart Volume Receiving at least 40 Gy (V40), % | |
| Median (range) | 23.4 (0.63–43.26) |
| Mean Lung Dose, Gy | |
| Median (range) | 18.1 (6.6–21.7) |
| Concurrent Chemotherapy | |
| Yes | 7 (26) |
| No | 18 (72) |
Abbreviations: NSCLC, non-small cell lung cancer
Other histologies were small cell lung cancer, atypical carcinoid
Changes in Troponin I and Brain Natriuretic Peptide
All patients had undetectable TnI levels at baseline (before RT). Two of the 25 patients experienced increases in TnI levels during RT. One patient had a history of thymic carcinoma but no preexisting cardiac conditions and was treated with 66 Gy in 2-Gy fractions to the anterior mediastinum; the mean heart dose was 20.2 Gy and the V40 was 28%. This patient’s TnI level increased from undetectable (<0.03 ng/mL) before RT to 0.07 ng/mL at the end of RT, and had returned to an undetectable level at the first follow-up visit. The other patient had a history of hypertension and diabetes mellitus and received RT for malignant pleural mesothelioma to 60 Gy in 2.4-Gy fractions to the gross tumor volume. This patient also experienced an increase in TnI from undetectable before RT to 0.03 ng/mL at the end of RT, with TnI returning to undetectable levels at the first follow-up visit.
Because changes in BNP were found to not be correlated with mean heart dose on Day 1 (Spearman correlation r=0.15, P=0.51), at the end of RT (r=0.23, P=0.27), or at the first follow-up visit (r=0.18, P=0.46), we then examined BNP changes over time in an exploratory analysis. All patients had BNP measurements at the end of RT, and 19 of the 25 patients had BNP measurements at the first follow-up period. Changes in BNP over the course of treatment for the entire group are shown in Figures 1A and Table 2, with a tabulation of the correlation coefficients in Table 2. One patient had a greatly increased BNP level after one fraction (684 pg/mL) that then decreased and remained at approximately normal levels thereafter; that patient had received concurrent chemotherapy with cisplatin and etoposide.
Figure 1.
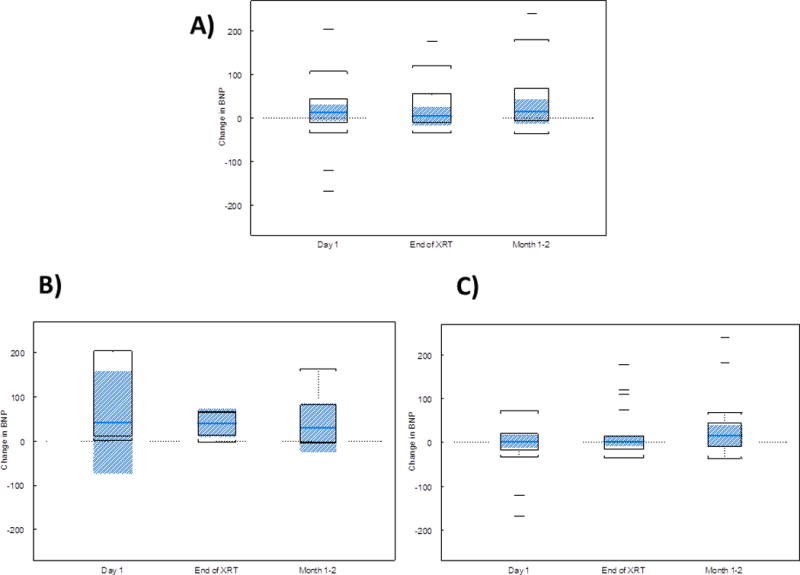
Change in the level of brain natriuretic peptide (BNP) with time in (A) all patients (n=25), (B) patients receiving concurrent chemoradiation (n=7), and (C) patients receiving only radiation therapy (n=18). The box represents the interquartile range (IQR), and the shaded region is a 95% CI for the median. The whiskers are drawn to the nearest value and not beyond 1.5 × IQR from the top (Quartile 3) or bottom (Quartile 1) of the box. Outliers are those values beyond the whiskers.
Table 2.
Correlation coefficients and p-values of changes of BNP with time after high dose cardiac radiation.
| All Patients | Patients with Radiation Only | Patients with Chemotherapy | ||||
|---|---|---|---|---|---|---|
| correlation | p-value1 | correlation | p-value1 | correlation | p-value1 | |
| Day 1 | 0.15 | 0.51 | 0.42 | 0.11 | −0.32 | 0.48 |
| End of RT | 0.23 | 0.27 | 0.40 | 0.10 | −0.32 | 0.48 |
| Month 1–2 | 0.18 | 0.46 | 0.20 | 0.51 | −0.14 | 0.79 |
RT=radiation therapy
p-values should be compared with a significance level of 0.0056 to account for multiple testing (p=0.05/9 = 0.0056).
Among the entire group, the mean change in BNP from baseline to the end of RT was statistically significant (95% CI 3.39 to 46.53, P=0.025), and the mean change in BNP from baseline to first follow-up was also statistically significant (95% CI 6.96 to 79.77, P=0.022). No difference was found in mean change in BNP from baseline to after one fraction of RT (95% CI −25.43 to 101.69, P=0.227). Repeated-measures regression analysis revealed no effect of mean heart dose (P=0.167) or time since baseline on change from baseline for BNP levels (P=0.104).
These analyses were then repeated for the 18 patients who did not receive concurrent chemotherapy. Again, neither mean heart dose (p=0.19) nor time since baseline (p=0.92) affected change from baseline in BNP level. Moreover, no interaction effect was found between mean heart dose and time since baseline. Changes in BNP levels over time for patients who received only RT are also shown in Table 3. Figure 1B and 1C, and Table 4 compare changes in BNP at different time points in those patients receiving chemoradiation (1B) and those receiving RT alone (1C). It is evident that the magnitude of changes was increased in those patients receiving chemotherapy, though the differences were not statistically significant (p>0.008 for all timepoints).
Table 3.
Brain natriuretic peptide levels (in pg/mL) at each study visit
| Measurement Time | No. of Patients | Mean | Standard Deviation | Minumum | Median | Maximum |
|---|---|---|---|---|---|---|
| All Patients | ||||||
| Baseline | 25 | 94.68 | 133.55 | 4.00 | 54.00 | 681.00 |
| Day 1 | 23 | 132.26 | 165.05 | 15.00 | 70.00 | 684.00 |
| End of RT | 25 | 119.64 | 165.21 | 16.00 | 95.00 | 858.00 |
| Month 1–2 | 19 | 139.84 | 176.33 | 10.00 | 68.00 | 726.00 |
| Patients Receiving only RT | ||||||
| Baseline | 18 | 120.22 | 150.21 | 12.00 | 100.50 | 681.00 |
| Day 1 | 16 | 113.81 | 125.33 | 18.00 | 83.00 | 512.00 |
| End of RT | 18 | 140.72 | 190.92 | 16.00 | 115.00 | 858.00 |
| Month 1–2 | 13 | 170.00 | 203.49 | 28.00 | 89.00 | 726.00 |
Abbreviation: RT, radiation therapy
Table 4.
Comparison of changes in brain natriuretic peptide (BNP) among those patients that received radiation therapy alone vs. those with chemoradiation. It is clear that the changes are always greater in the patients receiving chemotherapy, though not statistically significant, possibly secondary to small numbers of patients. The differences between the two groups are also more substantial during the earlier time periods.
| Mean Change in BNP | p-value of Means (Chemotherapy vs. RT Alone)1 | Median Change in BNP | p-value of Medians (Chemotherapy vs. RT Alone)1 | |
|---|---|---|---|---|
| Day 1 | RT alone: −8.81 | p=0.12 | RT alone: 2.5 | p=0.038 |
| ChemoRT: 145.43 | ChemoRT: 42.0 | |||
| End of RT | RT alone: 20.50 | p=0.51 | RT alone: 2.5 | P=0.12 |
| ChemoRT: 36.43 | ChemoRT: 41.0 | |||
| Month 1–2 | RT alone: 40.46 | p=0.81 | RT alone: 15.0 | p=0.47 |
| ChemoRT: 49.67 | ChemoRT: 30.0 |
RT=radiation therapy
p-values should be compared to 0.008 due to multiple testing (0.05/6 = 0.008).
Electrocardiogram Changes Associated with Radiation Therapy
Twelve patients were found to have changes in ECG readings after initiating RT (Table 5), with the two most common being T-wave changes and poor R-wave progression. The effects occurred at various times in relation to RT, and in seven of these 12 patients (58%), the ECG changes had resolved on subsequent studies and were asymptomatic. In no patient was intervention deemed to be required as a result of these ECG abnormalities.
Table 5.
Summary of electrocardiographic changes during and after radiation therapy
| Patient | Mean Heart Dose, Gy | Concurrent Chemotherapy | Measurement Time | Description of Change | Change Resolved on Next ECG |
|---|---|---|---|---|---|
| 1 | 20.3 | Yes | Follow-Up | Septal T-wave changes | Unknown* |
| 2 | 25.3 | No | After 1st Fraction | Septal T-wave changes | No |
| 3 | 34.1 | No | Follow-Up | Extensive T-wave changes | No |
| 4 | 35.1 | No | Follow-Up | Anterior/lateral T-wave changes | No |
| 5 | 28.4 | No | End of RT | Septal and lateral T-wave changes | No |
| 6 | 27.1 | Yes | End of RT | Prolonged QT interval | Yes |
| 7 | 30.1 | No | End of RT | Prolonged QT interval | Yes |
| 8 | 10.1 | No | End of RT | Septal ST changes | Yes |
| 9 | 29.7 | Yes | Follow-Up | Poor R-wave progression | Yes |
| 10 | 28.2 | No | After 1st Fraction | Poor R-wave progression | Yes |
| 11 | 18.0 | No | After 1st Fraction | Poor R-wave progression | Yes |
| 12 | 20.0 | No | After 1st Fraction / End of RT | Septal T-wave changes/ST Junction depression | Yes / No |
This patient did not undergo subsequent ECG testing.
Abbreviation: ECG, electrocardiogram; RT, radiation therapy.
Clinical Events Related to Radiation Therapy
No patient experienced a cardiac event related to RT at any time during the study.
DISCUSSION
In this prospective study of blood-based cardiac-function biomarkers and ECG changes among patients receiving high radiation doses to the heart from conformal techniques, our pertinent findings are as follows. First, most patients did not experience any discernible changes in TnI, either after exposure to a single fraction of RT or at longer term follow-up (at the end of RT, 1–2 months after the completion of RT). Second, we found a trend towards increased BNP at the end of RT and at the 1–2 month follow-up period relative to baseline levels. However, the quantitative changes from baseline were modest and were not associated with any clinically meaningful events. Further, we did not find an association between hear t dose and cardiac biomarkers, though acknowledging that all of the patients received relatively high heart doses in this analysis. Third, the correlation of BNP levels with time was substantially attenuated for patients receiving only RT, suggesting that concurrent chemotherapy increases any acute RT effects on the heart. Finally, slightly less than half of all patients had ECG changes at various times after RT, but most of these abnormalities were nonspecific, most had resolved upon subsequent evaluation, and none required intervention.
Although some studies have assessed short-term changes in cardiac biomarker levels after RT,8, 9 few have analyzed such changes after high-dose RT delivered via modern, highly conformal techniques. To our knowledge, the trial most similar to ours was conducted by investigators at Massachusetts General Hospital, who assessed the effect of RT on TnT, CK-MB, and aminoterminal pro-brain natriuretic peptide (NT-proBNP) levels in 30 patients who received either three-dimensional conformal therapy or intensity-modulated radiation therapy, most (24) with concurrent chemotherapy; 18 of these patients had lung cancer. Those investigators found that TnT remained undetectable in 29 patients, and none of the other biomarkers changed significantly after RT, with or without chemotherapy.10 However, that study differed from ours in that the cardiac RT doses were approximately half of those in the current study. Moreover, the minimum mean heart dose in the Mass General study was 0.6 Gy, and almost no patients received doses above 50 Gy (median V50=0%). At doses such as these, one could surmise that no changes in cardiac biomarkers were observed because the heart dose was insufficient to cause any differences, at least during the acute period.
Even with the substantially higher heart dose in the current study, our findings showed that troponin levels did not change in most patients. However, two patients in this study did have temporarily detectable TnI levels at the end of treatment. Cardiac troponin is a biomarker of cardiac injury that is undetectable in healthy subjects.11 However, even very small elevations in troponin levels can have important prognostic significance. For example, at least one study showed that patients with troponin levels exceeding >0.01 ng/mL had worse cardiac outcomes and significantly increased mortality compared with patients with troponin levels less than 0.01 ng/mL.12 Notably, the patients with small elevations in troponin in our study had no other risk factors that would precipitate a troponin leak. Therefore, these changes could represent a transient membrane leak from cardiac myocytes due to direct radiation damage. Alternatively, the leakage could be related to other factors, as has been observed in endurance athletes with elevated troponin levels but no evidence of myocardial necrosis on magnetic resonance imaging (MRI).13
We also found that high heart doses led to increases in BNP levels at the end of RT and at the first follow-up visit, again suggesting that the higher radiation dose used here led to more marked changes than previously reported for low-dose RT. The changes in BNP seem to have been more pronounced for patients who received chemotherapy. Interestingly, baseline BNP levels were also slightly elevated in this study, for reasons that are not apparent when examining the data. However, factors such as tachycardia can also increase BNP and were not assessed in this analysis. An increase in BNP level may represent direct myocyte inflammation and potential residual diastolic dysfunction related to RT. One patient receiving concurrent chemoradiation had a sharp increase in BNP after one RT fraction that quickly declined thereafter. The reason for this observation is unclear but could be related to temporary cardiac overload with the administration of chemotherapy. Prior analyses have shown that both small elevations in troponin and any elevation in BNP levels predict worse outcomes among patients with stable congestive heart failure.12 Although no large-scale trials have been published with long-term follow-up of biomarkers in patients receiving RT, increased BNP levels in patients with cancer have been linked with poor survival even in the absence of ventricular dysfunction or volume overload.14 Indeed, longer follow-up of the patients in the current study who experienced changes in biomarkers will determine the clinical relevance of short-term increases in such cases.
We also found that RT led to ECG changes in almost half of the patients in our trial. Although several studies have assessed the effect of systemic therapy regimens such as fluorouracil on cardiac rhythms,15 and the effect of RT on cardiac devices,16, 17 studies of high-dose RT and acute changes in ECG findings have been sparse and primarily limited to case reports.18 The most common alterations in ECG in the current study were septal T-wave changes and poor R-wave progression. Septal T-wave changes are nonspecific and can represent several acute and chronic processes, including electrolyte abnormalities, anemia, and pH changes, as well as acute cardiac processes such as myocarditis, pericarditis, cardiomyopathy, pulmonary emboli, and lung disease. The differential diagnosis of poor R-wave progression is also relatively broad, and includes body habitus, ventricular hypertrophy, and myocardial infarction.19 In addition, both of these changes can represent “normal variants,” although given the timing of these observations during and after RT, and the fact that most patients did not receive chemotherapy, it is reasonable to hypothesize that radiation to the heart caused these acute changes. We acknowledge that the overall clinical significance of acute changes in ECG patterns for patients receiving RT will need to be determined with longer term follow-up for the occurrence of subsequent clinical events.
This study did have limitations that constrain interpretation of the results. The primary limitations were the small number of patients and the inability to detect causality using this study design, which were functions of the pilot nature of this prospective analysis. Indeed, our goal was not to provide definitive conclusions regarding the effect of high-dose RT on cardiac biomarkers in thoracic malignancies, but rather to observe if short-term trends could be observed in the acute setting. A second restriction is the limited ability to detect increases in TnI and BNP levels, which was a function of the sensitivity of the assays used. However, one could argue that the utility of detecting smaller changes in these markers is low, given the lack of clear clinical significance of smaller elevations. Another limitation was that cardiac events may be difficult to assess in patients with lung cancer and mesothelioma because such patients may also have other cardiopulmonary comorbidities. However, because the incidence of cardiac events was so low, any influence of this confounding factor was likely minimal in this study. Fourth was our inclusion of a patient who turned out to have a smaller heart dose (10 Gy) than our intended minimum predicted during treatment planning (20 Gy). We ultimately chose to include this patient in the analysis because 10 Gy can be considered a moderate heart dose and because we wanted to maximize the amount of prospective data for analysis. We do not believe that including this patient had any major influence on our results or conclusions. We further included patients with a variety of tumor types, most notably mesothelioma. We are unaware of any findings suggesting that tumor histology would affect cardiac toxicity, and thus the rationale for including these patients was the presumption that acute cardiac changes in troponin and ECG would depend primarily on RT dose in patients receiving high doses. Notably, however, no patients with mesothelioma were given concurrent chemotherapy with the RT, the use of which seemed to have enhanced the cardiac changes observed in this study.
Finally, this study was designed with a short-term follow-up period and a limited range of doses, thus restricting the capacity to detect a dose response, because our focus was on acute changes that may be associated with high cardiac dose. A more complete clinical analysis would entail follow-up for at least 2 or 3 years and with an increased dose range; such a design presumably would reveal the impact of dose on both acute and late RT-related toxicity and thereby strengthen the associations observed in this analysis of acute effects. We are continuing to follow these patients and intend to pool the results of this study with those involving other patients with locally advanced disease to determine if further toxicity arises that warrants longer follow-up with these metrics.
In conclusion, this prospective analysis of acute changes in cardiac biomarkers and ECG findings in patients receiving high cardiac radiation doses revealed differences in BNP levels at the end of RT and at the first follow-up period. Nearly half of the patients studied also experienced ECG changes after RT, although these alterations may not be directly related to the RT. Finally, no patients experienced a clinically significant cardiac event, implying either that the vast majority of such events are subclinical, or that additional events could be identified in patients experiencing detectable variations in biomarkers with longer-term follow-up. This distinction should be answered in future studies that focus on cancer survivors who receive analogous dose distributions. Combining these studies with novel imaging techniques is also expected to help answer this question.
Acknowledgments
We sincerely thank Christine Wogan, MS, ELS, of MD Anderson’s Division of Radiation Oncology, for her work in reviewing and editing this manuscript.
Funding sources: Supported in part by Cancer Center Support (Core) Grant CA016672 to The University of Texas MD Anderson Cancer Center.
Footnotes
Financial disclosures: The authors declare no conflicts of interest in the preparation of this work.
References
- 1.Boivin JF, Hutchison GB, Lubin JH, Mauch P. Coronary artery disease mortality in patients treated for Hodgkin’s disease. Cancer. 1992;69:1241–1247. doi: 10.1002/cncr.2820690528. [DOI] [PubMed] [Google Scholar]
- 2.Clarke M, Collins R, Darby S, et al. Effects of radiotherapy and of differences in the extent of surgery for early breast cancer on local recurrence and 15-year survival: an overview of the randomised trials. Lancet. 2005;366:2087–2106. doi: 10.1016/S0140-6736(05)67887-7. [DOI] [PubMed] [Google Scholar]
- 3.Hancock SL, Tucker MA, Hoppe RT. Factors affecting late mortality from heart disease after treatment of Hodgkin’s disease. JAMA. 1993;270:1949–1955. [PubMed] [Google Scholar]
- 4.Lund MB, Ihlen H, Voss BM, et al. Increased risk of heart valve regurgitation after mediastinal radiation for Hodgkin’s disease: an echocardiographic study. Heart. 1996;75:591–595. doi: 10.1136/hrt.75.6.591. [DOI] [PMC free article] [PubMed] [Google Scholar]
- 5.Darby SC, Ewertz M, McGale P, et al. Risk of ischemic heart disease in women after radiotherapy for breast cancer. N Engl J Med. 2013;368:987–998. doi: 10.1056/NEJMoa1209825. [DOI] [PubMed] [Google Scholar]
- 6.Keller T, Zeller T, Peetz D, et al. Sensitive troponin I assay in early diagnosis of acute myocardial infarction. N Engl J Med. 2009;361:868–877. doi: 10.1056/NEJMoa0903515. [DOI] [PubMed] [Google Scholar]
- 7.Reichlin T, Irfan A, Twerenbold R, et al. Utility of absolute and relative changes in cardiac troponin concentrations in the early diagnosis of acute myocardial infarction. Circulation. 2011;124:136–145. doi: 10.1161/CIRCULATIONAHA.111.023937. [DOI] [PubMed] [Google Scholar]
- 8.D’Errico MP, Grimaldi L, Petruzzelli MF, et al. N-terminal pro-B-type natriuretic peptide plasma levels as a potential biomarker for cardiac damage after radiotherapy in patients with left-sided breast cancer. Int J Radiat Oncol Biol Phys. 2012;82:e239–246. doi: 10.1016/j.ijrobp.2011.03.058. [DOI] [PubMed] [Google Scholar]
- 9.Hughes-Davies L, Sacks D, Rescigno J, Howard S, Harris J. Serum cardiac troponin T levels during treatment of early-stage breast cancer. J Clin Oncol. 1995;13:2582–2584. doi: 10.1200/JCO.1995.13.10.2582. [DOI] [PubMed] [Google Scholar]
- 10.Kozak KR, Hong TS, Sluss PM, et al. Cardiac blood biomarkers in patients receiving thoracic (chemo)radiation. Lung Cancer. 2008;62:351–355. doi: 10.1016/j.lungcan.2008.03.024. [DOI] [PubMed] [Google Scholar]
- 11.Wallace TW, Abdullah SM, Drazner MH, et al. Prevalence and determinants of troponin T elevation in the general population. Circulation. 2006;113:1958–1965. doi: 10.1161/CIRCULATIONAHA.105.609974. [DOI] [PubMed] [Google Scholar]
- 12.Latini R, Masson S, Anand IS, et al. Prognostic value of very low plasma concentrations of troponin T in patients with stable chronic heart failure. Circulation. 2007;116:1242–1249. doi: 10.1161/CIRCULATIONAHA.106.655076. [DOI] [PubMed] [Google Scholar]
- 13.Scharhag J, Urhausen A, Schneider G, et al. Reproducibility and clinical significance of exercise-induced increases in cardiac troponins and N-terminal pro brain natriuretic peptide in endurance athletes. Eur J Cardiovasc Prev Rehabil. 2006;13:388–397. doi: 10.1097/01.hjr.0000219117.33038.90. [DOI] [PubMed] [Google Scholar]
- 14.Burjonroppa SC, Tong AT, Xiao LC, Johnson MM, Yusuf SW, Lenihan DJ. Cancer patients with markedly elevated B-type natriuretic peptide may not have volume overload. Am J Clin Oncol. 2007;30:287–293. doi: 10.1097/01.coc.0000256101.04404.b0. [DOI] [PubMed] [Google Scholar]
- 15.Saif MW, Shah MM, Shah AR. Fluoropyrimidine-associated cardiotoxicity: revisited. Expert Opin Drug Saf. 2009;8:191–202. doi: 10.1517/14740330902733961. [DOI] [PubMed] [Google Scholar]
- 16.Gomez DR, Poenisch F, Pinnix CC, et al. Malfunctions of implantable cardiac devices in patients receiving proton beam therapy: incidence and predictors. Int J Radiat Oncol Biol Phys. 2013;87:570–575. doi: 10.1016/j.ijrobp.2013.07.010. [DOI] [PMC free article] [PubMed] [Google Scholar]
- 17.Oshiro Y, Sugahara S, Noma M, et al. Proton beam therapy interference with implanted cardiac pacemakers. Int J Radiat Oncol Biol Phys. 2008;72:723–727. doi: 10.1016/j.ijrobp.2008.01.062. [DOI] [PubMed] [Google Scholar]
- 18.Vasic N, Stevic R, Pesut D, Jovanovic D. Acute left bundle branch block as a complication of brachytherapy for lung cancer. Respir Med. 2011;105(Suppl 1):S78–80. doi: 10.1016/S0954-6111(11)70016-6. [DOI] [PubMed] [Google Scholar]
- 19.MacKenzie R. Poor R-wave progression. J Insur Med. 2005;37:58–62. [PubMed] [Google Scholar]