

Abstract
Polyglutamine-expanded huntingtin, the protein encoded by HTT mutations associated with Huntington’s disease, forms aggregate species in vitro and in vivo. Elucidation of the mechanism of growth of fibrillar aggregates from soluble monomeric protein is critical to understanding the progression of Huntington’s disease and to designing therapeutics for the disease, as well as for aggregates implicated in Alzheimer’s and Parkinson’s diseases. We used the technique of multicolor single-molecule, super-resolution fluorescence imaging to characterize the growth of huntingtin exon 1 aggregates. The huntingtin exon 1 aggregation followed a pathway from exclusively spherical or globular species of ∼80 nm to fibers ∼1 μm in length that increased in width, but not length, over time with the addition of more huntingtin monomers. The fibers further aggregated with one another into aggregate assemblies of increasing size. Seeds created by sonication, which were comparable in shape and size to the globular species in the pathway, were observed to grow through multidirectional elongation into fibers, suggesting a mechanism for growth of globular species into fibers. The single-molecule sensitivity of our approach made it possible to characterize the aggregation pathway across a large range of size scales, from monomers to fiber assemblies, and revealed the coexistence of different aggregate species (globular species, fibers, fiber assemblies) even at late time points.
Huntington’s disease (HD) is a neurodegenerative disease caused by an expansion of the trinucleotide CAG repeat region in the HTT gene beyond 40 repeats.1,2 A hallmark of HD is the formation of protein aggregate deposits in the brains of affected individuals.2,3 The expanded polyglutamine tract in the mutant huntingtin (Htt) protein has been shown to result in misfolding and aggregation of the protein. There is growing evidence that both aggregate intermediates and mature aggregate fibers cause neuronal dysfunction and toxicity during HD pathogenesis.4−8 As a result, the aggregation pathways followed by misfolded disease proteins has been an active area of research with the goal of identifying therapeutic targets.
Although the detailed, mechanistic model of mutant Htt aggregation is not well-understood, a general, nucleated growth model of Htt exon 1 aggregation has emerged in the literature that accounts for the nonfibrillar globular structures and fibers observed by AFM and EM.9−14 Natively unfolded Htt monomers associate with one another, mediated either by an amphipathic helix13,14 formed by the 17 amino acids N-terminal to the polyQ region of Htt (N17)13−17 or stochastic adoption of a β-sheet conformation by the polyQ region,9,10 to form the initial small oligomeric species. In the case of the mechanism starting with N17 helix association, the polyQ β-sheet transition happens within the oligomeric species. The oligomers grow into spheroid (or globular) species.9 The globular species then associate or grow through further Htt addition to form small fibrils or “protofibrils.” Mature fibers are hypothesized to be the result of association of fibrils with one another in a length-wise fashion or through further addition of monomers/oligomers.9,11 The multiple possibilities for growth mechanisms between the various potential structures provide key challenges for the field, especially in light of the possibility that several pathways exist for aggregation that may be in equilibrium with one another.11
An important question concerning Htt aggregation has been whether the in vitro aggregates formed by purified polyQ-expanded Htt peptides are also found in vivo. Evidence that the globular and elongated fibrillar Htt aggregates observed in vitro are also found in vivo include the Htt granules and fibrils identified in the post-mortem brain tissue of HD patients.3 Aggregate fibrils isolated from COS-1 cells transfected with Htt-exon1-Q51 showed morphology and antihuntingtin antibody reactivity similar to in vitro aggregates prepared from purified Htt-exon1-Q51 protein.18 In a detailed recent study, the aggregates formed in the brains of two HD mouse models, R6/2 and HdhQ150, were compared to each other and to in vitro aggregates.19 On the basis of immuno-EM and AFM imaging, the authors concluded that the range of aggregates observed was similar and that the oligomeric, “proto-fibrillar,” and fibrillar species had similar morphologies. Aggregates in the post-mortem brain tissue of HD patients (similar to those in ref (3)) were compared directly to in vitro-produced Htt-exon1-Q46 and Q53 aggregates imaged by AFM.11 The authors concluded that the dimensions and morphologies were similar, noting in particular the presence of oligomeric species both in vitro and in vivo.
Although there is similarity in the morphologies of aggregates identified in vitro and in vivo, it is important to note that the crowded cellular environment affects Htt aggregate species and the aggregation pathway itself in vivo. Htt has been shown to interact with and disrupt the function of important proteins in the cell.6 Several critical members of the cellular protein quality control system, such as chaperones and components of the ubiquitin-proteasome system, have been found in inclusion bodies with mutant Htt.20,21 Molecular chaperones and chaperonins have also been found to modulate the aggregation and toxicity of the proteins implicated in Huntington’s, Alzheimer’s, and Parkinson’s diseases;6,21 for example, the chaperonin TRiC inhibits Htt exon 1 aggregation in vitro and in vivo.22−24 However, the specific types of aggregate species targeted by the different chaperones is still under investigation.
Fluorescence imaging is an advantageous way to study the highly sensitive aggregation pathway of polyQ-expanded Htt compared to AFM and EM because it is relatively nonperturbative, reports on specifically labeled objects, and excels at measuring large fields of view in aqueous environments. Fluorophores available in many spectral ranges also make it possible to distinguish different populations of proteins using multicolor labeling. The growth of yeast prion,25,26 β2-microglobulin,27 glucagon,28 and amyloid β-peptide28−30 fibrils have been studied using diffraction-limited fluorescence imaging. Single-molecule, super-resolution (SR) fluorescence imaging using controllably blinking fluorescent molecules and precise localization algorithms31,32 has enabled the characterization of disease aggregates at high resolution (10–50 nm). We previously demonstrated the excellent correspondence between SR images of Htt fibrillar aggregates and AFM topography maps of the same aggregates.33 We also extended our SR exploration to Htt aggregates formed in cells, finding similar fibrillar Htt aggregates in coexistence with large inclusion bodies;34 a recent study reported on the distinct characteristics of fibrillar and globular Htt inclusions using a combination of structured illumination microscopy (SIM), FRET, and FRAP.35 The structure and growth of amyloid-β36 and α-synuclein37−39 aggregates has also been studied by SR fluorescence, yielding new details of the growth of these fibers. Another subdiffraction technique, near-field scanning optical microscopy (NSOM), was used to collect fluorescence and AFM data simultaneously from β2-microglobulin aggregates with a resolution of ∼75 nm.40 Htt aggregates especially require the increased resolution of SR analysis because of their short, compact, broom-like morphologies,9,18,33,41 in contrast to the long fibers formed principally through linear growth by other amyloidogenic proteins.
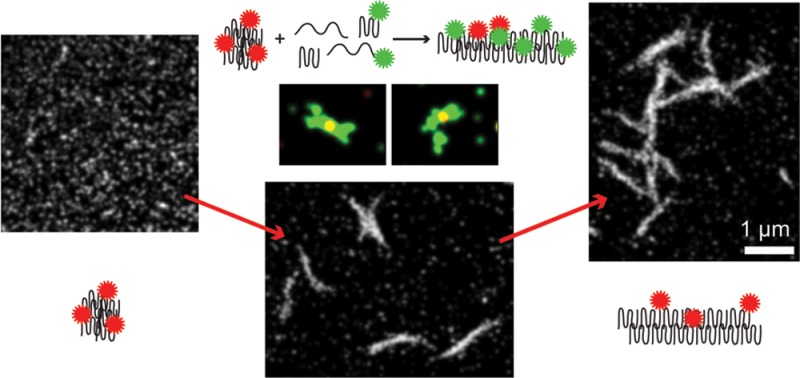
To characterize the morphologies of Htt exon 1 aggregate species over time and study the fibrillation pathway with spatial resolution beyond the optical diffraction limit of ∼200 nm, we used direct stochastic optical reconstruction microscopy (dSTORM).42,43 We found that the Htt exon 1 monomers aggregated into ∼80 nm globular species that then grew into ∼1 μm long and ∼100–140 nm thick fibers. These fibers grew in width rather than length over time from the addition of more Htt protein, and the individual fibers aggregated with one another into large assemblies. Two-color pulse-chase SR imaging indicated that the growth of seeds from monomer addition was multidirectional. Our findings demonstrate the power and sensitivity of SR imaging for elucidating details of aggregate growth from individual protein monomers to large fiber assemblies.
Results and Discussion
Preparation of Fluorescently-Labeled Huntingtin Aggregates
We selected exon 1 of Htt with a 44 glutamine repeat tract for our studies. The exon 1 of Htt has been used extensively in vitro and in vivo to study Htt aggregation and toxicity because N-terminal cleavage fragments of the full-length protein likely play an important role in pathogenesis in neurons;2 Htt exon 1 causes disease progression in transgenic mice,44 and N-terminal Htt fragments have been found to be a large component of neuronal inclusion bodies.3 The Htt exon 1 construct, MBP-HttQ44-exon1-S112C-histag, contained the solubilizing maltose-binding protein (MBP) moiety fused to Htt exon 1, a single cysteine mutation near the C-terminus (position 112 as counted from the beginning of exon 1 with Q44) for fluorophore labeling with Alexa Fluor 647 (AX647) maleimide, and a C-terminal His6-tag for purification (Figure 1a and Supporting Information Figure S1).14,33 Aggregation was initiated by proteolytic cleavage of the MBP from the Htt using the Factor Xa protease (Supporting Information Figure S3). Abbreviations used in this article for the construct MBP-HttQ44-exon1-S112C-histag, fluorescently labeled construct MBP-HttQ44-exon1-S112C(AX647)-histag, and cleaved construct HttQ44-exon1-S112C-histag are MBP-Htt-ex1, MBP-Htt-ex1-AX647, and Htt-ex1, respectively.
Figure 1.
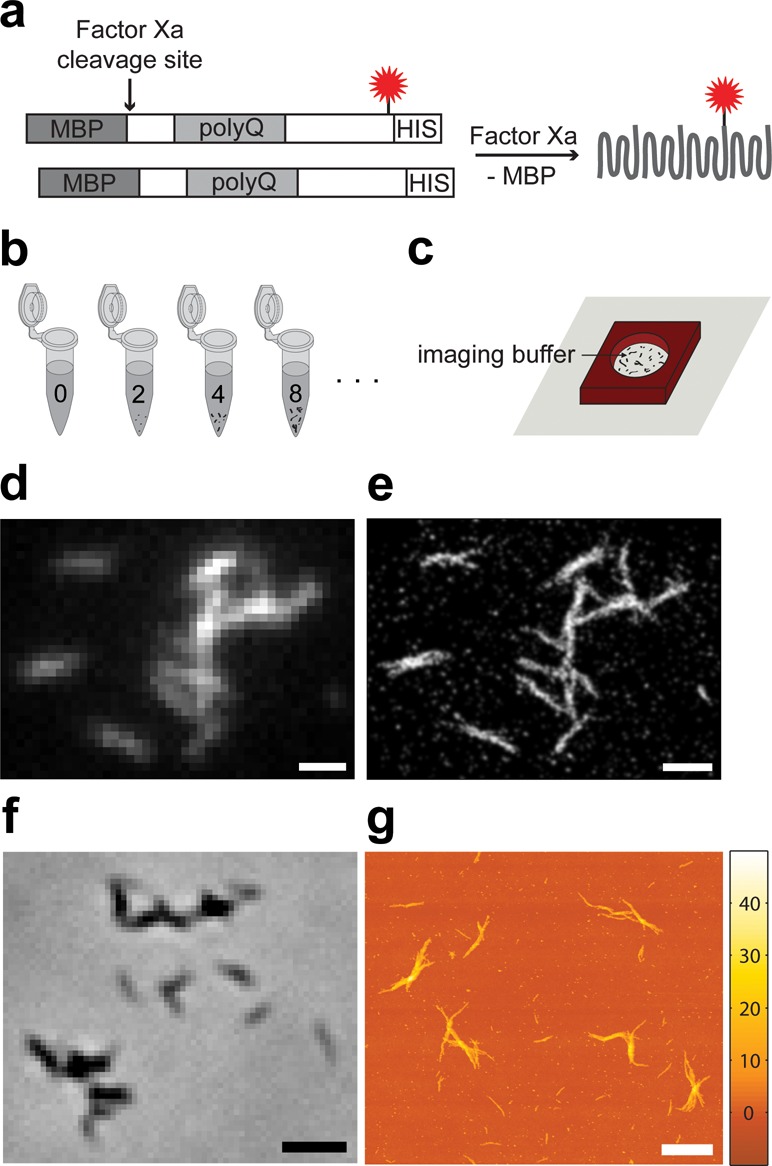
Htt-ex1 aggregation system. (a) Mixed aggregates of AX647-labeled (red star = AX647) construct and unlabeled construct were formed after the addition of Factor Xa. (b) Identical aggregation reactions of MBP-Htt-ex1:MBP-Htt-ex1-AX647 = 10:1 were incubated from 2 to 30 h before being (c) adsorbed to coverslips and treated with imaging buffer retained by a silicone isolator for SR analysis. (d) Diffraction-limited fluorescence image of aggregates after 16 h obtained using low laser power. (e) SR reconstruction of Htt-ex1 aggregates in d. All localizations are plotted with Gaussian functions of constant amplitude and σ = 30 nm. (f) Phase contrast image of Htt-ex1:Htt-ex1-AX647 = 10:1 aggregates after 24 h of aggregation. (g) AFM topography map of fibers after 24 h of aggregation. These aggregates formed from Htt-ex1:Htt-ex1-AX647 = 10:1 have equivalent morphologies to Htt-ex1 only. AFM image resolution is 9.8 nm pixel–1. Scale bars are 1 μm (d, e, g) and 2 μm (f).
As we had found in our previous studies of Htt-ex1 labeled with ATTO 655,33 the aggregates formed using only Htt-ex1 labeled with AX647 had a different morphology compared to the aggregates obtained with unlabeled Htt-ex1. A similar alteration of morphology was observed with Htt-ex1 labeled with Cy3 (Supporting Information Figure S2e,f) in single-molecule counting experiments that sought to follow the kinetics of aggregation at the single-molecule level (summarized in the Supporting Information). While the Htt-ex1:Htt-ex1-ATTO 655 = 100:1 ratio had been sufficient to satisfy the Nyquist criterion and produced detailed images of Htt-ex1 aggregates imaged after 1 day of aggregation,33 increasing the labeled fraction of Htt-ex1 improved the level of detail of our images without affecting aggregate morphology, allowing us to better examine the early stages of aggregation where the aggregates were small (and therefore contained fewer Htt-ex1 proteins). We examined the ratios of Htt-ex1:Htt-ex1-AX647 = 20:1, 10:1, and 5:1 (see Supporting Information). By phase contrast imaging, the aggregates at 20:1 and 10:1 (Supporting Information Figure S4) looked normal, and fluorescence SR imaging yielded excellent aggregate structures. The 5:1 ratio aggregates, however, were slightly abnormal in appearance and size distribution (the populations of smaller aggregates and fiber assemblies were larger and smaller, respectively) compared to the lower ratios. Comparison of the detailed morphology of unlabeled and 10:1 mixed aggregates by AFM imaging demonstrated that the AX647 fluorophore was not disrupting the structure of the fibers (Supporting Information Figure S5). The 10:1 ratio was therefore selected for further study.
Aggregation reactions with the 10:1 ratio were started by the addition of Factor Xa. A separate 110 μL aggregation reaction was used for each time-point (Figure 1b) because past phase contrast control experiments had shown that the removal of aliquots from a single larger aggregation reaction affected the progress of the aggregation and the aggregates produced. More specifically, the action of using a pipet tip to remove aggregates from a reaction was disruptive, often resulting in smaller or less-well developed aggregates at later time-points. We also found that use of a consistent reaction volume eliminated differences in the size distributions of aggregates that we had observed between aggregation reactions of different volumes. The aggregation time points investigated were 0, 2, 4, 5, 8, 16, 24, and 30 h. The time points at which to perform SR imaging of the aggregation were carefully chosen based on SDS-PAGE construct cleavage (Supporting Information Figure S3), phase contrast surveys, early filter-trap data (Supporting Information Figure S2c,d), ThioflavinT (ThT) assays (Supporting Information Figure S6a), and attenuance measurements (Supporting Information Figure S6b). Factor Xa cleaved approximately half of the MBP-Htt-ex1 in the first 30–60 min of incubation, and the cleavage was complete by 4 h. The initial rate of cleavage, as monitored by the increase in intensity of the MBP bands on a SDS-PAGE gel (Supporting Information Figure S3), was approximately 6 × 10⁻¹⁰ M s–1. MBP-Htt-ex1/MBP-Htt-ex1-AX647 without Factor Xa after 24 h, PBS buffer-only, and blink buffer-only were all imaged as controls.
Samples were kept hydrated with PBS buffer and imaged immediately after adsorption to glass coverslips (Figure 1c). Monomer and oligomer desorption was minimized by imaging directly after adsorption; a loss of small aggregates species would likely be an issue for samples stored under a buffer at RT for a significant period of time. After preparation of the SR sample, 50 μL of the remaining aggregation reaction was adsorbed to a clean glass coverslip and dried with nitrogen gas for phase contrast (Figure 1f) and noncontact mode AFM imaging (Figure 1g).
Diffraction-Limited (DL) Fluorescence Images of Htt-ex1 Aggregate Progression
Prior to recording movies of the AX647 fluorophore blinking in the Htt-ex1 aggregates for SR imaging, we captured fluorescence movies of the aggregates under “non-blinking” conditions of low excitation power and PBS buffer. The regions of each sample imaged were chosen randomly, and representative images are displayed in Figure 2. At 0 h, the population of adsorbed fluorescent species was monomeric (Figure 2a) because no cleavage of the MBP-Htt-ex1 by Factor Xa had occurred. By 2 h after Factor Xa addition, dense circular regions with higher fluorescence than surrounding areas were visible (Figure 2b). The overall fluorescence signal was also markedly higher at 2 h than at 0 h; the mean integrated density of the 2 h images collected was approximately 3 times the integrated density of the 0 h images. The increase in fluorescence signal was attributed to the presence of oligomeric fluorescent species and the stronger adsorption of these larger protein oligomers to the glass surface compared to the coexisting monomeric population.
Figure 2.

Survey of Htt-ex1:Htt-ex1-AX647 = 10:1 aggregates over time. The DL images were acquired under the same conditions and are presented at two different brightness and contrast levels. The fifth frame after the laser first illuminated each region is shown. The time-points are (a) 0, (b) 2, (c) 4, (d) 8, (e) 16, and (f) 24 h. (g) The 24 h control (no Factor Xa) is identical in appearance to the 0 h time-point. The scale bar of 3 μm in (a) applies to all unframed images.
Small fibers and distinct globular species (approximately circular species) were observed in addition to adsorbed monomeric/oligomeric species at 4 and 5 h (Figure 2c). By 8 h, the formation of mature ∼1-μm-long fibers and larger aggregates was well underway (Figure 2d). The larger aggregates appeared to be assemblies of mature fibers that had aggregated together. The fibers and aggregate species continued to grow larger and more fluorescent (at the apparent expense of the monomer/oligomer population adsorbed on the surface) from 16 h through 24 and 30 h (Figure 2e,f).
The range of the aggregates formed and heterogeneity of the larger, multifiber aggregates were clearly visible between the time points and also between the images taken at each time point. Interestingly, the mean integrated density of the image sets did not change significantly over the 30 h aggregation (with the exception of the large fluorescence increase at 2 h): the values were all within 4% to 35% of the mean integrated density calculated over all of the time-points. Thus, by this method, we directly observed the transition of the Htt-ex1 proteins from monomers to large aggregates.
SR Fluorescence Identifies Htt-ex1 Growth into Distinct Globular and Fibrillar Species
SR dSTORM fluorescence imaging revealed the detailed structures of the intricate Htt-ex1 aggregates and subdiffraction widths of fibers not accessible by DL fluorescence (compare Figure 1d and e). The fluorophore localizations were determined from the movie frames of blinking AX647 molecules, and redundant localizations were removed from the data sets as described in the Methods section. The localization precision and Nyquist resolution were used to set the value of the standard deviation (σ) of the plotted Gaussians in the SR reconstructions (see below, Supporting Information and Figures S7 and S8). The Gaussian fits were plotted with constant amplitude and σ = 30 nm.
Reconstructions of the SR movies taken of the Htt-ex1 aggregation reaction at 2 h confirmed what had been observed by DL fluorescence: the population consisted of species in the size range between monomers and globular species (Figure 3a). Both the DL and SR images showed circular regions of higher intensity which were likely to be larger oligomers and globular species. The mean size of the globular species was approximated from the full width at half-maximum (fwhm) of Gaussian fits to each of the species: 87 ± 25 nm (N = 470, see Supporting Information Table S1 and Figure S10a). These globular species (also observed at later time-points) were likely on the pathway to grow into fibers.9,12 No other aggregate species were observed at 2 h.
Figure 3.

SR reconstructions of Htt-ex1:Htt-ex1-AX647 = 10:1 globular species and fibers. (a) At 2 h the Htt-ex1 population was primarily monomeric and oligomeric. (b and c) Fibers were observed at 4 h in addition to the smaller species. Similar fibers of ∼1 μm in length were also identified at (d) 5, (e) 8, (f) 16, and (g) 24 h. A small quantity of assemblies that consisted of a low number of individual fibers (red arrows) were also observed at 4 h; these assemblies were in coexistence with much larger assemblies at later time points (see Figure 5). Scale bars = 1 μm.
At 4 h, fibers with lengths of 1 μm and transverse fwhm values of ∼100 nm were observed (Figures 3b,c, 4a–c). These fibers were the most conspicuous aggregates at 4 h. Some assemblies composed of a small number of fibers were also observed. Additional populations of monomeric Htt-ex1-AX647, oligomers, and globular species were also present on the glass surface around the Htt-ex1 fibers, although at a lower density than at 2 h. The decrease in density indicated that these species had either served as starting points for larger aggregates or were incorporated into growing aggregates along the way. At 4 h, the heterogeneity of the species formed from the aggregation reaction was first apparent. The SR images at 5 h (Figure 3d) were similar to those at 4 h. Two subtle differences were an increase in the population of the 1-μm-long fibers and an increase in the number of fiber assemblies.
Figure 4.

Increase in Htt-ex1 fiber widths and number of localizations. Fiber localizations at 4 h plotted as (a) Gaussian functions of constant amplitude and σ = 30 nm and (b) a 2D histogram of localizations within 16 nm × 16 nm pixels. (c) Histogram of localizations of the cross-sectional profile of the fiber (red box) in b. The distribution matched a Gaussian function with σ = 23 nm and fwhm of 54 nm. The same profile region in the part (a) reconstruction had a fwhm of 99 nm. (d) Gaussian SR reconstruction and (e) 2D histograms of fibers at 16 h. The profiles of the three fibers as depicted in part (e) are plotted together in part (f). Gaussian fits of the blue and green distributions had σ = 47 nm and σ = 41 nm, respectively (fwhm = 111 nm, 97 nm). The two-peaked red distribution (σ1 ∼ 49 nm, σ2 ∼ 53 nm) suggested that the aggregate was composed of two fibers bound together. Profiles of the same regions in the Gaussian SR reconstruction in part d yielded fwhm values of 135 nm (blue), 112 nm (green), ∼129 nm (red1), and ∼189 nm (red2). (g) The number of fibers or assemblies with a localization density defined using the σ of the Gaussian reconstructions. The distribution shifts from a mean of 5.7 localizations per 30 nm2 at 4 h (light gray, N = 265) to a mean of 7.2 localizations per 30 nm2 at 24 h (black, N = 376). Scale bars = 1 μm.
Between 5 and 8 h, and again between 8 and 16 h, the amount of Htt-ex1-AX647 incorporated into the fibers increased (Figure 3). The increase in localizations contributed to the greater definition of the continuous structures of the fibers. In addition, the number and size of fiber assemblies increased dramatically (Figure 5). By 16 h, the thickness (fwhm) of the fibers had increased noticeably compared to 4 h (Figure 4d–f) by ∼50 nm (from 2D histograms) or ∼40 nm (from Gaussian reconstructions), indicating the addition of Htt-ex1 monomers or oligomers to the fibers as has been previously postulated.11
Figure 5.

Htt-ex1 fiber assemblies. SR reconstructions of Htt-ex1 aggregate assemblies at (a) 8, (b) 16, and (c) 24 h. The number of occurrences and size of the fiber assemblies increased over time. Scale bars = 1 μm.
The spherical or globular species first observed at 2 h continued to be observed at later time points in apparent coexistence with the fibers and fiber assemblies. Indeed, the sizes (fwhm of Gaussian fits to the species, see Supporting Information Table S1 and Figure S10) of the globular species did not change appreciably over 24 h of aggregation (mean = 81 ± 18 nm, N = 3419). Thus, some of the globular species may have been unable to proceed along the growth pathway to fibers and persisted across all time points, were continuously formed from monomers as older globular species grew into fibers, or were the fragmentation products of fibers reaching an unstable length beyond 1 μm (see discussion below).
To characterize the growth of the Htt-ex1 aggregates over time, the localization density of the molecules found in the fibers and fiber assemblies was calculated. We did not include spherical or globular species in this analysis. Although precise quantification of numbers is challenging with blinking labels,45−47 it is still possible to extract an approximation of the numbers of labeled proteins present. The number of fits contained within each nonzero 16 nm × 16 nm pixel spanned by the SR reconstructions of fiber species was determined in ImageJ (http://rsbweb.nih.gov/ij/). The distributions of the localizations per 30 nm2 at 4 h (mean = 5.7) and 24 h (mean = 7.2) are plotted in Figure 4g. The increase in the fit density is the result of the increased fluorophore number in the fibers, which is clearly visible in the DL images of Figure 2 as the increase in the fluorescence intensity. We have shown that SR images of Htt-ex1 fibers correlate well with the morphology of the fibers (as determined by AFM).33 Therefore, the increase in the number of fluorophores is indicative of the overall growth of the Htt-ex1 fibers.
The area per localization can be interpreted as the two-dimensional box separating one localization from an adjacent one for rough estimation of sampling. For the data here, the box has dimensions of ∼13 nm × 13 nm at 4 h (mean = 167 nm2 localization–1) and ∼11 nm × 11 nm at 24 h (mean = 134 nm2 localization–1). The Nyquist criterion states that the interval that a structure is sampled at must be at least half the desired resolution of the structure
where D = 2 for two dimensions.48,49 Thus, our localization density yielded sub-30 nm resolution of the Htt-ex1 structures, and we set σ = 30 nm in our Gaussian reconstructions.
We recently characterized Htt-ex1 aggregate species in neuron-like PC12m cells that were transiently transfected with Htt-ex1 carrying 25, 46, or 97 glutamines and a C-terminal enhanced yellow fluorescent protein (eYFP).34 In the cells transfected with pathogenic-length Htt-ex1 (Q46 and Q97), two-dimensional SR imaging revealed fibrillar species with lengths of ∼1 μm and widths of ∼80–100 nm in addition to the large inclusion bodies frequently observed in DL fluorescence imaging.7,20,50 As noted in the paper, these fibers showed a strong similarity to the Htt-ex1 fibers we previously reported in vitro(33) and also are in excellent agreement with the Htt-ex1 aggregates imaged in the present study (Figure 3). The growth of the aggregates from the diffuse fluorescence present in all of the cells (at all time points) was observed as an increase in the fraction of cells containing small aggregates and inclusion bodies over the course of several days.34 The fluorescent layer of monomers and oligomers adsorbed to the coverglass surface at all time points (Figures 2 and 3) parallels this diffuse cellular fluorescence.
In the present study, the Htt-ex1 aggregates were adsorbed to a glass surface prior to analysis. The attractive interaction between the amphipathic Htt-ex1 proteins14 and the glass was likely a combination of van der Waals, ionic, and hydrogen-bonding forces. Such adsorption has been extensively used for AFM and EM imaging of protein aggregates.9 Although information about the three-dimensional structures of the in vitro aggregates is likely lost, there is evidence that two-dimensional structures are important in the cellular context. Some amyloidogenic proteins, in particular amyloid-β of Alzheimer’s disease, have been found to associate with membrane surfaces.51 Successful growth of adsorbed aggregate fibers across surfaces has also been reported.27,28 There are reports of Htt-ex1 association with membranes52,53 and indications that Htt-ex1 may disrupt membrane trafficking and signaling through such associations.54 Further, a more recent study demonstrated that fibrillar Htt-ex1 aggregates are toxic and that the toxicity is the result of the protein’s binding and permeabilization of cell membranes.8 The structure of Htt-ex1 aggregates on surfaces may therefore be quite relevant to the progression of the disease in cells.
On the basis of our SR imaging and previous models,9,10,12,41 we propose the following pathway for aggregation. Monomeric Htt-ex1 is converted over time into oligomers. These oligomers grow into globular species, and through further addition of Htt-ex1 the globular species elongate into fibers. We hypothesize that after the ubiquitous ∼1 μm Htt-ex1 fibers form, further aggregation takes place through the association of these fibers with one another. The SR fluorescence data also indicate that Htt-ex1 and Htt-ex1-AX647 monomers continue to add to the fibers and fiber assemblies throughout the aggregation process, causing the fibers to increase in width.
Interestingly, the individual fibers appear to stop growing in length after reaching ∼1 μm. A possible explanation is that Htt-ex1 fibers become unstable at lengths beyond ∼1 μm, with the tips fragmenting to form seeds (either small fibrils or globular species) of new fibers. This could explain the observation that the tips of fibers are often thinner and more tapered41 than the middle of the fibers, and also the broom-like ends of Htt-ex1 fibers (Figure S5).33 Fragmentation would also serve as a source for the ∼80 nm globular species present at all time points. Thus, growth in the width of the fibers would be observable (Figure 4), while any growth in length beyond ∼1 μm would lead to fragmentation events unobservable at our static time points. The apparent “characteristic length” of Htt-ex1 fibers is in contrast to other amyloidogenic proteins that grow much longer in a predominantly linear fashion with some branching,25−28,30,39 suggesting differences in the conformations of the constitutive monomers, the packing density of monomers in the fiber strands, or the interactions between monomers along the fiber axis versus perpendicular to it.55,56
Two-Color SR Imaging of Htt-ex1 Aggregate Growth
In addition to the globular species and 1 μm fibers already described, at 4 h oblong species and short fibers (<1 μm) appeared that looked like possible intermediates on the path to the 1 μm fibers. To probe the growth of globular species in the aggregation pathway, we used two-color SR imaging. The MBP-Htt-ex1 was labeled with Cy3B maleimide, a dye chosen for its good SR characteristics under the same blink buffer conditions as AX647.43 Phase contrast confirmed that aggregates of Htt-ex1:Htt-ex1-Cy3B = 10:1 displayed normal morphology.
First, Htt-ex1 seeds were created by probe sonicating18,25,26 Htt-ex1:Htt-ex1-AX647 = 10:1, 24-h-old aggregation reactions (Figure 6a). This procedure was reproducible and ensured that a sufficient number of fluorophores was incorporated into the seeds. The mean length (maximum distance between two points in the seed), area, and volume of the seeds measured by AFM were 50 nm ± 30 nm, 1.5 × 10⁻³ μm2, and 1.2 × 10⁻⁵ μm3, respectively (n = 1955). From the mean volume of the seeds and an estimate of the packing density of globular proteins (1.35 g cm–3),57 the approximate average number of Htt-ex1 proteins in a seed was 650. The size of the seeds measured by SR was the same as the size of the globular species in the time-course experiments above, with a mean fwhm of 78 nm ±6 nm when reconstructed with σ = 30 nm, and 122 nm ± 5 nm with σ = 50 nm (as represented in Figure 6d–g, Supporting Information Table S2). The SR size also agreed well with measurements by AFM: the 2D histogram of localizations (16 × 16 nm pixels) yielded a mean length (maximum distance between two points in the seed, Feret’s diameter) of 64 nm ±27 nm.
Figure 6.

Htt-ex1 seed growth into fibers. AFM of (a) Htt-ex1:Htt-ex1-AX647 = 10:1 seeds created by sonicating mature aggregates and (b) the fibers resulting from addition of Htt-ex1:Htt-ex1-Cy3B = 10:1 to the seeds. The seeds indicated by arrows are 35 nm (white), 48 nm (green), 73 nm (black), and 132 nm (blue) in length. (c) Schematic of two-color growth experiment and possible outcomes. (d) SR overlay of Htt-ex1:Htt-ex1-AX647 = 10:1 seeds (red) and Htt-ex1:Htt-ex1-Cy3B = 10:1 growth (green) after 22 h of aggregation. The localizations are plotted with Gaussians of constant amplitude and σ = 50 nm (reflecting the smaller number of photons emitted per blinking event, and thus the lower localization precision, of Cy3B). The TetraSpeck fiduciary beads used to align the channels are marked with gray boxes. (e–g) Enlarged images of selected fibers. Scale bars are (a) 500 nm, (b) 1 μm, (d) 2 μm, and (e–g) 500 nm.
The Htt-ex1:Htt-ex1-AX647 = 10:1 seeds were diluted 1:20 in a new aggregation reaction of 4.2 μM Htt-ex1:Htt-ex1-Cy3B = 10:1 and Factor Xa (Figure 6c). After 22 h of aggregation, the reaction was diluted by a factor of 5 and adsorbed to a glass coverslip. The capacity of the sonicated species labeled with either fluorophore to act as “seeds” for growth with the added Htt-ex1 labeled with the other fluorophore was confirmed by AFM (Figure 6b). The results agreed well with analogous experiments performed with unlabeled Htt-ex1 (see Supporting Information and Figure S9). However, the AFM images could not discriminate between the initial seeds and the added Htt-ex1 growth. The two-color, DL overlays were also difficult to interpret because of the subdiffraction-size diameters of the seeds and widths of the fibers. To elucidate the pattern of growth from the seeds, we turned to two-color fluorescence SR imaging.
Figure 6d displays a representative image from the seed growth experiments. The sample was prepared as described in the previous paragraph. The dilution of the aggregation reaction by a factor of 5 before adsorption to a glass coverslip was performed to decrease the density of aggregates on the surface for clear identification of separate species. The colocalization of the Htt-ex1 seeds with the Htt-ex1 fibers was quantified from these SR reconstructions using the Manders’ overlap coefficient, which computes to 0 for nonoverlapping images and to 1 for completely overlapping images.58 It is important to note that the higher resolution of these images provides a much more stringent colocalization test than for DL images. The analysis was performed in ImageJ using the JACoP v2.0 plugin.58 The Manders’ coefficients for the overall image were M1 = 0.671 (fraction of red overlapping green) and M2 = 0.33 (fraction of green overlapping red). The overlap of the red channel with the green channel was good, but interestingly many red Htt-ex1 seeds were not associated with green Htt-ex1 growth. However, most of the green Htt-ex1 regions larger than globular size were associated with at least one red Htt-ex1 seed. This indicated that addition of monomers to seeds (resulting in fiber growth) removed a large amount of monomeric green Htt-ex1 from the reaction and hindered the aggregation pathway followed in the absence of seeds. For the aggregate in Figure 6e, the coefficients are M1 = 0.999 and M2 = 0.594, indicating excellent colocalization of the red Htt-ex1 seed with the green Htt-ex1 growth. The second Manders’ coefficient is lower for both of the images because the Htt-ex1 fibers are much larger than the seeds.
The two-color colocalization analysis confirmed again that the sonicated species acted as seeds for Htt-ex1 growth. This finding, and the similarity in size of the seeds to the globular species we observed in the aggregation reactions starting from monomers, supported our hypothesis that the globular species grew into the fibers we later observed. Mono-, bi-, and multidirectional growth of the fibers from the seeds appeared in the overlapped images. The seeds created by sonication therefore must have multiple surface nucleation sites for templating aggregation. Incubation of the freshly sonicated seed mixtures for an additional 24 h resulted in no noticeable growth: the appearance and sizes of the seeds looked similar by AFM. Together with the absence of any fibers composed of red Htt-ex1, this indicated that fibers were only able to grow by monomer addition rather than by globule coalescence. In addition, some of the seeds did not show the capacity for aggregate growth, possibly due to disruption of the structure by the sonication process. It is also possible that some of the globular species formed from the initial aggregation reaction were unable to elongate into fibers and persisted through the 24-h aggregation period (we observed globular species in coexistence with fibers at all time points, Figure 3) and also through the sonication treatment.
Intriguingly, α-synuclein fibril seeds displayed a similar heterogeneity where some fibrils showed no growth while other fibers were elongated from both ends in two-color SR experiments.39 The authors of the α-synuclein study suggested that heterogeneity in fibril structure was a likely cause, which could also explain our results if the sonication process had different effects on different structures. We also note that we cannot rule out the possibility that the globular species we observed in aggregation reactions starting from monomers could be different at the individual protein structural level from the sonicated seeds; to directly address the questions of aggregation progression and directional growth, experiments must be performed directly with the growing globular species.
These results demonstrate that single-molecule, SR fluorescence imaging is ideally suited to characterizing the population of Htt-ex1 aggregates over time at the 10–30 nm resolution level. We present a model of Htt-ex1 aggregation from monomers to oligomers and globular species, then to fibers through elongation of the globules, and finally to large aggregates consisting of assemblies of individual fibers. The single-molecule sensitivity has accessed a level of detail in mapping the morphology of aqueous Htt-ex1 aggregates not previously available. We established the multidirectional growth of Htt-ex1 aggregates from globular seeds and believe that SR imaging will be instrumental in elucidating the details of Htt-ex1 and other amyloidogenic protein aggregation pathways both in vitro and in cellulo.
Methods
Huntingtin Protein Purification and Labeling
The MBP-HttQ44-exon1-S112C-histag protein was generated and purified with some modifications from previously published protocols.9,14,33 The MBP-Htt-ex1 protein was expressed in BL21 E. coli that were grown to an OD600 of 0.6–0.8 and autoinduced. The bacteria were harvested by centrifugation at 4000 RPM (4 °C, 20 min) and resuspended in a lysis buffer (25 mM HEPES-KOH pH 7.4, 100 mM NaCl, 0.5% Triton X-100, 15 mM imidazole, 10% glycerol, 0.5 mM PMSF, and 5 mM β-mercaptoethanol). Following lysis by French Press and clarification in the centrifuge at 12 000 RPM (4 °C, 45 min), the protein underwent a first purification by way of the C-terminal His-tag on a Ni-Sepharose column. The MBP tag was then utilized to purify the protein on an amylose column, and the protein was concentrated and exchanged into buffer C (25 mM HEPES-KOH pH 7.4, 100 mM NaCl, 10% glycerol (v/v)). The MBP-Htt-ex1Q44-exon1-S112C-histag protein was labeled with Alexa Fluor 647 maleimide (Life Technologies) and Cy3B maleimide (GE Healthcare) according to our published protocol.33 The dye:protein labeling ratio (0.6–0.7 for Alexa 647 and Cy3B) was used to determine the volumes of protein needed to prepare the MBP-Htt-ex1:MBP-Htt-ex1-dye = 10:1 ratio (i.e., the unlabeled MBP-Htt-ex1 concentration included the unlabeled protein within the MBP-Htt-ex1-Alexa 647 mixture at 0.6–0.7 labeling ratios).
Huntingtin Aggregation
Aggregation reactions of MBP-Htt-ex1 and MBP-Htt-ex1-Alexa 647 at a total protein concentration of 4.2 μM were carried out as previously described.33 Cleavage of MBP from Htt-ex1 at a ratio of 1 μg of Factor Xa protease (Novagen, EMD Chemicals) to 12 μg of MBP-Htt-ex1 started aggregation. A standard aggregation reaction volume of 110 μL was prepared separately for each time point: 0, 2, 4, 5, 8, 16, 24, and 30 h. A 50 μL aliquot was removed and adsorbed for 1 min to a clean glass coverslip with an adhesive silicone isolator (Grace Bio-Laboratories, Figure 1c). The aliquot was then pipetted out, and the slide was washed six times with 140 μL of PBS pH 7.4 buffer (Gibco, Life Technologies) by pipetting in and out around the inner edge of the silicone chamber. After preparation of the SR sample, 50 μL of the remaining aggregation reaction was adsorbed to a clean glass coverslip and dried with nitrogen gas for phase contrast and noncontact mode AFM imaging.
Sonication of Huntingtin Aggregates
Mature Htt-ex1 aggregate fibers are SDS-insoluble and resistant to heat.22 Sonication was employed to break the Htt-ex1 amyloid fibers down into small aggregates and globular seed species that were competent for growth.25,26 We found that bath sonication of the aggregates was not reproducible and exposed the aggregates to the temperature fluctuations of the bath water. However, probe sonication (Fisher Scientific 120 W Sonic Dismembrator) yielded reproducible results. A microcentrifuge tube containing 100 μL of aggregation reaction was secured in an ice bucket to prevent the small volume from heating during sonication. The probe sonicator tip was immersed as far into the aggregation reaction as possible without touching the sides of the tube. The tip was driven at 20% power for 1 min with 1 s on −1 s off pulses. A small aliquot (10 μL) was then adsorbed to a glass coverslip and checked by phase contrast. If fibers were still visible, the sample was sonicated again. The probe tip was cleaned by brief sonication in isopropyl alcohol and water both before and after the procedure.
Fluorescence Imaging
The aggregate population on the coverslip was surveyed prior to acquiring blink movies (Figure 2). After the aggregation reaction was adsorbed to the glass coverslip area within the silicone isolator, 140 μL of PBS pH 7.4 buffer (Gibco, Life Technologies) was added to the chamber. The sample was secured to the microscope stage and imaged with filtered (Semrock FF01-632/22), circularly polarized 638 nm (FiberTECII, Blue Sky Research) wide-field laser illumination at low power (165 W cm–2) via an Olympus 100× oil-immersion objective (UPLSAPO, 1.4 NA) on an Olympus IX71 microscope. The fluorescence was filtered using Semrock dichroic (Di01-R635), long-pass (BLP01-635R), and band-pass (FF02-675/67) filters. The fluorescence was recorded by an Andor Ixon+ DU897 EMCCD camera at 30 ms exposure. The dimensions of the movies were 128 × 128 pixels2 (20.4 × 20.4 μm2). The stage was moved to a new region before every movie acquisition. The laser shutter was opened after 20–40 frames had elapsed to capture the initial fluorescence signal of the sample. The brightness and contrast levels in Figure 2 were set using ImageJ.
The blink buffer components were combined immediately before addition to the sample and consisted of 10 mM cysteamine (from a freshly prepared stock pH-adjusted to 8.5 with HCl59), glucose oxidase (Sigma-Aldrich), catalase (Sigma-Aldrich), and glucose in PBS pH 7.4. The initial PBS was pipetted from the chamber on the microscope stage. The chamber was gently washed one time with 140 μL of PBS, and 140 μL of blink buffer was added. The sample was first imaged at very low power where no blinking occurred and the aggregates were just barely visible (approximately 1–5 W cm–2) to find a region for taking a blink movie. When a region was identified and in focus, a short set of frames was recorded (7.5 ms) as reference DL images, the laser shutter was closed, and the laser power was increased to 7.4 kW cm–2. The blink movie was then acquired with 7.5 ms exposure. The laser shutter was opened at approximately frame 100 and a total of 20 000 frames (150 s) were continuously recorded. The blink buffer was replaced with fresh blink buffer every 20–30 min (with 1× rinse with 140 μL PBS in between) because the buffer caused desorption of fluorescent Htt-ex1 monomers from the surface, resulting in unwanted background fluorescence. Faster desorption was observed than when using PBS alone; the cysteamine appeared to be the chief actor, but the high laser power undoubtedly also played a role.
Two-Color Fluorescence Imaging
SR samples were prepared by adsorbing aggregates to glass slides as described above. After the rinse step, however, 140 μL of TetraSpeck microspheres (100 nm, Life Technologies) diluted from the stock 1000–2000 times in PBS was added to the isolator chamber for 5 min. The buffer was then carefully removed by pipet and the blink buffer added. The TetraSpeck beads adsorbed stably to the Htt-ex1-covered glass surface and were used as fiduciaries to align the two fluorescence channels with one another.
Regions containing 3–4 TetraSpeck beads were selected. The AX647 fluorophores were imaged first with the 638 nm laser as described above until the molecules had photobleached. The dichroic and emission filters were then switched (to Semrock Di01-R532 dichroic, FF01-593/40 band-pass), and the field was brought into focus on the camera using very low power 532 nm laser (CrystaLaser) excitation. The Cy3B blinking was imaged at 30 ms frame–1 with 6 kW cm–2 from the 532 nm laser. The movies were processed individually using our fitting algorithm (see below), and the localizations were plotted with 2D Gaussian functions of constant amplitude and σ = 50 nm. The SR reconstructions were then overlaid using the TetraSpeck bead signals in both images and aligned in ImageJ with the Align_RGB_planes plugin (G. Landini).
Image Analysis
The positions of the blinking molecules were determined and validated as described in references (60) and (33). The fitting algorithm was started from the frame where individual single molecules were visible and well-separated from one another (typically 50–100 frames after the laser shutter was opened). After fitting was complete, the following postprocessing was performed in MATLAB (MathWorks). First, fits with localization precisions greater than 100 nm were discarded.33 A photon threshold was then applied to the data: localizations with less than 500 photons (often fits of background fluctuations) or greater than 8000 photons (fits of more than one molecule) were removed from the results. Lastly, redundant localizations of molecules that were in the on-state for more than one frame were removed.60 Although the frame exposure time had been chosen to capture the duration of the on-state of most molecules, some molecules were observed to continue emitting for 2–5 frames before returning to the dark state. The positions of localizations within 5 frames were compared. If the distance between the localizations was less than 10 nm (derived from the localization precision, see Supporting Information), the fit positions were combined by their average weighted by the number of photons of each respective fit. The number of localizations was reduced by approximately 30% through application of this final algorithm.
The SR reconstructions were generated using a custom ImageJ macro.61 The (x,y) localizations were plotted as 2D Gaussians with constant amplitude and σ = 30 nm, or as 2D histograms as described in the text.
The sizes of the globular species were measured using a custom MATLAB script. The panels in Figure 3 are selected regions cropped from the larger reconstruction images that were used for this analysis. Globular species were first selected by converting the SR reconstruction images to binary using an intensity threshold to exclude single isolated localizations. The lower bound of the threshold was set at 6% of the maximum intensity for all time points except 2 h, which was set higher at 10% to aid in selection of the globular species because of the proximity of the species to one another. Fibers and overlapping species not resolved by the SR analysis were removed by placing a 208 nm × 208 nm size limit on the species (176 nm × 176 nm for the 2 h data). Once the locations of the globular species were identified, Gaussian functions were fit to the SR reconstruction data to calculate the fwhm values of the species. The values calculated at each time point and representative histograms are given in Supporting Information Table S1 and Figure S10, respectively. The lengths of the fibers were approximated in ImageJ by converting the SR reconstruction images to binary and calculating the maximum distance between two points (Feret’s diameter) in the binary representation of the fibers.
Phase Contrast
Phase contrast images were obtained with an 100× oil immersion phase objective (Olympus UPLFLN, 1.3 NA). Images were typically recorded with a 532 nm dichroic (Di01-R532, Semrock) in the beam path and 2.5× beam expansion onto the camera.
Atomic Force Microscopy
AFM images were acquired on an XE-70 AFM (Park Systems Corp.) using PointProbe Plus Non-Contact/Tapping Mode (PPP-NCHR) tips (Park Systems, Nanosensors). The AFM was operated in noncontact mode, and the raw AFM images were flattened using first- through fourth-order fits in the XEI software (Park Systems Corp.) and plotted using a custom MATLAB script. Sizes of aggregate species were measured using the grain tool in XEI.
Acknowledgments
This work was supported by Award Number PN2-EY016525 from the National Eye Institute of the U.S. National Institutes of Health, U.S. National Science Foundation Graduate Research Fellowships to W.C.D. and K.S., The Gabilan Stanford Graduate Fellowship (W.C.D.), Larry Yung Stanford Graduate Fellowship (Y.J.), and Gerhard Casper Stanford Graduate Fellowship (K.S.).
Supporting Information Available
Single-molecule counting of Cy3-labeled Htt-ex1, Factor Xa cleavage of MBP-Htt-ex1-Alexa 647, fluorophore selection, ratio of labeled Htt-ex1 in aggregates, ensemble measurements of Htt-ex1 aggregation over time, characterization of AX647 as a label of Htt-ex1 under blinking conditions, and Htt-ex1 seed growth. This material is available free of charge via the Internet at http://pubs.acs.org.
Author Present Address
∥ Department of Biological Sciences, University of Southern California, Los Angeles, CA 90089, U.S.A.
Author Present Address
⊥ Program in Cellular and Molecular Medicine, Boston Children’s Hospital, Boston, MA 02215, U.S.A.
The authors declare no competing financial interests.
Funding Statement
National Institutes of Health, United States
Supplementary Material
References
- (1993) A novel gene containing a trinucleotide repeat that is expanded and unstable on huntington’ disease chromosomes. Cell 72, 971–983. [DOI] [PubMed] [Google Scholar]
- Imarisio S.; Carmichael J.; Korolchuk V.; Chen C.; Saiki S.; Rose C.; Krishna G.; Davies J. E.; Ttofi E.; Underwood B. R.; Rubinsztein D. C. (2008) Huntington’s disease: From pathology and genetics to potential therapies. Biochem. J. 412, 191–209. [DOI] [PubMed] [Google Scholar]
- DiFiglia M.; Sapp E.; Chase K. O.; Davies S. W.; Bates G. P.; Vonsattel J. P.; Aronin N. (1997) Aggregation of huntingtin in neuronal intranuclear inclusions and dystrophic neurites in brain. Science 277, 1990–1993. [DOI] [PubMed] [Google Scholar]
- Nagai Y.; Inui T.; Popiel H. A.; Fujikake N.; Hasegawa K.; Urade Y.; Goto Y.; Naiki H.; Toda T. (2007) A toxic monomeric conformer of the polyglutamine protein. Nat. Struct. Mol. Biol. 14, 332–340. [DOI] [PubMed] [Google Scholar]
- Miller J.; Arrasate M.; Brooks E.; Libeu C. P.; Legleiter J.; Hatters D.; Curtis J.; Cheung K.; Krishnan P.; Mitra S.; Widjaja K.; Shaby B. A.; Lotz G. P.; Newhouse Y.; Mitchell E. J.; Osmand A.; Gray M.; Thulasiramin V.; Saudou F.; Segal M.; Yang X. W.; Masliah E.; Thompson L. M.; Muchowski P. J.; Weisgraber K. H.; Finkbeiner S. (2011) Identifying polyglutamine protein species in situ that best predict neurodegeneration. Nat. Chem. Biol. 7, 925–934. [DOI] [PMC free article] [PubMed] [Google Scholar]
- Schaffar G.; Breuer P.; Boteva R.; Behrends C.; Tzvetkov N.; Strippel N.; Sakahira H.; Siegers K.; Hayer-Hartl M.; Hartl F. U. (2004) Cellular toxicity of polyglutamine expansion proteins: Mechanism of transcription factor deactivation. Mol. Cell 15, 95–105. [DOI] [PubMed] [Google Scholar]
- Arrasate M.; Mitra S.; Schweitzer E. S.; Segal M. R.; Finkbeiner S. (2004) Inclusion body formation reduces levels of mutant huntingtin and the risk of neuronal death. Nature 431, 805–810. [DOI] [PubMed] [Google Scholar]
- Pieri L.; Madiona K.; Bousset L.; Melki R. (2012) Fibrillar α-synuclein and huntingtin exon 1 assemblies are toxic to the cells. Biophys. J. 102, 2894–2905. [DOI] [PMC free article] [PubMed] [Google Scholar]
- Poirier M. A.; Li H.; Macosko J.; Cai S.; Amzel M.; Ross C. A. (2002) Huntingtin spheroids and protofibrils as precursors in polyglutamine fibrilization. J. Biol. Chem. 277, 41032–41037. [DOI] [PubMed] [Google Scholar]
- Ross C. A.; Poirier M. A.; Wanker E. E.; Amzel M. (2003) Polyglutamine fibrillogenesis: The pathway unfolds. Proc. Natl. Acad. Sci. U. S. A. 100, 1–3. [DOI] [PMC free article] [PubMed] [Google Scholar]
- Legleiter J.; Mitchell E.; Lotz G. P.; Sapp E.; Ng C.; DiFiglia M.; Thompson L. M.; Muchowski P. J. (2010) Mutant huntingtin fragments form oligomers in a polyglutamine length-dependent manner in vitro and in vivo. J. Biol. Chem. 285, 14777–14790. [DOI] [PMC free article] [PubMed] [Google Scholar]
- Burke K. A.; Godbey J.; Legleiter J. (2011) Assessing mutant huntingtin fragment and polyglutamine aggregation by atomic force microscopy. Methods 53, 275–284. [DOI] [PubMed] [Google Scholar]
- Thakur A. K.; Jayaraman M.; Mishra R.; Thakur M.; Chellgren V. M.; Byeon I.-J. L.; Anjum D. H.; Kodali R.; Creamer T. P.; Conway J. F.; Gronenborn A. M.; Wetzel R. (2009) Polyglutamine disruption of the huntingtin exon 1 N terminus triggers a complex aggregation mechanism. Nat. Struct. Mol. Biol. 16, 380–389. [DOI] [PMC free article] [PubMed] [Google Scholar]
- Tam S.; Spiess C.; Auyeung W.; Joachimiak L.; Chen B.; Poirier M. A.; Frydman J. (2009) The chaperonin TRiC blocks a huntingtin sequence element that promotes the conformational switch to aggregation. Nat. Struct. Mol. Biol. 16, 1279–1285. [DOI] [PMC free article] [PubMed] [Google Scholar]
- Kim M. W.; Chelliah Y.; Kim S. W.; Otwinowski Z.; Bezprozvanny I. (2009) Secondary structure of huntingtin amino-terminal region. Structure 17, 1205–1212. [DOI] [PMC free article] [PubMed] [Google Scholar]
- Sivanandam V. N.; Jayaraman M.; Hoop C. L.; Kodali R.; Wetzel R.; Van der Wel; Patrick C. A. (2011) The aggregation-enhancing huntingtin N-terminus is helical in amyloid fibrils. J. Am. Chem. Soc. 133, 4558–4566. [DOI] [PMC free article] [PubMed] [Google Scholar]
- Kelley N. W.; Huang X.; Tam S.; Spiess C.; Frydman J.; Pande V. S. (2009) The predicted structure of the headpiece of the huntingtin protein and its implications on huntingtin aggregation. J. Mol. Biol. 388, 919–927. [DOI] [PMC free article] [PubMed] [Google Scholar]
- Scherzinger E.; Sittler A.; Schweiger K.; Heiser V.; Lurz R.; Hasenbank R.; Bates G. P.; Lehrach H.; Wanker E. E. (1999) Self-assembly of polyglutamine-containing huntingtin fragments into amyloid-like fibrils: Implications for Huntington’s disease pathology. Proc. Natl. Acad. Sci. U. S. A. 96, 4604–4609. [DOI] [PMC free article] [PubMed] [Google Scholar]
- Sathasivam K.; Lane A.; Legleiter J.; Warley A.; Woodman B.; Finkbeiner S.; Paganetti P.; Muchowski P. J.; Wilson S.; Bates G. P. (2010) Identical oligomeric and fibrillar structures captured from the brains of R6/2 and knock-in mouse models of huntington’s disease. Hum. Mol. Genet. 19, 65–78. [DOI] [PMC free article] [PubMed] [Google Scholar]
- Suhr S. T.; Senut M.; Whitelegge J. P.; Faull K. F.; Cuizon D. B.; Gage F. H. (2001) Identities of sequestered proteins in aggregates from cells with induced polyglutamine expression. J. Cell Biol. 153, 283–294. [DOI] [PMC free article] [PubMed] [Google Scholar]
- Muchowski P. J.; Wacker J. L. (2005) Modulation of neurodegeneration by molecular chaperones. Nat. Rev. Neurosci. 6, 11–22. [DOI] [PubMed] [Google Scholar]
- Tam S.; Geller R.; Spiess C.; Frydman J. (2006) The chaperonin TRiC controls polyglutamine aggregation and toxicity through subunit-specific interactions. Nat. Cell Biol. 8, 1155–1162. [DOI] [PMC free article] [PubMed] [Google Scholar]
- Behrends C.; Langer C. A.; Boteva R.; Böttcher U. M.; Stemp M. J.; Schaffar G.; Rao B. V.; Giese A.; Kretzschmar H.; Siegers K.; Hartl F. U. (2006) Chaperonin TRiC promotes the assembly of polyQ expansion proteins into nontoxic oligomers. Mol. Cell 23, 887–897. [DOI] [PubMed] [Google Scholar]
- Kitamura A.; Kubota H.; Pack C.; Matsumoto G.; Hirayama S.; Takahashi Y.; Kimura H.; Kinjo M.; Morimoto R. I.; Nagata K. (2006) Cytosolic chaperonin prevents polyglutamine toxicity with altering the aggregation state. Nat. Cell Biol. 8, 1163–1169. [DOI] [PubMed] [Google Scholar]
- Inoue Y.; Kishimoto A.; Hirao J.; Yoshida M.; Taguchi H. (2001) Strong growth polarity of yeast prion fiber revealed by single fiber imaging. J. Biol. Chem. 276, 35227–35230. [DOI] [PubMed] [Google Scholar]
- Collins S. R.; Douglass A.; Vale R. D.; Weissman J. S. (2004) Mechanism of prion propagation: Amyloid growth occurs by monomer addition. PLoS Biol. 2, e321. [DOI] [PMC free article] [PubMed] [Google Scholar]
- Ban T.; Hamada D.; Hasegawa K.; Naiki H.; Goto Y. (2003) Direct observation of amyloid fibril growth monitored by thioflavin T fluorescence. J. Biol. Chem. 278, 16462–16465. [DOI] [PubMed] [Google Scholar]
- Andersen C. B.; Yagi H.; Manno M.; Martorana V.; Ban T.; Christiansen G.; Otzen D. E.; Goto Y.; Rischel C. (2009) Branching in amyloid fibril growth. Biophys. J. 96, 1529–1536. [DOI] [PMC free article] [PubMed] [Google Scholar]
- Ban T.; Hoshino M.; Takahashi S.; Hamada D.; Hasegawa K.; Naiki H.; Goto Y. (2004) Direct observation of Aβ amyloid fibril growth and inhibition. J. Mol. Biol. 344, 757–767. [DOI] [PubMed] [Google Scholar]
- Liang Y.; Lynn D. G.; Berland K. M. (2010) Direct observation of nucleation and growth in amyloid self-assembly. J. Am. Chem. Soc. 132, 6306–6308. [DOI] [PubMed] [Google Scholar]
- Huang B.; Babcock H.; Zhuang X. (2010) Breaking the diffraction barrier: Super-resolution imaging of cells. Cell 143, 1047–1058. [DOI] [PMC free article] [PubMed] [Google Scholar]
- Thompson M. A.; Lew M. D.; Moerner W. E. (2012) Extending microscopic resolution with single-molecule imaging and active control. Annu. Rev. Biophys. 41, 321–342. [DOI] [PubMed] [Google Scholar]
- Duim W. C.; Chen B.; Frydman J.; Moerner W. E. (2011) Sub-diffraction imaging of huntingtin protein aggregates by fluorescence blink-microscopy and atomic force microscopy. ChemPhysChem. 12, 2387–2390. [DOI] [PMC free article] [PubMed] [Google Scholar]
- Sahl S. J.; Weiss L. E.; Duim W. C.; Frydman J.; Moerner W. E. (2012) Cellular inclusion bodies of mutant huntingtin exon 1 obscure small fibrillar aggregate species. Sci. Rep. 2, 1–7. [DOI] [PMC free article] [PubMed] [Google Scholar]
- Caron N. S.; Hung C. L.; Atwal R. S.; Truant R. (2014) Live cell imaging and biophotonic methods reveal two types of mutant huntingtin inclusions. Hum. Mol. Genet. 23, 2324–2338. [DOI] [PubMed] [Google Scholar]
- Kaminski Schierle G. S.; van de Linde S.; Erdelyi M.; Esbjorner E. K.; Klein T.; Rees E.; Bertoncini C. W.; Dobson C. M.; Sauer M.; Kaminski C. F. (2011) In situ measurements of the formation and morphology of intracellular beta-amyloid fibrils by super-resolution fluorescence imaging. J. Am. Chem. Soc. 133, 12902–12905. [DOI] [PubMed] [Google Scholar]
- Roberti M. J.; Folling J.; Celej M. S.; Bossi M.; Jovin T. M.; Jares-Erijman E. A. (2012) Imaging nanometer-sized α-synuclein aggregates by superresolution fluorescence localization microscopy. Biophys. J. 102, 1598–1607. [DOI] [PMC free article] [PubMed] [Google Scholar]
- Ries J.; Udayar V.; Soragni A.; Hornemann S.; Nilsson K. P.; Riek R.; Hock C.; Ewers H.; Aguzzi A. A.; Rajendran L. (2013) Superresolution imaging of amyloid fibrils with binding-activated probes. ACS Chem. Neurosci. 4, 1057–1061. [DOI] [PMC free article] [PubMed] [Google Scholar]
- Pinotsi D.; Buell A. K.; Galvagnion C.; Dobson C. M.; Kaminski Schierle G. S.; Kaminski C. F. (2014) Direct observation of heterogeneous amyloid fibril growth kinetics via two-color super-resolution microscopy. Nano Lett. 14, 339–345. [DOI] [PMC free article] [PubMed] [Google Scholar]
- Dalal V.; Bhattacharya M.; Narang D.; Sharma P. K.; Mukhopadhyay S. (2012) Nanoscale fluorescence imaging of single amyloid fibrils. J. Phys. Chem. Lett. 3, 1783–1787. [DOI] [PubMed] [Google Scholar]
- Shahmoradian S. H.; Galaz-Montoya J. G.; Schmid M. F.; Cong Y.; Ma B.; Spiess C.; Frydman J.; Ludtke S. J.; Chiu W. (2013) TRiC’s tricks inhibit huntingtin aggregation. eLife 2, e00710. [DOI] [PMC free article] [PubMed] [Google Scholar]
- Heilemann M.; van de Linde S.; Schüttpelz M.; Kasper R.; Seefeldt B.; Mukherjee A.; Tinnefeld P.; Sauer M. (2008) Subdiffraction-resolution fluorescence imaging with conventional fluorescent probes. Angew. Chem., Int. Ed. 47, 6172–6176. [DOI] [PubMed] [Google Scholar]
- Dempsey G. T.; Vaughan J. C.; Chen K. H.; Bates M.; Zhuang X. (2011) Evaluation of fluorophores for optimal performance in localization-based super-resolution imaging. Nat. Methods 8, 1027–1036. [DOI] [PMC free article] [PubMed] [Google Scholar]
- Mangiarini L.; Sathasivam K.; Seller M.; Cozens B.; Harper A.; Hetherington C.; Lawton M.; Trottier Y.; Lehrach H.; Davies S. W.; Bates G. P. (1996) Exon 1 of the HD gene with an expanded CAG repeat is sufficient to cause a progressive neurological phenotype in transgenic mice. Cell 87, 493–506. [DOI] [PubMed] [Google Scholar]
- Lee S.; Shin J. Y.; Lee A.; Bustamante C. (2012) Counting single photoactivatable fluorescent molecules by photoactivated localization microscopy (PALM). Proc. Natl. Acad. Sci. U. S. A. 109, 17436–17441. [DOI] [PMC free article] [PubMed] [Google Scholar]
- Annibale P.; Vanni S.; Scarselli M.; Rothlisberger U.; Radenovic A. (2011) Quantitative photo activated localization microscopy: Unraveling the effects of photoblinking. PLoS One 6, e22678. [DOI] [PMC free article] [PubMed] [Google Scholar]
- Durisic N.; Laparra-Cuervo L.; Sandoval-Alvarez A.; Borbely J. S.; Lakadamyali M. (2014) Single-molecule evaluation of fluorescent protein photoactivation efficiency using an in vivo nanotemplate. Nat. Methods 11, 156–162. [DOI] [PubMed] [Google Scholar]
- Shroff H.; Galbraith C. G.; Galbraith J. A.; Betzig E. (2008) Live-cell photoactivated localization microscopy of nanoscale adhesion dynamics. Nat. Methods 5, 417–423. [DOI] [PMC free article] [PubMed] [Google Scholar]
- Jones S. A.; Shim S.; He J.; Zhuang X. (2011) Fast, three-dimensional super-resolution imaging of live cells. Nat. Methods 8, 499–505. [DOI] [PMC free article] [PubMed] [Google Scholar]
- Lunkes A.; Mandel J. (1998) A cellular model that recapitulates major pathogenic steps of huntington’s disease. Hum. Mol. Genet. 7, 1355–1361. [DOI] [PubMed] [Google Scholar]
- Williams T. L.; Serpell L. C. (2011) Membrane and surface interactions of alzheimer’s abeta peptide - insights into the mechanism of cytotoxicity. FEBS J. 278, 3905–3917. [DOI] [PubMed] [Google Scholar]
- DiFiglia M.; Sapp E.; Chase K.; Schwarz C.; Meloni A.; Young C.; Martin E.; Vonsattel J.; Carraway R.; Reeves S. A.; Boyce F. M.; Aronin N. (1995) Huntingtin is a cytoplasmic protein associated with vesicles in human and rat brain neurons. Neuron 14, 1075–1081. [DOI] [PubMed] [Google Scholar]
- Atwal R. S.; Xia J.; Pinchev D.; Taylor J.; Epand R. M.; Truant R. (2007) Huntingtin has a membrane association signal that can modulate huntingtin aggregation, nuclear entry and toxicity. Hum. Mol. Genet. 16, 2600–2615. [DOI] [PubMed] [Google Scholar]
- Kegel K. B.; Sapp E.; Alexander J.; Valencia A.; Reeves P.; Li X.; Masso N.; Sobin L.; Aronin N.; DiFiglia M. (2009) Polyglutamine expansion in huntingtin alters its interaction with phospholipids. J. Neurochem. 110, 1585–1597. [DOI] [PubMed] [Google Scholar]
- Chiti F.; Dobson C. M. (2006) Protein misfolding, functional amyloid, and human disease. Annu. Rev. Biochem. 75, 333–366. [DOI] [PubMed] [Google Scholar]
- Eichner T.; Radford S. (2011) A diversity of assembly mechanisms of a generic amyloid fold. Mol. Cell 43, 8–18. [DOI] [PubMed] [Google Scholar]
- Fischer H.; Polikarpov I.; Craievich A. F. (2004) Average protein density is a molecular-weight-dependent function. Protein Sci. 13, 2825–2828. [DOI] [PMC free article] [PubMed] [Google Scholar]
- Bolte S.; Cordelieres F. P. (2006) A guided tour into subcellular colocalization analysis in light microscopy. J. Microsc. 224, 213–232. [DOI] [PubMed] [Google Scholar]
- Dani A.; Huang B.; Bergan J.; Dulac C.; Zhuang X. (2010) Superresolution imaging of chemical synapses in the brain. Neuron 68, 843–856. [DOI] [PMC free article] [PubMed] [Google Scholar]
- Biteen J. S.; Thompson M. A.; Tselentis N. K.; Bowman G. R.; Shapiro L.; Moerner W. E. (2008) Super-resolution imaging in live caulobacter crescentus cells using photoswitchable EYFP. Nat. Methods 5, 947–949. [DOI] [PMC free article] [PubMed] [Google Scholar]
- Ptacin J. L.; Lee S. F.; Garner E. C.; Toro E.; Eckart M.; Comolli L. R.; Moerner W. E.; Shapiro L. (2010) A spindle-like apparatus guides bacterial chromosome segregation. Nat. Cell Biol. 12, 791–798. [DOI] [PMC free article] [PubMed] [Google Scholar]
Associated Data
This section collects any data citations, data availability statements, or supplementary materials included in this article.