Abstract
Ceramides are synthesized by six mammalian ceramide synthases (CerSs), each of which uses fatty acyl-CoAs of different chain lengths for N-acylation of the sphingoid long-chain base. We now describe a rapid and reliable CerS assay that uses a fluorescent N-[6-[(7-nitrobenzo-2-oxa-1,3-diazol-4-yl) (NBD) sphinganine substrate followed by separation of the NBD-lipid substrate and products using solid phase extraction (SPE) C18 chromatography. SPE chromatography is a quick and reliable alternative to TLC, and moreover, there is no degradation of either NBD-sphinganine or NBD-ceramide. We have optimized the assay for use with minimal amounts of protein in a minimal volume. This assay will prove useful for the analysis of CerS activity, which is of particular importance in light of the growing involvement of CerS in cell regulation and in the pathology of human diseases.
Keywords: ceramides, sphingolipids, in vitro assay, chromatography, enzymology, long-chain base, fatty acyl-CoA, N-acylation
Ceramide, the backbone of all sphingolipids (1), is synthesized by the N-acylation of sphingoid long-chain bases by ceramide synthases (CerSs). Mammals contain six distinct CerSs, with each using a subset of fatty acyl-CoAs for the N-acylation of sphinganine (Sph) to generate dihydroceramides or of sphingosine to generate ceramides (2, 3). CerSs have become the focus of great interest due to the realization that ceramides with different acyl chain lengths play distinct roles in cell physiology (4–6), with studies focusing on biochemical analysis of the mode of CerS regulation (7–13), on biological approaches using CerS-null mice (4, 6, 14), and on pathophysiological studies using tissues from patients in which CerS activity changes during the development and progression of pathology (15–19).
For many years, CerS activity was assayed using radioactive substrates [either 3H-Sph (7) or 14C-labeled acyl-CoAs (20)], with separation of the substrate and products performed by TLC. Recently, a fluorescent Sph analog has become available, ω(7-nitro-2-1,3-benzoxadiazol-4-yl)(2S,3R)-2-aminooctadecane-1,3-diol (NBD-Sph), which is a substrate for CerS (18, 21). Clearly, the use of fluorescent substrates is preferable to use of radioactive substrates as it avoids radiation hazards (21).
We now describe an assay using NBD-Sph, in which the fluorescent lipid products are separated by solid phase extraction (SPE) C18 chromatography using a 96-well plate. This assay has a number of advantages over other assays, including short assay times, the use of small reaction volumes (20 µl) and small amounts of protein. It alleviates the use of TLC for lipid separation, which often results in degradation of Sph on the TLC plate. We suggest that this assay will permit the rapid assay of CerS activity in large numbers of samples and will prove particularly useful for laboratories that do not have access to facilities available in more lipid-oriented laboratories.
MATERIALS AND METHODS
Materials
Methanol gradient grade for liquid chromatography, water for chromatography, and silica gel 60 TLC plates were from Merck (Darmstadt, Germany). Formic acid (purity >98%) was from Sigma-Aldrich (St. Louis, MO). Chloroform for spectrophotometry was from J. T. Baker (Center Valley, PA). Ammonium acetate was from Macron Chemicals (Center Valley, PA). Strata end-capped silica-based C18-E (15 mg/well) 96-well plates and the vacuum manifold for SPE with vacuum gauge and cover mat were from Phenomenex (Torrance, CA). The vacuum pump was an Alcatel 2002 from Ideal Vacuum Products (Albuquerque, NM).
Cell culture, transfection, and preparation of cell homogenates
HEK 293T cells were cultured in Dulbecco’s modified Eagle’s medium supplemented with 10% fetal calf serum, 100 IU/ml penicillin, 100 µg/ml streptomycin, and 110 µg /ml sodium pyruvate. Transfection was performed with the polyethylenimine reagent (Sigma-Aldrich) using 10 µg of plasmid per 10 cm culture dish. Thirty-six to 48 h after transfection, cells were removed from culture dishes and washed twice with phosphate-buffered saline. Cell homogenates were prepared in 20 mM HEPES-KOH, pH 7.2, 25 mM KCl, 250 mM sucrose, and 2 mM MgCl2 containing a protease inhibitor cocktail (Sigma-Aldrich). Protein was determined using the Bradford reagent (Bio-Rad, Hercules, CA).
CerS assay and lipid separation by TLC
Cell homogenates were incubated at 37°C with 15 µM NBD-Sph, 20 µM defatted BSA, and 50 µM acyl-CoA, based on conditions used previously with [4,5-3H]Sph as substrate (22), but using a 20 μl reaction volume. Reactions were terminated by the addition of chloroform-methanol (1:2, v/v), and lipids were extracted (23). Lipids were then dried under N2, resuspended in chloroform-methanol (9:1, v/v), and separated by TLC using chloroform-methanol-2M NH4OH (40:10:1, v/v/v) as the developing solvent. NBD-labeled lipids were visualized using a Typhoon 9410 variable mode imager and quantified by ImageQuantTL (GE Healthcare, Chalfont St. Giles, UK).
NBD-Sph stability
NBD-Sph (400 µl from a stock solution of 3.7 mg/ml) was separated by preparative TLC using chloroform-methanol-water (65:25:4, v/v/v) as the developing solvent. Bands were excised from the TLC plate and extracted twice using methanol-chloroform (75:25, v/v). NBD-lipids were analyzed using negative ion mode electrospray tandem mass spectrometry with an ABI 4000 QTrap mass spectrometer and an Agilent 1100 series HPLC. A 5 µl injection volume and a mobile phase consisting of methanol containing 1% formic acid were used for the analysis. NBD-Sph and ω(7-nitro-2-1,3-benzoxadiazol-4-yl)-N-stearoyl-d-erythro-sphingosine (NBD-C18-ceramide) were also analyzed before and after elution from the SPE columns.
RESULTS AND DISCUSSION
Optimizing conditions for use of NBD-Sph in the CerS assay
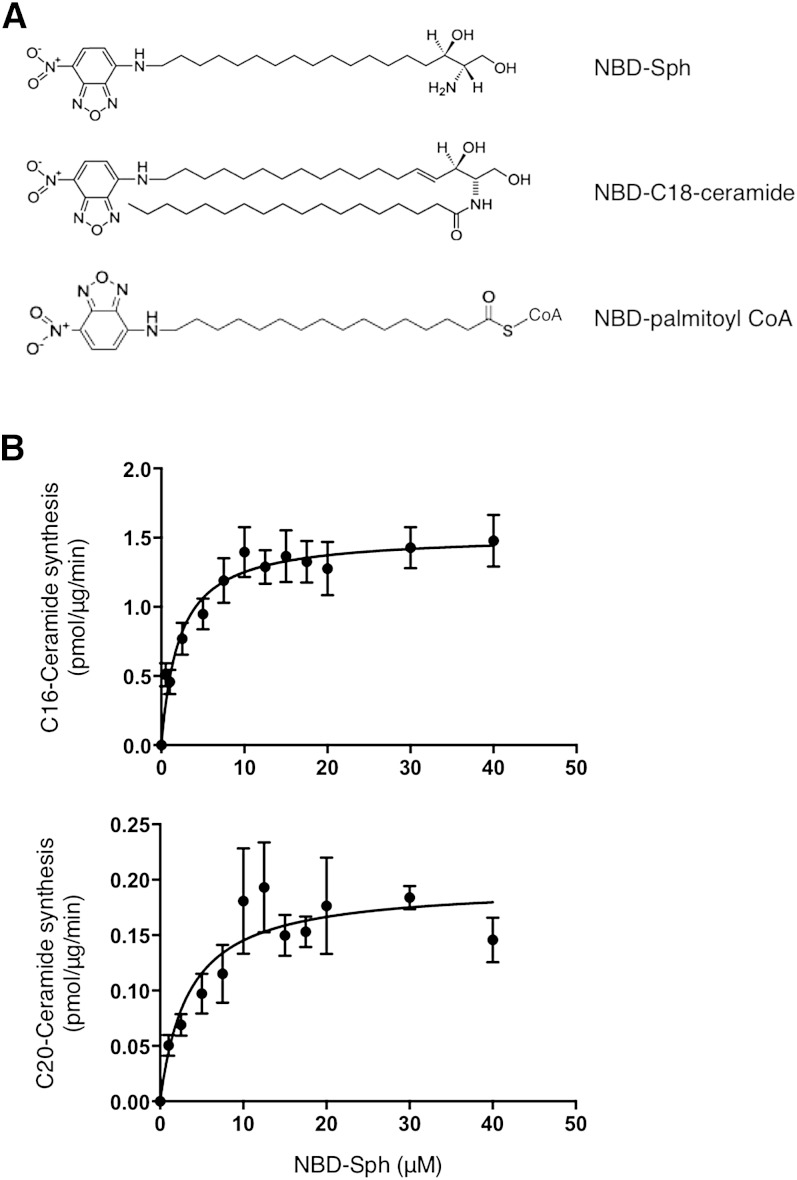
While NBD-Sph (Fig. 1) has been used previously to assay CerS (17, 18, 21), no attempts have been made to minimize reaction volumes to allow the use of small amounts of biological material or to improve the mode of separating NBD-lipid substrates and products. We have now been able to decrease the reaction volume to a minimum of 20 µl, rather than the 100–250 µl used previously with [4,5-3H]Sph (22) or with NBD-Sph (21), permitting the use of small amounts of protein for the assay. Thus, we could assay CerS5 activity using as little as 1 µg of protein and 5 min reaction time, and CerS4 activity using 10 (Fig. 1B) or 20 µg (not shown) of protein and 20 min reaction time; note that each CerS displays different specific activities, necessitating optimization of assay conditions for each CerS (22). Under these conditions, we obtained a Km of 2.0 ± 0.5 µM toward NBD-Sph for CerS5 and 3.4 ± 1.5 µM for CerS4. Both these results compare favorably with Km values obtained previously using [4,5-3H]Sph (22) and NBD-Sph (21) (which were obtained using higher amounts of protein and/or longer reaction times). The need for lower amounts of protein could be particularly useful when only small amounts of tissue or cells are available, such as might be the case when using clinical samples.
Fig. 1.
Structure of NBD-lipids and optimization of CerS assay using NBD-Sph. A: Structure of NBD-lipids. B: Homogenates from cells overexpressing CerS5 or CerS4 were assayed in a 20 μl reaction volume with increasing amounts of NBD-Sph with 50 μM C16-CoA or C20-CoA, respectively, and 20 μM defatted BSA, at 37°C. Results are means ± SEM of two to three independent experiments.
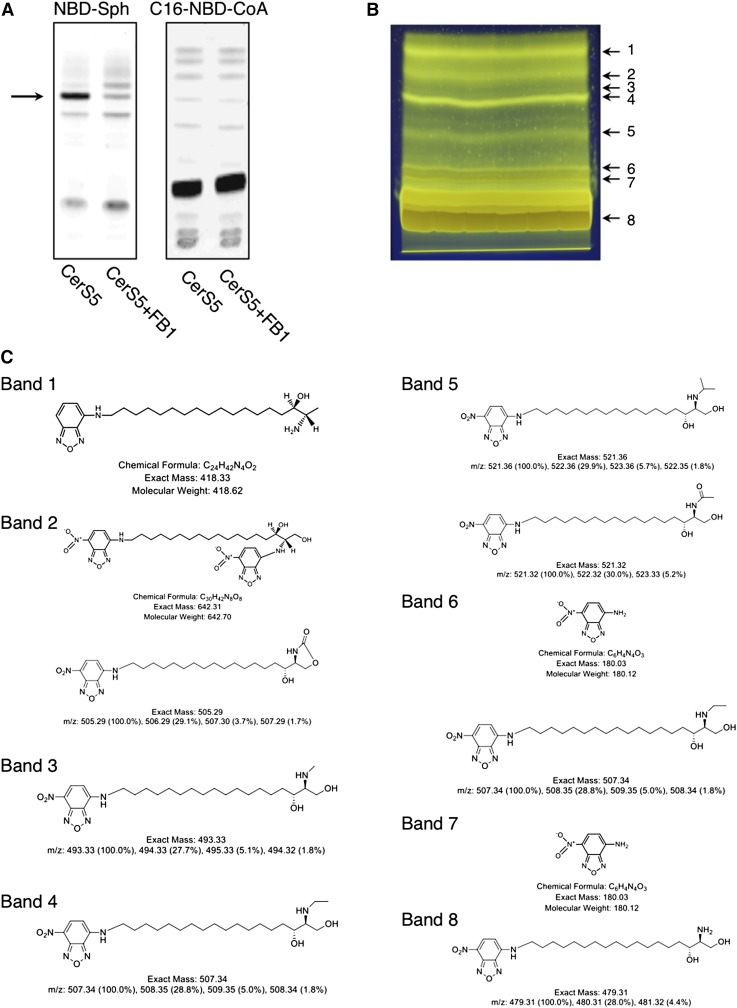
Interestingly, whereas NBD-Sph was a good substrate for CerS, {N-[(7-nitro-2-1,3-benzoxadiazol-4-yl)-methyl]amino} palmitoyl coenzyme A (NBD-palmitoyl-CoA) did not act as a CerS5 substrate (Fig. 2A), nor did it act as a competitive inhibitor of CerS5 (data not shown), strengthening the notion (4) that CerSs are highly specific for the acyl-CoA donor but less specific for the sphingoid long-chain base. Degradation products of NBD-Sph are readily apparent upon separation by TLC, which is of concern if low levels of CerS activity are assayed because some of the degradation products have Rf values similar to that of NBD-ceramide (Fig. 2B). To isolate the degradation products, we performed preparative TLC (Fig. 2B), followed by negative ion mode electrospray tandem mass spectrometry, and obtained predicted structures of the NBD-Sph degradation products (Fig. 2C).
Fig. 2.
NBD-Sph degradation on TLC. A: Homogenates (20 μg of protein) were prepared from CerS5-overexpressing cells. Activity was assayed with or without the CerS inhibitor, fumonisin B1 (FB1), using 15 µM NBD-Sph and 50 μM C16-CoA (left-hand panel) or 15 μM Sph and 50 μM NBD-palmitoyl-CoA (C16-NBD-CoA) (right-hand panel) with 20 μM defatted BSA for 20 min at 37°C. The arrow indicates NBD-ceramide. Other bands are degradation products. B: Preparative TLC plate loaded with 1.48 mg of NBD-Sph. Lipids were separated using chloroform-methanol-water (65:25:4, v/v/v) as the developing solvent. NBD-lipids (numbered 1–8) were extracted. C: The NBD-lipids from B were analyzed by negative ion mode electrospray tandem mass spectrometry. The predicted structures are shown. Band 8 is NBD-Sph.
SPE chromatography to separate NBD lipids
In order to simplify the CerS assay, and to limit the use of specialized equipment that might only be available in a lipid-oriented laboratory, as well as to make the assay compatible for use with large numbers of samples, we established a new method based on the separation of NBD-Sph from NBD-ceramide by column chromatography. A number of different parameters were tested, including use of various solvents and different columns and varying the column sorbent mass. Initial studies were performed using mixtures of NBD-Sph and NBD-C18-ceramide in the absence of cellular protein. The best separation was achieved using Strata end-capped silica-based C18-E (15 mg/well) 96-well plates. Use of HPLC-grade solvents and a vacuum gauge reading of 5–7 inHg (0.2 bar) gave the best separation; the use of the vacuum was essential to achieve efficient separation.
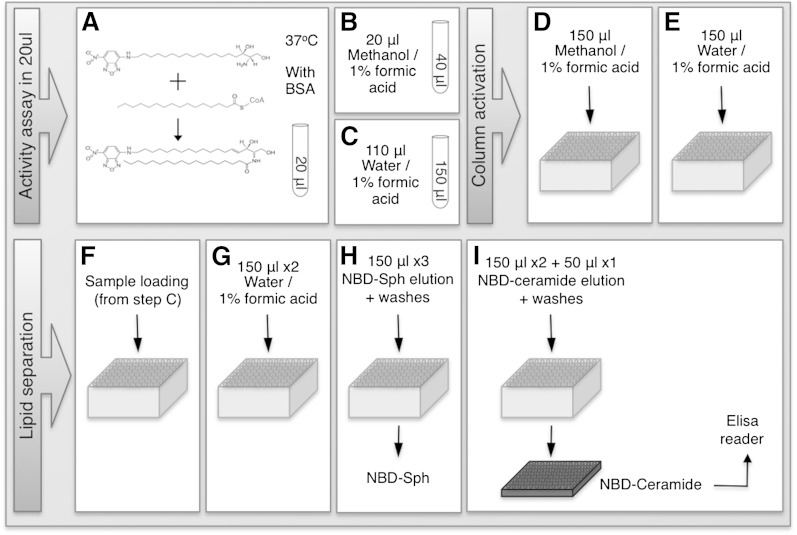
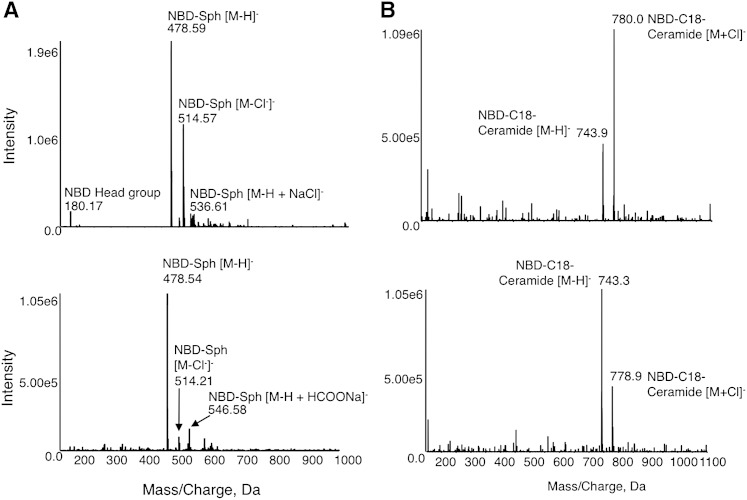
Optimal conditions were established as follows, as outlined schematically in Fig. 3. Reactions were performed at 37°C using 15 µM NBD-Sph, 20 µM defatted BSA, and 50 µM acyl-CoA in a reaction volume of 20 µl (Fig. 3A). Reactions were terminated with 20 μl methanol/1% (v/v) formic acid (Fig. 3B), followed by addition of 110 µl water/1% (v/v) formic acid (Fig. 3C). While columns were being activated (see below), samples were maintained at either room temperature or at −20°C (prior to addition of water/1% (v/v) formic acid) if column preparation took more than a few minutes. Columns were placed in a vacuum manifold attached to a vacuum pump and washed with 150 µl methanol/1% formic acid with 30 s of vacuum (Fig. 3D), followed by 150 µl water/1% formic acid for an additional 30 s under vacuum (Fig. 3E). Samples from the reaction tubes (150 µl) were added, and the vacuum was applied for another 30 s (Fig. 3F). Two washes with 150 µl water/1% formic acid were applied for 30 s each, followed by 2 min under vacuum (Fig. 3G). NBD-Sph was eluted using three 150 μl washes of 10 mM ammonium acetate in methanol-water-chloroform-formic acid (30:14:6:1, v/v/v/v) for 30 s each (Fig. 3H), followed by 2 min under vacuum. The waste container used to collect the initial washes containing NBD-Sph was discarded and replaced by round-bottom, black polypropylene 96-well plates (Nunc Thermo Scientific, Waltham, MA) (three plates were placed on top of each other so that the distance between the columns and the plates was short enough to avoid spillage of the eluates). NBD-ceramide was eluted from the columns with 2 × 150 µl and an additional 1 × 50 µl of 10 mM ammonium acetate in methanol-chloroform-water-formic acid (30:14:6:1) (30 s each) (Fig. 3I) followed by 2 min under vacuum. NBD-ceramide was quantified using a fluorescent ELISA reader. In contrast to separation on TLC plates, no degradation of NBD-Sph was detected after elution from the SPE column, and likewise, there was no degradation of NBD-ceramide (Fig. 4).
Fig. 3.
A–I: Workflow for activity and separation of NBD-lipids using SPE columns. Individual steps are indicated and discussed in the text.
Fig. 4.
Lack of degradation of NBD lipids after separation on SPE columns. Analysis of NBD-Sph (A) and NBD-C18-ceramide (B) by negative ion mode electrospray tandem mass spectrometry before (upper panel) and after (lower panel) elution from the SPE column. The results were obtained after subtracting peaks obtained upon elution using ethanol-water (1:1, v/v). Intensity refers to ion counts.
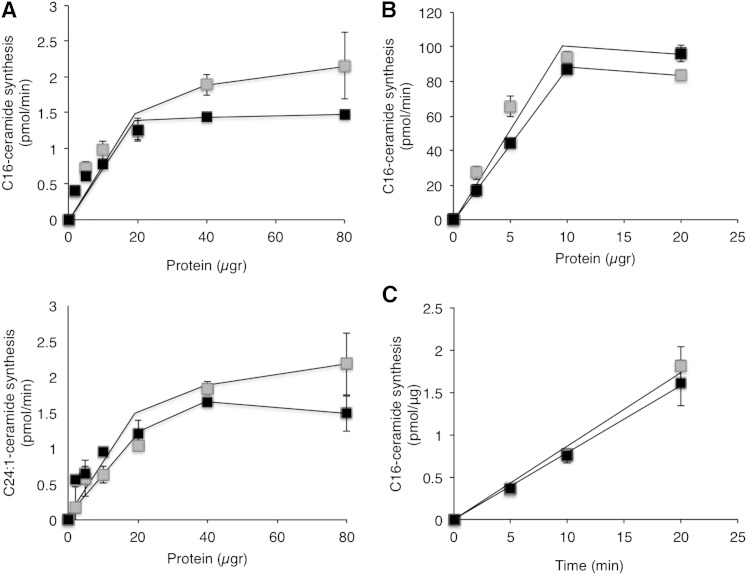
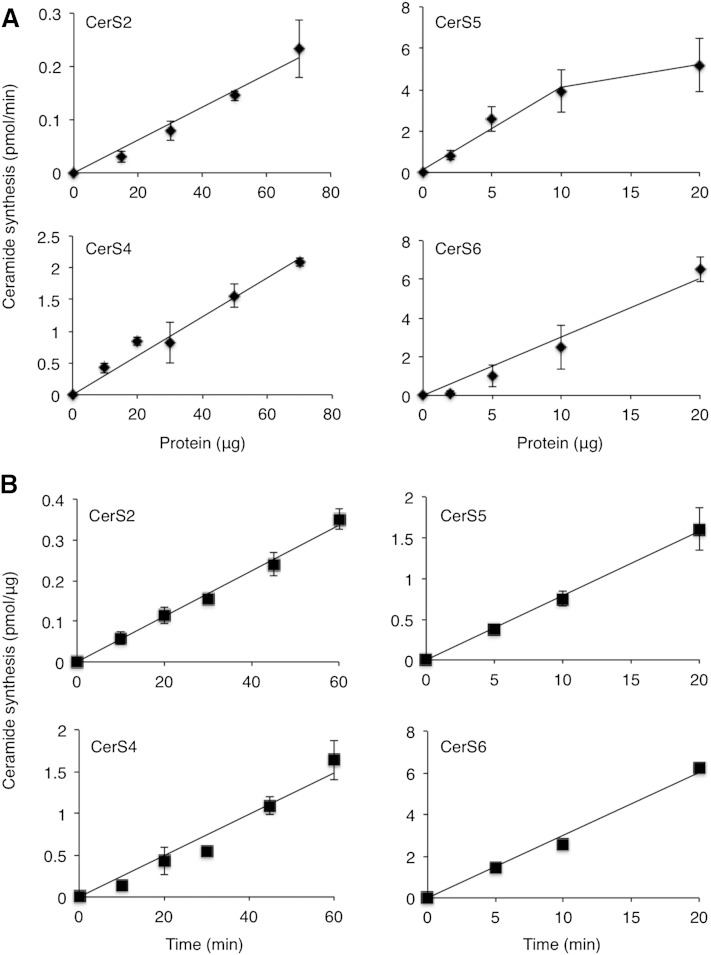
The suitability of using SPE columns for the CerS assay was tested in nontransfected HEK cells using either C16:0-acyl-CoA (to assay CerS5/6) or C24:1-acyl-CoA (to assay CerS2), with increasing amounts of protein. NBD-ceramide was quantified using standard curves of NBD-Sph and compared with results obtained by TLC. The rate of the reaction was linear up to 20 µg of protein and was similar using both methods (Fig. 5A). HEK cells transfected with CerS5 were also assayed using either increasing amounts of protein (Fig. 5B) or reaction times (Fig. 5C), as were CerS2 or CerS4 (not shown), and similar results were obtained using both methods with all three CerSs. Reactions were linear with respect to protein for amounts as low as 1–10 μg for CerS5 and 1–20 μg for CerS6, and up to 70 µg of protein for CerS2 and CerS4 (Fig. 6A). Likewise, reactions were linear with respect to time for up to 20 min with CerS5 and CerS6 and 60 min with CerS2 and CerS4 (Fig. 6B). Importantly, for CerSs that display high levels of activity, assays can be performed for as short a time as 5 min using as little as 5 µg of protein, which gives similar results to those obtained previously using [4,5-3H]Sph (24). Some of the CerSs (i.e., CerS2 and CerS4), display lower activity than others (i.e., CerS5), as previously reported (10, 22, 25).
Fig. 5.
Comparison of CerS assays using TLC or SPE columns. A: Homogenates of nontransfected HEK cells were assayed in 20 μl reaction volume with increasing amounts of protein with 15 μM NBD-Sph, 50 μM C16-CoA (upper) or C24:1-CoA (lower), and 20 μM defatted BSA, at 37°C. NBD-Sph and NBD-ceramide were separated by TLC (gray) or by SPE columns (black). B: Homogenates of CerS5-overexpressing cells were assayed as in A with C16-CoA. Results are ± SD of a typical experiment repeated three times with similar results. C: Homogenates (10 μg of protein in 20 µl) were prepared from CerS5-overexpressing cells and were assayed for increasing amounts of time. Results are means ± SEM of two to three independent experiments.
Fig. 6.
CerS activity using the optimized assay procedure. A: Assays were performed using different amounts of protein from HEK cells overexpressing the indicated CerS; the acyl-CoA was chosen according to the specificity of the particular CerS (i.e., C24:1-CoA for CerS2, C20-CoA for CerS4, and C16-CoA for CerS5 and CerS6). CerS2 and CerS4 were assayed for 30 min, and CerS5 and CerS6 for 10 min. Results are means ± SEM; n = 2–5. B: Assays were performed using different reaction times. CerS2 and CerS4 were assayed with 40 μg of protein, and CerS5 and CerS6 with 10 µg of protein. Results are means ± SEM; n = 2–5.
In summary, we have developed a rapid and reliable method for assaying CerS activity in small amounts of biological material using SPE column chromatography. Moreover, a large number of assays can be run simultaneously by using a multichamber pipettor and performing the activity in a 96-well PCR plate. The assay alleviates the need to use TLC as a separation method and thus requires much lower levels of organic solvents.
Although similar results were obtained in the current study using TLC separation and SPE-C18 column chromatography, the use of SPE-C18 columns provides a number of advantages, not least the accessibility of the method for laboratories that do not routinely assay enzymes of lipid metabolism. A major advantage of the SPE-C18 columns is the ability to assay up to 96 samples at once, whereas assaying 96 samples by TLC would require 10 or 11 TLC plates, thus saving considerable time and effort. In terms of time, assaying 96 samples by the classical TLC method, including quantification (by either scraping the silica and counting in a fluorimeter or analysis using a phosphorimager) and data analysis, could take as long as 3 days, whereas only 1 day is needed for the same number of reactions using SPE-C18 columns (due to the short times of separation on the columns, the possibility of running multiples samples together, and the ease of quantification by placing the 96-well plate directly in a fluorescent ELISA reader). Thus, although the SPE-C18 columns are somewhat more expensive than TLC plates, the time saved in personnel costs renders the SPE-C18 columns more efficient and economical.
Because CerSs appear to be involved in the pathology of a number of human diseases (15–19), the assay that we have described in this study might prove useful in a clinical setting. Furthermore, SPE column chromatography could be used to assay other enzymes of sphingolipid metabolism for which fluorescent substrates (26) are available.
Acknowledgments
The authors thank Tammar Joseph (Weizmann Institute of Science) for her help and advice and Yigal Shachar (Weizmann Institute of Science) for help optimizing the use of the vacuum pump.
Footnotes
Abbreviations:
- CerS
- ceramide synthase
- NBD-C18-ceramide
- ω(7-nitro-2-1,3-benzoxadiazol-4-yl)-N-stearoyl-d-erythro-sphingosine
- NBD-sphinganine
- ω(7-nitro-2-1,3-benzoxadiazol-4-yl)(2S,3R)-2-aminooctadecane-1,3-diol
- Sph
- sphinganine
- SPE
- solid phase extraction
A. H. Futerman is the Joseph Meyerhoff Professor of Biochemistry at the Weizmann Institute of Science.
REFERENCES
- 1.Lahiri S., Futerman A. H. 2007. The metabolism and function of sphingolipids and glycosphingolipids. Cell. Mol. Life Sci. 64: 2270–2284. [DOI] [PMC free article] [PubMed] [Google Scholar]
- 2.Mullen T. D., Hannun Y. A., Obeid L. M. 2012. Ceramide synthases at the centre of sphingolipid metabolism and biology. Biochem. J. 441: 789–802. [DOI] [PMC free article] [PubMed] [Google Scholar]
- 3.Pewzner-Jung Y., Ben-Dor S., Futerman A. H. 2006. When do Lasses (longevity assurance genes) become CerS (ceramide synthases)? Insights into the regulation of ceramide synthesis. J. Biol. Chem. 281: 25001–25005. [DOI] [PubMed] [Google Scholar]
- 4.Tidhar R., Futerman A. H. 2013. The complexity of sphingolipid biosynthesis in the endoplasmic reticulum. Biochim. Biophys. Acta. 1833: 2511–2518. [DOI] [PubMed] [Google Scholar]
- 5.Hannun Y. A., Obeid L. M. 2011. Many ceramides. J. Biol. Chem. 286: 27855–27862. [DOI] [PMC free article] [PubMed] [Google Scholar]
- 6.Park J-W., Park W-J., Futerman A. H. 2014. Ceramide synthases as potential targets for therapeutic intervention in human diseases. Biochim. Biophys. Acta. 1841: 671–681. [DOI] [PubMed] [Google Scholar]
- 7.Laviad E. L., Kelly S., Merrill A. H., Futerman A. H. 2012. Modulation of ceramide synthase activity via dimerization. J. Biol. Chem. 287: 21025–21033. [DOI] [PMC free article] [PubMed] [Google Scholar]
- 8.Tidhar R., Ben-Dor S., Wang E., Kelly S., Merrill A. H., Futerman A. H. 2012. Acyl chain specificity of ceramide synthases is determined within a region of 150 residues in the Tram-Lag-CLN8 (TLC) domain. J. Biol. Chem. 287: 3197–3206. [DOI] [PMC free article] [PubMed] [Google Scholar]
- 9.Schiffmann S., Birod K., Männich J., Eberle M., Wegner M-S., Wanger R., Hartmann D., Ferreiros N., Geisslinger G., Grösch S. 2013. Ceramide metabolism in mouse tissue. Int. J. Biochem. Cell Biol. 45: 1886–1894. [DOI] [PubMed] [Google Scholar]
- 10.Laviad E. L., Albee L., Pankova-Kholmyansky I., Epstein S., Park H., Merrill A. H., Futerman A. H. 2008. Characterization of ceramide synthase 2: tissue distribution, substrate specificity, and inhibition by sphingosine 1-phosphate. J. Biol. Chem. 283: 5677–5684. [DOI] [PubMed] [Google Scholar]
- 11.Spassieva S., Seo J-G., Jiang J. C., Bielawski J., Alvarez-Vasquez F., Jazwinski S. M., Hannun Y. A., Obeid L. M. 2006. Necessary role for the Lag1p motif in (dihydro)ceramide synthase activity. J. Biol. Chem. 281: 33931–33938. [DOI] [PubMed] [Google Scholar]
- 12.Kageyama-Yahara N., Riezman H. 2006. Transmembrane topology of ceramide synthase in yeast. Biochem. J. 398: 585–593. [DOI] [PMC free article] [PubMed] [Google Scholar]
- 13.Mizutani Y., Kihara A., Igarashi Y. 2005. Mammalian Lass6 and its related family members regulate synthesis of specific ceramides. Biochem. J. 390: 263–271. [DOI] [PMC free article] [PubMed] [Google Scholar]
- 14.Ben-David O., Futerman A. H. 2010. The role of the ceramide acyl chain length in neurodegeneration: involvement of ceramide synthases. Neuromolecular Med. 12: 341–350. [DOI] [PubMed] [Google Scholar]
- 15.Saddoughi S. A., Ogretmen B. 2013. Diverse functions of ceramide in cancer cell death and proliferation. Adv. Cancer Res. 117: 37–58. [DOI] [PubMed] [Google Scholar]
- 16.Grassmé H., Riethmüller J., Gulbins E. 2013. Ceramide in cystic fibrosis. Handb. Exp. Pharmacol. 216: 265–274. [DOI] [PubMed] [Google Scholar]
- 17.Jensen S. A., Calvert A. E., Volpert G., Kouri F. M., Hurley L. A., Luciano J. P., Wu Y., Chalastanis A., Futerman A. H., Stegh A. H. 2014. Bcl2L13 is a ceramide synthase inhibitor in glioblastoma. Proc. Natl. Acad. Sci. USA. 111: 5682–5687. [DOI] [PMC free article] [PubMed] [Google Scholar]
- 18.Eckl K-M., Tidhar R., Thiele H., Oji V., Hausser I., Brodesser S., Preil M-L., Onal-Akan A., Stock F., Müller D., et al. 2013. Impaired epidermal ceramide synthesis causes autosomal recessive congenital ichthyosis and reveals the importance of ceramide acyl chain length. J. Invest. Dermatol. 133: 2202–2211. [DOI] [PubMed] [Google Scholar]
- 19.Mosbech M-B., Olsen A. S. B., Neess D., Ben-David O., Klitten L. L., Larsen J., Sabers A., Vissing J., Nielsen J. E., Hasholt L., et al. 2014. Reduced ceramide synthase 2 activity causes progressive myoclonic epilepsy. Ann. Clin. Transl. Neurol. 1: 88–98. [DOI] [PMC free article] [PubMed] [Google Scholar]
- 20.Russo S. B., Tidhar R., Futerman A. H., Cowart L. A. 2013. Myristate-derived d16:0 sphingolipids constitute a cardiac sphingolipid pool with distinct synthetic routes and functional properties. J. Biol. Chem. 288: 13397–13409. [DOI] [PMC free article] [PubMed] [Google Scholar]
- 21.Kim H. J., Qiao Q., Toop H. D., Morris J. C., Don A. S. 2012. A fluorescent assay for ceramide synthase activity. J. Lipid Res. 53: 1701–1707. [DOI] [PMC free article] [PubMed] [Google Scholar]
- 22.Lahiri S., Lee H., Mesicek J., Fuks Z., Haimovitz-Friedman A., Kolesnick R. N., Futerman A. H. 2007. Kinetic characterization of mammalian ceramide synthases: determination of K(m) values towards sphinganine. FEBS Lett. 581: 5289–5294. [DOI] [PubMed] [Google Scholar]
- 23.Bligh E. G., Dyer W. J. 1959. A rapid method of total lipid extraction and purification. Can. J. Biochem. Physiol. 37: 911–917. [DOI] [PubMed] [Google Scholar]
- 24.Mesika A., Ben-Dor S., Laviad E. L., Futerman A. H. 2007. A new functional motif in Hox domain-containing ceramide synthases: identification of a novel region flanking the Hox and TLC domains essential for activity. J. Biol. Chem. 282: 27366–27373. [DOI] [PubMed] [Google Scholar]
- 25.Riebeling C., Allegood J. C., Wang E., Merrill A. H. J., Futerman A. H. 2003. Two mammalian longevity assurance gene (LAG1) family members, trh1 and trh4, regulate dihydroceramide synthesis using different fatty acyl-CoA donors. J. Biol. Chem. 278: 43452–43459. [DOI] [PubMed] [Google Scholar]
- 26.Van Overloop H., Van der Hoeven G., Van Veldhoven P. P. 2012. A nonradioactive fluorimetric SPE-based ceramide kinase assay using NBD-C(6)-ceramide. J. Lipids. 2012: 404513. [DOI] [PMC free article] [PubMed] [Google Scholar]


