

Abstract
Both brain-resident microglia and peripheral macrophages/monocytes infiltrate into glioma and promote glioma growth. In the present study we analyzed coupling and membrane currents in glioma-associated microglia and macrophages/monocytes and compared this to control and stab wound-associated microglia. Using the Cx3cr1GFP/wt Ccr2RFP/wt knock-in mouse line, we distinguished membrane currents of glioma-associated microglia and macrophages/monocytes in acute brain slices prepared 14-16 days after inoculation of GL261 glioma cells. The current profile of microglia showed inward rectifying currents reminiscent of an intermediate activation state when compared to other disease models or cell culture. Macrophages/monocytes showed a higher specific outward conductance and a significantly lower capacitance indicative of a smaller membrane area than microglia. As controls, we also recorded currents from control microglia and stab wound-associated microglia. Since there are reports of microglial coupling in vitro, we injected biocytin into these cells and analyzed for cell coupling after fixing the slices and processed for biocytin labeling with Cy3- conjugated-Streptavidin. Neither control microglia nor glioma-associated microglia and macrophages/monocytes nor stab wound-associated microglia showed any sign of coupling. Moreover, performing qRT-PCR revealed that no connexin43 was detectable on isolated and sorted glioma-associated microglia and macrophages/monocytes, indicating that these cells are not part of a coupled network.
Keywords: Glioma-associated microglia, glioma-associated macrophages/monocytes, glioma, gap junctions, electrophysiology
Introduction
Microglia cells are the innate immune cells of the CNS and participate in the adaptive immune response. They enter the brain early during development, distribute throughout the brain and acquire a ramified morphological phenotype. Microglia are considered highly sensitive detectors for pathological signals and undergo rapid functional changes in all types of brain diseases or injuries, including gliomas which belong to the most malignant tumors.
Microglia and blood derived macrophages/monocytes make up the largest population of tumor- infiltrating cells, and contribute up to one third of the total tumor mass [2, 11]. Glioma-associated microglia (GAM) show an amoeboid morphology and accumulate in glioma. Glioma-associated macrophages/monocytes (GAMPs) also invade into glioma from the blood system. GAMs and GAMPs have been shown to promote glioma growth and invasion and thus are tumor-supportive cells [5, 15, 26]. Glioma-derived factors reprogram microglial cells into a tumor-supporting, immuno-suppressed phenotype, that participates in remodeling of the extracellular matrix to promote infiltrative growth of glioma [7].
The Cx3cr1GFP/wt Ccr2RFP/wt strain [22] allows the discrimination of GAMs and GAMPs in the brain slices. We recorded the membrane currents from GAMs and GAMPs and found that they were different. Electrophysiological properties can be regarded as an indicator for the microglial activation state in vitro and in vivo [1]. In the undisturbed brain, microglia are characterized by the lack of voltage-gated ion channels [1]. Upon activation, for instance after facial nerve axotomy, microglia express an inward rectifying potassium conductance within 12h and a delayed outward rectifier is expressed 24h after the insult [1]. Membrane currents of macrophages/monocytes have been studied in a mouse stroke model and are characterized by in- and outward currents [13].
As glioma cells are coupled by gap junctions (GJs) with host astrocytes [12], we asked whether GAMs and GAMPs are also part of that syncytium. GJs are comprised of a family of integral membrane proteins known as connexins (Cxs) that are named according to their predicted molecular mass, among them Cx43 [28]. A number of in vitro reports indicate that microglia express connexins and show gap junctional coupling (GJC) in vitro [3, 4, 6, 16, 23]. Although GJC could not be verified in dye- transfer experiments in brain slices in situ, neither in direct brain injury nor in an Aß pathology [27], microglia/macrophages in the tumor context might use the GJ pathway for communication with cells of the tumor microenvironment.
Material and methods
Animals
Animals were kept and bred at the local animal facility. Animal protocols were approved by the Landesamt für Gesundheit und Soziales (LaGeSo) of the Berlin Senate (G0438-12). To identify microglia we used the Cx3cr1GFP/wt [8] or the MacGreen mouse line [24]. To distinguish between glioma-associated microglia and invading monocytes and monocyte-derived macrophages, we used Cx3cr1GFP/wtCcr2RFP/wt mice [22]. For FACS-isolation of microglia and macrophages/monocytes from GL261-implanted and control mice we used C57BL/6 wild-type mice (Charles River Laboratories, Wilmington, MA, USA) (Animal protocol: LaGeSo G0268-10). To identify astrocytes in the cortex we used the hGFAP/eGFP mouse [18].
Surgery and preparation of acute brain slices
GL261 glioma cells were implanted into the cortex/striatum region of 8 to 10-week-old mice [26]. As control, a stab wound lesion was induced in the contralateral cortex by inserting a syringe without injecting tumor cells. 14-16 days after tumor inoculation or stab wound lesion, acute coronal brain slices were prepared from cortex and striatum regions. For details refer to the supplementary material.
Patch-clamp recording and dye-filling
Whole cell patch-clamp recordings were performed using an EPC 10 patch-clamp amplifier combined with the TIDA 5.24 software (HEKA Elektronik, Lambrecht, Germany). Acute brain slices were transferred into the holding chamber mounted on an upright microscope and superfused with ACSF (see supplement) at RT. Cells were visualized with a 60× objective (Zeiss Axioskop 2 FS plus, Zeiss, Oberkochen, Germany). Patch pipettes were pulled from borosilicate capillaries and filled with standard intracellular solution (4mM NaCl, 120mM KCl, 4mM MgCl2, 0.5mM CaCl2, 10mM Hepes, 5mM EGTA, 5mM glucose; pH 7.4) and 0.5% biocytin (to assess coupling). To confirm intracellular access sulforhodamine 101 (SR101, 10μg/ml, Sigma-Aldrich, St. Louis, USA) was added to the solution. For fluorescence imaging, eGFP or RFP and SR101 were excited at 488 or 584nm, and emitted light measured at 530±10nm or 607nm, respectively. In each brain slice, a single cell was dialyzed and recorded for 20min. Capacitative transients were compensated by TIDA 5.24 software. Membrane currents were recorded with a series of voltage steps (10mV each, filtered with 2.9kHz) from a holding potential of -70mV ranging from -160mV to +50mV for 50ms. The membrane capacitance (Cm) was calculated integrating the capacitive current and applying the formula Cm=∫ I*dt/ΔU. We calculated the cell surface based on the median membrane capacitance [pF] for each group assuming a specific membrane capacitance of 1μF/cm2.
Immunohistochemistry and confocal microscopy
After patch clamp recording and dye filling slices were fixed with 4% paraformaldehyde for 1h and subsequently processed for biocytin labeling with Cy3-conjugated-Streptavidin (Jackson Immuno Research/Dianova, Hamburg, Germany) combined with immunostaining for microglia/macrophages, rabbit-anti-Iba1 (ionized calcium-binding adapter molecule; Wako, Neuss, Germany) 1:600. A rabbit polyclonal anti-EGFP antibody (1:200, Invitrogen, Carlsbad, USA) was used to amplify staining of eGFP expressing microglia and DAPI (1:200, Sigma-Aldrich, St. Louis, USA) for staining of nuclei. For further details of immunostaining procedure see [14]. Images for colocalization analysis and quantification of the labeled cells were obtained with a confocal microscope (Leica TCS SP5 or SPE, Solms, Germany) with Leica software (LCS Lite).
Acute cell-isolation, FACS-sorting RNA isolation and PCR/qRT-PCR
Protocols are given in the supplement and in [19].
Data analysis and statistics
For plotting electrophysiological recordings the TIDA software and Excel was used. Dye coupling was analyzed in sequentially acquired confocal stacks with ImageJ. For examination of significance the SPSS software 11.5.1 (Chicago, USA) was used. To analyze the differences in the specific conductance (G) and membrane capacitance (Cm), significances were examined by applying the non-parametric Mann-Whitney-U-test. For the cell membrane potential the One-way ANOVA and Bonferroni Post hoc test were used. P-values of ###p<0.001, ##p<0.01, #p<0.05 were considered statistically significant.
Results
Glioma-associated microglia and macrophages/monocytes express a different membrane current profile
To distinguish between glioma-associated microglia and invading macrophages/monocytes, we used the Cx3cr1GFP/wt Ccr2RFP/wt mouse line in which microglial cells are labeled in green and macrophages/monocytes in both red and green [22]. In the EAE model [22] in brain histology microglia are green and macrophages/monocytes are only red, in gliomas macrophages/monocytes are positive for both colors.
We prepared acute slices from mouse brain 14-16 days after inoculation of GL261 glioma cells and recorded membrane currents of glioma-associated microglia (GAMs) and macrophages/monocytes (GAMPs) with the patch-clamp technique in the whole cell configuration. Current responses to depolarizing and hyperpolarizing voltage steps between 50mV and −160mV were recorded with 10mV increment for 50ms from a holding potential of -70mV. As controls, we recorded currents from microglia in unlesioned frontal cortex and striatum, and from microglia in the stab wound on the contralateral hemisphere of glioma-implanted mice. There were no RFP-positive cells in the control tissue. At the stab wound the vast majority was microglia and we detected only few RFP-positive cells.
As described previously, the control microglia in the unlesioned cortex/striatum show small currents with de- and hyperpolarization with no apparent voltage and time dependence (Fig.1B)[1]. GAMs are characterized by inactivating inward rectifying currents with hyperpolarization and small outward currents with depolarization. GAMPs show smaller inward currents with hyperpolarization and larger delayed activating outward currents with depolarization. Lastly, the microglia in the stab wound area display large inward rectifying currents, and only small outward currents as described previously (Fig.1B)[25]. The specific inward conductances G [nS/pF] of GAMs and GAMPs were not significantly increased or were in a range similar to the control microglia (Fig.2A). Averaged current voltage curves are given in Fig.1C and mean normalized I-V curves (Current Density [pA/pF]) are displayed for each group in Fig.1D. The significant increase of the inward current of stab wound-associated microglia is also apparent in the average I-V curve in Fig.1C.
Figure 1. Morphology and membrane currents of microglia and macrophages/monocytes.
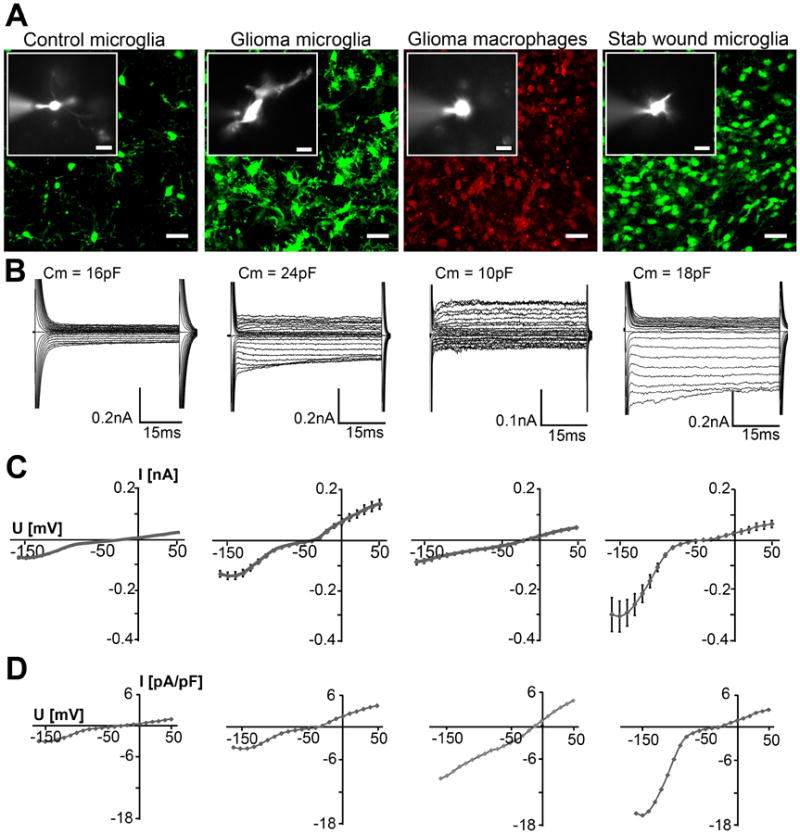
(A) Fluorescent images of eGFP and RFP illustrate the typical ramified morphology of control microglia in unlesioned brain, the amoeboid morphology of GAMs, the round morphology of GAMPs and the morphology in stab wound microglia; scale: 20μm. Small inserted images show a recorded cell dialyzed with SR101; scale: 10μm. (B) Membrane currents from the cells shown in (A), recorded in response to de- and hyperpolarizing voltage steps from -160mV to +50mV for 50ms at a holding potential of -70mV. (C) I-V plots of average currents from all recordings obtained from control microglia, GAMs, GAMPs and stab wound-associated microglia. (D) The mean I-V curves normalized for cell capacitance (Current Density [pA/pF]) are displayed for each group.
Figure 2. Specific membrane conductance, membrane capacitance and membrane potential of microglia and macrophages/monocytes.
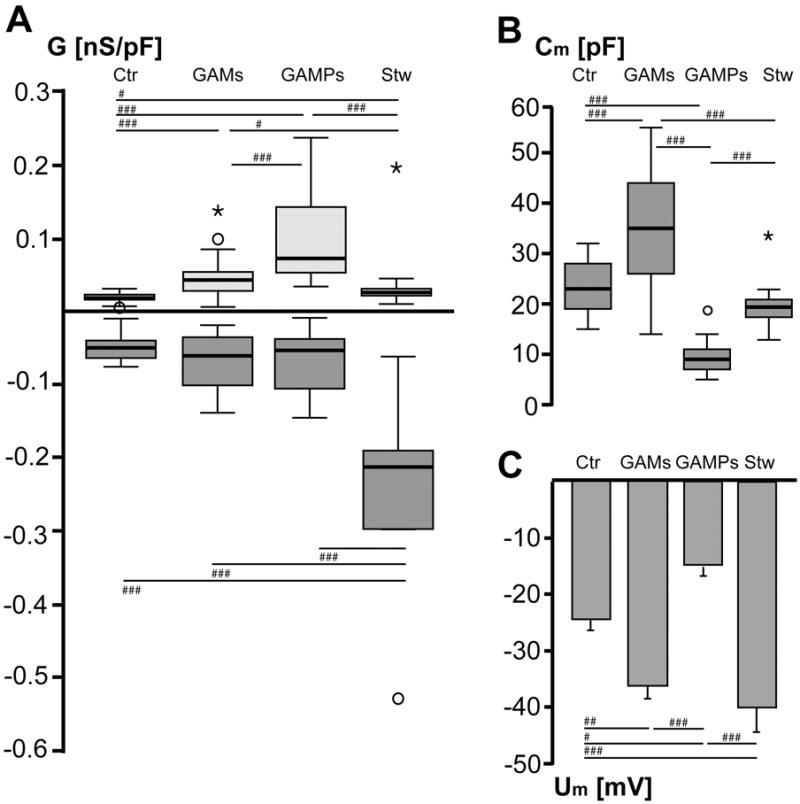
(A) Box plots of outward (light boxes) and inward (dark boxes) conductance normalized to membrane capacitance (G [nS/pF]). Outward conductance was determined between 0 and -20mV, inward conductance between -100 and -120mV and averaged for control microglia (Ctr, n=29), glioma- associated microglia (GAMs, n=19), glioma-associated macrophages/monocytes (GAMPs, n=18) and stab wound-associated microglia (Stw, n=12). Hashmarks indicate significance by applying the Mann- Whitney-U-test (#p<0.05, ##p<0.005, ###p<0.001). (B) Box plots of median membrane capacitance (Cm [pF]) (C) Mean membrane potential (Um [mV]) for the different cell types. Values are given as mean±SEM.
The specific outward conductance was determined from currents activated at 0 and -20mV, and the inward conductance from currents activated at -100 and -120mV. The conductance was normalized with the cell capacitance and the results are presented as box plots (Fig.2A). GAMs and GAMPs showed a significant increase in the specific outward conductance with a median of 0.043nS/pF (25thpercentile=0.028nS/pF, 75thpercentile=0.054nS/pF; n=19) and 0.072nS/pF, respectively (25thpercentile=0.053nS/pF, 75thpercentile=0.143nS/pF; n=18) (Fig.2A) as compared to control MG (median= 0.018nS/pF, 25thpercentile=0.016nS/pF, 75thpercentile=0.023nS/pF; n=29) and stab wound-associated MG (median=0.026nS/pF, 25thpercentile=0.021nS/pF, 75thpercentile=0.03nS/pF; n=12) (Fig.2A). Moreover, the specific outward conductance was significantly higher in GAMPs as compared to GAMs. Specific inward conductance of GAMs and GAMPs was significantly smaller (GAMs: median= -0.061nS/pF, 25thpercentile= -0.101nS/pF, 75thpercentile= -0.035nS/pF; GAMPs: median= - 0.053nS/pF, 25thpercentile= -0.106nS/pF, 75thpercentile= -0.038nS/pF) compared to stab wound- associated microglia (median= -0.213nS/pF, 25thpercentile= -0.298nS/pF, 75thpercentile= -0.191nS/pF), but was not significantly different from control MG (median= -0.05nS/pF, 25thpercentile= - 0.064nS/pF, 75thpercentile= -0.04nS/pF) (Fig.2A).
The membrane potential of GAMs is more negative and the membrane area is increased as compared to control microglia
Microglia cells in the normal physiological brain show a ramified morphological phenotype while GAMs and stab wound-associated microglia display an amoeboid morphology (Fig.1A). GAMPs are also densely packed but are more roundish and lack almost any processes (Fig.1A). The membrane area of a cell is correlated to its membrane capacitance (Fig.2B). The membrane capacitance of GAMs (35.42±2.8pF; corresponds to 3542μm2 assuming a specific membrane capacitance of 1 μF/cm2) was significantly higher as compared to control microglia (23.28±0.96pF; 2328μm2), GAMPs (9.33±0.8pF; 933μm2) and stab wound microglia (19.5±1.5pF; 1950μm2). The membrane capacitance of GAMPs was significantly smaller than that of control microglia (Fig.2B). This indicates that GAMs have a larger, GAMPs a smaller membrane area as compared to control microglia. The membrane potential of GAMs (-36.05±2.27mV) and stab wound-associated microglia (-39.92±4.31mV) was significantly more negative as compared to control (-24.45±1.88mV). GAMPs had a significantly more positive membrane potential (-14.61±1.72mV) as compared to GAMs and stab wound microglia (Fig.2C).
Microglia in normal physiological conditions and glioma-associated microglia/macrophages are not coupled by gap junctions
We investigated whether GJC occurs in microglia/macrophages in the glioma context. To distinguish between GAMs and GAMPs we used the physiological parameter described above, namely the difference in the membrane capacitance. Cells were dialyzed with sulforhodamine101 (SR101) and biocytin during whole cell patch-clamp recordings in Cx3cr1GFP/wt or MacGreen reporter mice [8, 24]. After recording and dialysis, slices were fixed and labeled with Streptavidin-Cy3, immunohistologically counterstained with Iba1 for microglia validation and DAPI for possible coupling to surrounding cells. None of the dye-filled microglia cells in the control tissue (n=20) showed dye-coupling to any other cell confirming that resting microglia are uncoupled[27]. A representative image of a patched/dye-filled microglial cell in the cortex is shown in Fig.3A. Both within the glioma and in the stab wound area the density of glioma-associated microglia/macrophages is markedly increased and they even make direct cell-cell contacts. GAMs (n=12, 29.5±7.25pF) and GAMPs (n=5, 12±1.5pF) were dye-filled and inspected for dye-coupling (Fig.3B,C). We never observed any dye-coupling among microglia/macrophages in the glioma microenvironment, nor to any other neighboring cell. Finally, microglial cells in the stab wound area were probed for GJC. We also could not find any dye-coupling among stab wound microglia (n=6, Fig.3D). As a positive control we patched and dye-filled green-fluorescent astrocytes in the GFAP/eGFP mouse line [18]. As shown in Fig.3E the dye injected into one astrocyte spreads to a network of adjacent cells.
Figure 3. Lack of coupling of microglia and macrophages/monocytes.
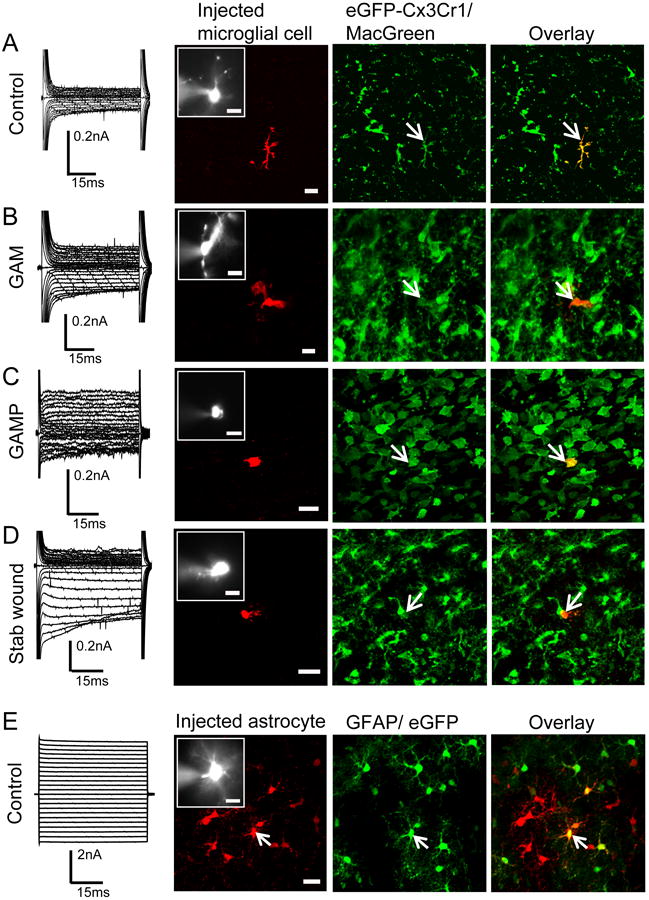
Membrane currents (recorded as described in Fig.1) of a control microglia (A), GAM (B), GAMP (C) a stab wound microglia (D) and an astrocyte are shown on the left. The second column shows the biocytin staining, the third the eGFP-fluorescence (MacGreen mouse (A-D); GFAP/eGFP mouse (E)), the overlay is given in the fourth column, scale: 20μm. The insert in the second column is a magnification of the recorded cell dialyzed with SR101; scale: 10μm. Arrows indicate the injected cell.
FACS isolated GAMs, GAMPs and control microglia do not express Connexin43
Data from cultured microglia indicate the expression of Cx43[4, 6]. We therefore studied the expression of the connexin43 gene in GAMs, GAMPs (isolated from GL261-implanted C57BL/6 mice) vs. control microglia cells. To validate the primer design for Cx43 we first performed sqRT-PCR experiments on total RNA from whole forebrain. We saw strong expression of Cx43 RNA in total brain. We next performed qRT-PCR on FACS-isolated GAMs, GAMPs and control microglia and did not detect any Cx43 gene expression in the microglia/macrophages from the tumor environment nor in control microglia, whereas the whole brain sample which comprises a large population of Cx43 expressing astrocytes showed a clear signal for Cx43 (data not shown).
Discussion
Microglial cells and macrophages/monocytes in vitro express a distinct pattern of K+ channels [9, 10] that can be functionally linked to their activation state. Inward rectifiers are present in cultured cells without additional stimulation. They play a role in the maintenance of the negative resting membrane potential and control of proliferation [9, 10]. Outward potassium conductances are expressed in cultured microglia after inflammatory stimulation with LPS or IFNγ, and are functionally linked to the induction of certain activation parameters, like secretion of inflammatory cytokines, reactive oxygen species or proliferation [17, 21]. In situ patch-clamp recordings revealed three types of current profiles expressed by microglia that correlated to their state of activation. Microglia in the healthy brain show small currents with no time and voltage dependence [1]. In an early stage of activation, e.g. 12h after facial nerve axotomy in the facial nucleus, they express inward rectifying currents and no significant outward conductance and thus can be compared to cultured microglial cells that did not receive inflammatory stimuli. 24h after axotomy, microglia in situ express additional outward rectifying currents upon depolarization, comparable to the pattern found in LPS- or IFNγ - activated microglia in vitro. Prominent inward and outward currents were also found in microglia in stroke tissue 48h after middle artery occlusion [13] or 24h after a stab wound [25]. Here we show that glioma-associated microglia express a current pattern that resembles the early stage of activation as seen 12h after lesion in the facial nucleus, or the unstimulated microglia in vitro. Thus, the characteristic current pattern implies that microglia in the tumor microenvironment remain in an “intermediate down-regulated” activation state suggestive for immune-suppression by the glioma cells.
Using Cx3cr1GFP/wt Ccr2RFP/wt mice, we could distinguish between intrinsic microglia and invading macrophages/monocytes. The macrophages/monocytes had a current profile which was clearly distinct from microglia. They expressed a higher density of the outward rectifier currents and a significantly lower membrane capacitance reflecting a smaller cell membrane area.
There was some evidence for microglial coupling from in vitro studies. Dobrenis et al. [3] showed a gradual transfer of Lucifer Yellow and thus functional coupling of microglia to neurons in co-cultures. However, the percentage of coupled cells was low (<5%) and the networks were very small. Another in vitro study[4] reports that microglia can communicate with each other through GJs after being induced by inflammatory cytokines. Finally, GJ plaques at opposing cell membranes were described for cultured microglial cells [6]. Cx43 is the connexin isoform that is most abundantly expressed by cells of the immune system[20] and has been detected in cultured microglia [4, 6]. Wasseff and Scherer [27] recently reported the lack of GJC both in resting microglia and in activated microglia after brain injury and in a model of Alzheimer's disease. Here we provide evidence that microglia and macrophages/monocytes in a brain tumor do not communicate via GJs, and we confirm the previous observations for resting microglia and activated microglia in traumatic injury [27]. Consistent with the lack of functional GJC, we also could not detect Cx43 expression in acutely FACS-isolated microglia or macrophages from the glioma tissue with our highly sensitive qRT-PCR approach. In conclusion, the dye-coupling studies in acute slices of unlesioned brain and different pathological models do not provide any evidence for functional GJC of microglia/brain macrophages, neither among each other nor with other cells of the brain. Thus, brain immune cells are not part of the glial syncytium.
Supplementary Material
Highlights.
Membrane currents were recorded from glioma-associated microglia and macrophages/monocytes in acute brain slices 14-16 days after inoculation of glioma cells into mouse cortex
These two cell types differ in their specific outward conductance and membrane capacity
Glioma-associated microglia and macrophages/monocytes as well as control microglia and stab wound-associated microglia were not coupled to any other cell
Acknowledgments
The authors are grateful to Andreas Pelz for support with Percoll and FACS isolation, Philipp Jordan for biostatistics consultancy and the German Research Foundation (KE 329/28 and EXC 257 NeuroCure) and NIH Grant (U01CA160882-01A1) for financial support.
Abbreviations
- GAM
Glioma-associated microglia
- GAMP
glioma-associated macrophage
- GJ
gap junction
- GJC
gap junctional coupling
- Cx
connexin
- FACS
fluorescence-activated cell sorting
Footnotes
Publisher's Disclaimer: This is a PDF file of an unedited manuscript that has been accepted for publication. As a service to our customers we are providing this early version of the manuscript. The manuscript will undergo copyediting, typesetting, and review of the resulting proof before it is published in its final citable form. Please note that during the production process errors may be discovered which could affect the content, and all legal disclaimers that apply to the journal pertain.
References
- 1.Boucsein C, Kettenmann H, Nolte C. Electrophysiological properties of microglial cells in normal and pathologic rat brain slices. Eur J Neurosci. 2000;12:2049–2058. doi: 10.1046/j.1460-9568.2000.00100.x. [DOI] [PubMed] [Google Scholar]
- 2.Charles NA, Holland EC, Gilbertson R, Glass R, Kettenmann H. The brain tumor microenvironment. Glia. 2011;59:1169–1180. doi: 10.1002/glia.21136. [DOI] [PubMed] [Google Scholar]
- 3.Dobrenis K, Chang HY, Pina-Benabou MH, Woodroffe A, Lee SC, Rozental R, Spray DC, Scemes E. Human and mouse microglia express connexin36, and functional gap junctions are formed between rodent microglia and neurons. J Neurosci Res. 2005;82:306–315. doi: 10.1002/jnr.20650. [DOI] [PMC free article] [PubMed] [Google Scholar]
- 4.Eugenin EA, Eckardt D, Theis M, Willecke K, Bennett MV, Saez JC. Microglia at brain stab wounds express connexin 43 and in vitro form functional gap junctions after treatment with interferon-gamma and tumor necrosis factor-alpha. Proc Natl Acad Sci U S A. 2001;98:4190–4195. doi: 10.1073/pnas.051634298. [DOI] [PMC free article] [PubMed] [Google Scholar]
- 5.Gabrusiewicz K, Ellert-Miklaszewska A, Lipko M, Sielska M, Frankowska M, Kaminska B. Characteristics of the alternative phenotype of microglia/macrophages and its modulation in experimental gliomas. PLoS One. 2011;6:e23902. doi: 10.1371/journal.pone.0023902. [DOI] [PMC free article] [PubMed] [Google Scholar]
- 6.Garg S, Md Syed M, Kielian T. Staphylococcus aureus-derived peptidoglycan induces Cx43 expression and functional gap junction intercellular communication in microglia. J Neurochem. 2005;95:475–483. doi: 10.1111/j.1471-4159.2005.03384.x. [DOI] [PMC free article] [PubMed] [Google Scholar]
- 7.Hanisch UK, Kettenmann H. Microglia: active sensor and versatile effector cells in the normal and pathologic brain. Nat Neurosci. 2007;10:1387–1394. doi: 10.1038/nn1997. [DOI] [PubMed] [Google Scholar]
- 8.Jung S, Aliberti J, Graemmel P, Sunshine MJ, Kreutzberg GW, Sher A, Littman DR. Analysis of fractalkine receptor CX(3)CR1 function by targeted deletion and green fluorescent protein reporter gene insertion. Mol Cell Biol. 2000;20:4106–4114. doi: 10.1128/mcb.20.11.4106-4114.2000. [DOI] [PMC free article] [PubMed] [Google Scholar]
- 9.Kettenmann H, Hanisch UK, Noda M, Verkhratsky A. Physiology of microglia. Physiol Rev. 2011;91:461–553. doi: 10.1152/physrev.00011.2010. [DOI] [PubMed] [Google Scholar]
- 10.Kettenmann H, Hoppe D, Gottmann K, Banati R, Kreutzberg G. Cultured microglial cells have a distinct pattern of membrane channels different from peritoneal macrophages. J Neurosci Res. 1990;26:278–287. doi: 10.1002/jnr.490260303. [DOI] [PubMed] [Google Scholar]
- 11.Li W, Graeber MB. The molecular profile of microglia under the influence of glioma. Neuro Oncol. 2012;14:958–978. doi: 10.1093/neuonc/nos116. [DOI] [PMC free article] [PubMed] [Google Scholar]
- 12.Zhang W, Couldwell WT, Simard MF, Song H, Lin JH, Nedergaard M. Direct gap junction communication between malignant glioma cells and astrocytes. Cancer Res. 1999;59:1994–2003. [PubMed] [Google Scholar]
- 13.Lyons SA, Pastor A, Ohlemeyer C, Kann O, Wiegand F, Prass K, Knapp F, Kettenmann H, Dirnagl U. Distinct physiologic properties of microglia and blood-borne cells in rat brain slices after permanent middle cerebral artery occlusion. J Cereb Blood Flow Metab. 2000;20:1537–1549. doi: 10.1097/00004647-200011000-00003. [DOI] [PubMed] [Google Scholar]
- 14.Maglione M, Tress O, Haas B, Karram K, Trotter J, Willecke K, Kettenmann H. Oligodendrocytes in mouse corpus callosum are coupled via gap junction channels formed by connexin47 and connexin32. Glia. 2010;58:1104–1117. doi: 10.1002/glia.20991. [DOI] [PubMed] [Google Scholar]
- 15.Markovic DS, Vinnakota K, Chirasani S, Synowitz M, Raguet H, Stock K, Sliwa M, Lehmann S, Kalin R, van Rooijen N, Holmbeck K, Heppner FL, Kiwit J, Matyash V, Lehnardt S, Kaminska B, Glass R, Kettenmann H. Gliomas induce and exploit microglial MT1-MMP expression for tumor expansion. Proc Natl Acad Sci U S A. 2009;106:12530–12535. doi: 10.1073/pnas.0804273106. [DOI] [PMC free article] [PubMed] [Google Scholar]
- 16.Martinez AD, Eugenin EA, Branes MC, Bennett MV, Saez JC. Identification of second messengers that induce expression of functional gap junctions in microglia cultured from newborn rats. Brain Res. 2002;943:191–201. doi: 10.1016/s0006-8993(02)02621-5. [DOI] [PubMed] [Google Scholar]
- 17.Newell EW, Schlichter LC. Integration of K+ and Cl- currents regulate steady-state and dynamic membrane potentials in cultured rat microglia. J Physiol. 2005;567:869–890. doi: 10.1113/jphysiol.2005.092056. [DOI] [PMC free article] [PubMed] [Google Scholar]
- 18.Nolte C, Matyash M, Pivneva T, Schipke CG, Ohlemeyer C, Hanisch UK, Kirchhoff F, Kettenmann H. GFAP promoter-controlled EGFP-expressing transgenic mice: a tool to visualize astrocytes and astrogliosis in living brain tissue. Glia. 2001;33:72–86. [PubMed] [Google Scholar]
- 19.Olah M, Raj D, Brouwer N, De Haas AH, Eggen BJ, Den Dunnen WF, Biber KP, Boddeke HW. An optimized protocol for the acute isolation of human microglia from autopsy brain samples. Glia. 2012;60:96–111. doi: 10.1002/glia.21251. [DOI] [PubMed] [Google Scholar]
- 20.Oviedo-Orta E, Howard Evans W. Gap junctions and connexin-mediated communication in the immune system. Biochim Biophys Acta. 2004;1662:102–112. doi: 10.1016/j.bbamem.2003.10.021. [DOI] [PubMed] [Google Scholar]
- 21.Pannasch U, Farber K, Nolte C, Blonski M, Yan Chiu S, Messing A, Kettenmann H. The potassium channels Kv1.5 and Kv1.3 modulate distinct functions of microglia. Mol Cell Neurosci. 2006;33:401–411. doi: 10.1016/j.mcn.2006.08.009. [DOI] [PubMed] [Google Scholar]
- 22.Saederup N, Cardona AE, Croft K, Mizutani M, Cotleur AC, Tsou CL, Ransohoff RM, Charo IF. Selective chemokine receptor usage by central nervous system myeloid cells in CCR2- red fluorescent protein knock-in mice. PLoS One. 2010;5:e13693. doi: 10.1371/journal.pone.0013693. [DOI] [PMC free article] [PubMed] [Google Scholar]
- 23.Saez PJ, Shoji KF, Retamal MA, Harcha PA, Ramirez G, Jiang JX, von Bernhardi R, Saez JC. ATP is required and advances cytokine-induced gap junction formation in microglia in vitro. Mediators Inflamm. 2013;2013:216402. doi: 10.1155/2013/216402. [DOI] [PMC free article] [PubMed] [Google Scholar]
- 24.Sasmono RT, Oceandy D, Pollard JW, Tong W, Pavli P, Wainwright BJ, Ostrowski MC, Himes SR, Hume DA. A macrophage colony-stimulating factor receptor-green fluorescent protein transgene is expressed throughout the mononuclear phagocyte system of the mouse. Blood. 2003;101:1155–1163. doi: 10.1182/blood-2002-02-0569. [DOI] [PubMed] [Google Scholar]
- 25.Seifert S, Pannell M, Uckert W, Farber K, Kettenmann H. Transmitter- and hormone- activated Ca(2+) responses in adult microglia/brain macrophages in situ recorded after viral transduction of a recombinant Ca(2+) sensor. Cell Calcium. 2011;49:365–375. doi: 10.1016/j.ceca.2011.03.005. [DOI] [PubMed] [Google Scholar]
- 26.Vinnakota K, Hu F, Ku MC, Georgieva PB, Szulzewsky F, Pohlmann A, Waiczies S, Waiczies H, Niendorf T, Lehnardt S, Hanisch UK, Synowitz M, Markovic D, Wolf SA, Glass R, Kettenmann H. Toll-like receptor 2 mediates microglia/brain macrophage MT1-MMP expression and glioma expansion. Neuro Oncol. 2013;15:1457–1468. doi: 10.1093/neuonc/not115. [DOI] [PMC free article] [PubMed] [Google Scholar]
- 27.Wasseff SK, Scherer SS. Activated microglia do not form functional gap junctions in vivo. J Neuroimmunol. 2014;269:90–93. doi: 10.1016/j.jneuroim.2014.02.005. [DOI] [PMC free article] [PubMed] [Google Scholar]
- 28.Willecke K, Eiberger J, Degen J, Eckardt D, Romualdi A, Guldenagel M, Deutsch U, Sohl G. Structural and functional diversity of connexin genes in the mouse and human genome. Biol Chem. 2002;383:725–737. doi: 10.1515/BC.2002.076. [DOI] [PubMed] [Google Scholar]
Associated Data
This section collects any data citations, data availability statements, or supplementary materials included in this article.