FIGURE 4.
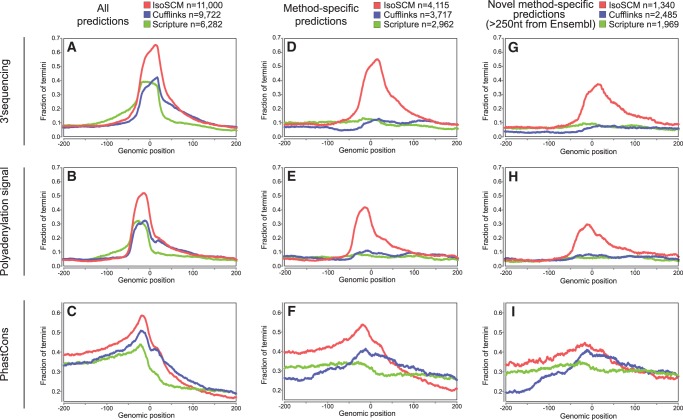
Evaluating spatial accuracy of 3′ end predictions. Analysis of all 3′ ends reported by each method shows the frequency of 3′-seq evidence (A), canonical PAS (B), and genomic conservation (C) relative to predicted termini. The fraction of predicted 3′ end sites with the indicated type of support within 20 nt is shown at each position relative to the predicted boundary. The peak position of the PAS and 3′-seq tags are at their characteristic locations, about −21 and 0, respectively, while average PhastCons show characteristic peaked conservation at −21. All of these features are most robust for IsoSCM termini. (D–F) Positional enrichment of features examined for all method-specific ends, defined as termini that are >100 nt away from those generated by the other methods. Here, IsoSCM is the only method with substantial enrichment of 3′-seq evidence (D) and PAS (E) in the appropriate locations. The IsoSCM-specific annotations also exhibit the most robust conservation signature at these termini (F). (G–I) Positional enrichment of features examined for all method-specific ends that are “substantially novel,” defined as being located >250 nt from Ensembl termini and >100 nt away from other method predictions. Again, IsoSCM is the only method that displays the expected enrichment of polyadenylation site features for this subset of predicted 3′ ends.

