

Abstract
Base pairing in nucleic acids plays a crucial role in their structure and function. Differences in the base pair opening and closing kinetics of individual double stranded DNA sequences or between chemically modified base pairs provide insight into the recognition of these base pairs by DNA processing enzymes. This unit describes how to quantify the kinetics for localized base pairs by observing changes in the imino proton signals by nuclear magnetic resonance spectroscopy. The determination of all relevant parameters using state of the art techniques and NMR instrumentation, including cryoprobes, is discussed.
Keywords: base pair opening, exchange kinetics, imino-exchange, longitudinal water relaxation NMR, nucleic acids, T1, high Q-probes, radiation damping
INTRODUCTION
Nuclear magnetic resonance (NMR) proton exchange has been widely used to elucidate the structural dynamics of proteins and nucleic acids (Kochoyan, Leroy et al. 1990, Leijon and Groeslund 1992, Gueron and Leroy 1995, Folta-Stogniew and Russu 1996, Dhavan, Lapham et al. 1999, Dornberger, Leijon et al. 1999, Priyakumar and MacKerell 2006, Every and Russu 2007, Every and Russu 2008, Crenshaw, Wade et al. 2011, Friedman, Jiang et al. 2011, Every and Russu 2013). As a probe of structural properties, the kinetics of base pair opening forms a useful complement to structure determination by NMR. The structure and function of nucleic acids are directly related to the formation of base pairs, which therefore are of crucial importance. The opening and closing of individual base pairs is a natural process and a vital part of the DNA repair process. Disruption of base pairing leads to local destabilization of the DNA duplex and in the extreme case to unwinding, hence it directly affects replication and transcription as well (Sancar, Lindsey-Boltz et al. 2004).
Many biophysical studies describe the global changes the DNA duplex undergoes during melting (Plum and Breslauer 1994, Sinden 1994, Duguid, Bloomfield et al. 1996, Bustamante, Smith et al. 2000, Rouzina and Bloomfield 2001). NMR on the other hand provides a powerful tool to locally monitor the kinetics of each base pair opening under physiological conditions. The most common NMR approach to determine these local opening/closing rates relies on the 1H NMR measurement of the proton exchange between water and the imino protons after magnetization transfer (Gueron, Kochoyan et al. 1987, Gueron, Charretier et al. 1990, Moe and Russu 1992, Folta-Stogniew and Russu 1996, Dhavan, Lapham et al. 1999, Dornberger, Leijon et al. 1999, Chen and Russu 2004, Every and Russu 2007, Every and Russu 2008, Lee, Lee et al. 2009, Parker and Stivers 2010, Crenshaw, Wade et al. 2011, Friedman, Jiang et al. 2011, Every and Russu 2013, Szulik, Voehler et al. 2013). Depending on the base pair stability, base pair opening occurs more or less frequently, allowing for the imino proton to exchange with water. If the water signal is selectively spin-labeled, magnetization of the water will be transferred to the imino proton, causing a change in the imino proton signal (Gueron and Leroy 1995, Snoussi and Leroy 2001).
This unit describes a method for the investigation of DNA base pair opening using proton exchange NMR spectroscopy. While the basic methods from the original literature remain the same, new elements will be described to accommodate the latest developments in NMR hardware, such as high-Q probes (Kovacs, Moskau et al. 2005).
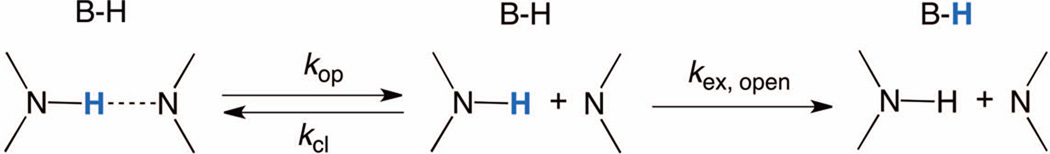
The utilization of NMR imino proton exchange experiments to monitor the kinetics of opening of individual base pairs was pioneered by Guéron and co-workers (Gueron, Kochoyan et al. 1987, Gueron, Charretier et al. 1990). The kinetic analysis relies on a two-state model of base pair opening, where the base pair undergoes conformational change from the closed to the open state, from which the imino proton is exchanged (see Figure 1). [*Copy Editor: Please confirm with author that this is the correct place to cite figure 1.] The analysis of the exchange data is based on the interpretation of the imino proton exchange with water in the presence of catalysis by proton acceptors with the corresponding exchange at the mononucleoside level according to equation 1.
| (1) |
Figure 1.
Scheme illustrating the two-state model of the imino proton exchange with proton acceptor present in the solution.
I(t) is the intensity of the resonance at the exchange time t, I0 the intensity at equilibrium, kex the exchange rate, E the efficiency of water inversion, R1w the longitudinal relaxation rate of water protons, and R1n the longitudinal relaxation rate plus exchange rate of the protons of interest. The exchange rate for the imino protons at any given catalyst concentration is determined following Basic Protocol 4. As can be seen from equation (1), several other parameters such as R1w, R1n, and E are prerequisites to solving this equation and must be determined separately as described in protocols 2, 3, and 5, respectively. E depends mostly on the hardware used and R1w on the measurement temperature. Therefore, these parameters do not have to be determined each time. Measurements of multiple kex values at increasing base catalyst amounts are required to fit the data to equation (7) and calculate the base pair opening/closing kinetics.
BASIC PROTOCOL 1
Sample preparation
To obtain good quality NMR data, pure duplex DNA sample at the highest possible concentration should be used. The oligonucleotides may be obtained commercially or synthesized in the laboratory. Usually, oligonucleotides, either unmodified or containing adducts and/or modified bases, are synthesized using standard phosphoramidite chemistry in an automated DNA synthesizer (Vu, McCollum et al. 1990). However, specific modifications to the standard automated phosphoramidite chemistry protocols might be required. To assure the highest sample purity, the modified and unmodified oligonucleotides should first be purified by anion-exchange chromatography (AE-HPLC), and by reversed-phase high performance liquid chromatography (RP-HPLC) in the second step, followed by desalting using gel filtration. The lyophilized and desalted oligonucleotides should be dissolved in an appropriate buffer, and annealed.
Materials
Purified and desalted DNA samples
Sodium phosphate buffer at desired pH
Sodium chloride, NaCl
Ethylenediaminetetraacetic acid, sodium salt, Na2EDTA
Triethanolamine, TEOA
Deionized H2O
D2O (99.99%)
Ammonium hydroxide, NH4OH
Hydrochloric acid, HCl
Sodium hydroxide, NaOH
Preparation of DNA in the NMR buffer, and stock solutions of ammonia base catalyst
Prepare a 10 mM sodium phosphate NMR buffer at desired pH, containing 100 mM NaCl, 1mM Na2EDTA, 1mM TEOA, 95% deionized H2O and 5% D2O. The sodium phosphate buffer may be prepared according to the published recipe (Sambrook and Green 2012), 3rd Edition, 2001, Appendix 1.5. [*Copy Editor: Please share the recipe from our Appendix with the authors and ask if it can be referenced in place of the Sambrook reference.]
Prepare stock solutions of ammonia base catalyst (in the range of 0.1 – 5.0 M), at the same pH as chosen for the NMR buffer, by combining 20 % (v/v) ammonium hydroxide with the 10 mM sodium phosphate buffer, 1.0 mM Na2EDTA, and 1 mM TEOA. Adjust pH using HCl and/or NaOH.
Sonicate each stock solution prepared in steps 1 and 2 in a water bath for 30 min to minimize the dissolved oxygen content.
-
In a 0.5 mL microcentrifuge tube, dissolve the lyophilized DNA sample with 180 µL NMR buffer. Transfer DNA-buffer solution into 3 mm NMR tube.
Unmodified DNA samples prepared this way are stable for weeks when kept in the refrigerator at 4°C. Modified DNA samples might be less stable, depending on the type of modification.
Sonicate the final DNA sample in the NMR tube prior to NMR data collection as described in step 3.
BASIC PROTOCOL 2
Measurement of the T1 relaxation time of water using the saturation-recovery method
Bulk water molecules are an integral part of the exchange kinetics and their T1-relaxation, also called longitudinal relaxation, plays an important role in the determination of the exchange kinetics [see equation (1)]. Due to the high concentration of bulk water in these samples, the standard inversion recovery method to determine the T1-relaxation of water is not readily applicable. This Basic Protocol 2 describes a modified NMR measurement, using the saturation-recovery method (Mao, Guo et al. 1994, Mao and Ye 1997, Taylor and Peterson 2010). In the Alternate Protocol 2, we describe a special, but not commonly available setup, using 1 mm NMR tubes, which allows the use of the inversion recovery measurement even with high Q cryoprobes and 95% H2O in these samples (see further discussion under “COMMENTARY, T1 relaxation time of water”).
Materials
3 mm NMR tube containing double stranded DNA in NMR buffer and 5% D2O (see Basic Protocol 1).
High-field NMR spectrometer (AV-III, Bruker Biospin, Billerica, MA) equipped with quadruple nuclei (1H, 13C, 15N, and 31P) cryogenically cooled probe with z-gradient.
Take the 3 mm NMR tube with DNA sample, as prepared in Basic Protocol 1, and insert it with the appropriate spinner into the magnet. The probe should be set to the desired temperature and the sample equilibrated inside the probe for 10–20 min before continuing.
- Follow standard procedure to set-up an experiment on the spectrometer including the following steps:
- Lock the spectrometer on the provided deuterium signal (5% D2O).
- Tune and match the probe.
- Shim the sample for maximum field homogeneity utilizing the automated, field gradient shim routine.
- Set the transmitter to the water signal to minimize any off-resonance effects.
- Use a regular one-pulse, single scan 1D proton experiment to determine the condition under which a proton signal for this sample still can be determined with respect to the receiver gain and pulse length at a specific pulse power.
- Set the receiver gain to a small value and the pulse power reduced, so that a 5–10 µs can still be applied. On the current spectrometer the receiver gain was set to 1 (max 203) and a pulse power of 0.1 W allowed for a 10 µs pulse without any receiver overload.
Optimize the transmitter offset and pre-saturation power on a standard pre-saturation experiment. Typical pre-saturation powers were in the range of 0.3–3 µW (65–55 dB).
- Use the saturation-relaxation measurement pulse sequence as shown in the Support Protocol 2, a modified pre-saturation pulse sequence with pseudo-2D sampling scheme for varying delay times, where the 1D spectra are arrayed in a serial Free Induction Decay (FID) file.
- The modifications consist of a variable delay time inserted between the CW pre-saturation time, which also serves as the recycling delay, and the read-out pulse. The variable delay is corrected to account for the power switching delay during this time period. An 8-step phase cycle (x, x, −x, −x, y, y, −y, −y) for the read-out pulse and receiver is implemented and the pseudo-2D scheme is used to increment the variable delay times.
- The parameters are in general analog to the water pre-saturation experiment. Set the relaxation delay to about 20 sec to be at least 5 times the anticipated T1 relaxation time. Use the lower end pre-saturation power as determined in step 4 b) (about 0.3 µW or 65 dB on our spectrometer). Set the read-out pulse and the receiver gain according to the parameters determined in step 3), and set up a variable delay lists of 16 to 24 values between 5 msec and 20 sec. An experiment of 4 dummy scans and 8 acquisition scans with 24 delay times took about 100 min.
- Analyze the data as follows:
- Set the apodization of the FID to an exponential window function with a time constant of two, followed by a Fourier transformation.
- Perform an automatic baseline correction between 8 and 2 ppm.
- To obtain the T1-relaxation value, perform the exponential fit of the peak area data using the T1/T2 Module of the program TopSpin 3.2 (Bruker Biospin, Billerica, MA).
T1-values for the 2mM sucrose standard test sample and DNA samples in NMR buffer and 90% water, 10% D2O at 298K and 288K measured this way, were in good agreement to the ones reported by Simpson at 298K and 288K (Simpson and Carr 1958) (Table 1).
Table 1.
Values for longitudinal relaxation (T1) of water at 288K and 298K and varying buffer conditions measured by the saturation-recovery method, unless otherwise indicated. The reference sample was described as “ordinary water”, where the oxygen has been removed by flushing the sample with helium. A sample (3 or 1 mm tube) of deionized H2O/D2O 95:5, degassed, was used for comparison. The Sucrose standard sample (5mm tube) contains 2 mM sucrose, 0.5 mM 4,4-dimethyl-4-silapentane-1-sulfonic acid (DSS), 2 mM sodium azide (NaN3) in H2O/D2O 9:1. The DNA sample (3 or 1 mm tube) contained the above described NMR buffer, with or without 10 mM NH3, respectively. Additional tests showed consistent T1-values regardless of the tube diameter used, including 5 mm and 1.7 mm tubes.
| T1 [sec], 288K | T1 [sec], 298K | |
|---|---|---|
| Reference (Simpson and Carr 1958) | 2.55 | 3.37 |
| Water sample (H2O/D2O 95:5), 3mm | 2.64± 0.01 | 3.53 ± 0.01 |
| Water sample (H2O/D2O 95:5), 1mm | 2.65± 0.02 | 3.56 ± 0.01 |
| Water sample (H2O/D2O 95:5), 1mm* | 2.71 ± 0.01 | 3.55 ± 0.01 |
| Sucrose standard sample | 2.66 ± 0.01 | 3.46 ± 0.09 |
| DNA Sample in NMR buffer, 3mm | 2.61 ± 0.03 | 3.48 ± 0.01 |
| DNA Sample in NMR buffer, 1mm | 2.67± 0.07 | 3.46 ± 0.03 |
| DNA Sample in NMR buffer, 1mm* | 2.73± 0.01 | 3.49 ± 0.01 |
| DNA Sample in NMR buffer and 10 mM NH3 | 2.50 ± 0.05 | 3.14 ± 0.01 |
Measured by the standard inversion recovery method
ALTERNATE PROTOCOL 2
T1 relaxation time of water using the standard inversion-recovery method [*Copy Editor: OK for this to be a paragraph-style protocol.]
As an alternative to the saturation-recovery method, to determine the longitudinal relaxation of water, a sample of 20 µL of H2O/D2O (95:5) buffer can be measured with the standard inversion recovery method in a 1 mm NMR tube. Since this small tube contains a very limited amount of water, its π and π/2 pulse can be determined directly. A small radiation damping effect might still be observed during the π pulse determination, but disappears when de-shimming the X and Y shims by a 1000 and 3000 units respectively. De-shimming is preferred over the commonly used de-tuning and de-matching method, since it maintains the short π and π/2 pulses, which are important for the inversion recovery method.
A standard π - variable delay - π/2 inversion recovery experiment on samples containing just DNA buffer or water yielded the same T1-relaxation times as measured by the saturation-recovery method as shown in Table 1. Analysis of the data was within 0.1 sec regardless of whether the area or intensity of the signal was used, indicating the absence of radiation damping under these conditions.
This measurement provides a valid alternative to the saturation-recovery technique using standard pulse sequences. It is generally preferred to perform all measurements under the same conditions, e.g. in the same NMR tube and instrumental setup. Therefore we opted to use the modified saturation-recovery method as our standard way to determine the T1-relaxation of the water.
SUPPORT PROTOCOL 2 [*Copy Editor: This is the first “support protocol”; the authors matched the numbering to the Basic Protocol. Allen recommends that all 4 of these “support protocols be turned into figures. Use the title as the legend. You should probably include the blurb and disclaimer below in each of the legends.]
The pulse sequences listed in the Support Protocols have been implemented on a Bruker AV-III instrument running Topsin 3.2pl5. Similar standard Bruker pulse sequences served as the bases for these modifications.
Disclaimer: These pulse programs are provided "as is" basis. The use and implementation of these programs may be instrument-specific. The authors strongly encourage consultation with local NMR facility managers before implementing new pulse sequences, so as to prevent NMR probe damage that might be incurred by the use of these programs.
Pulse Sequence for saturation recovery measurement
;t1ir_highQ_1.mv
;avance-version (12/01/11)
;T1 measurement using saturation-recovery method
;Adapted for high Q probes and H2O samples, M. Voehler, 3/2012

prosol relations=<triple>

#include <Avance.incl>
#include <Grad.incl>
#include <Delay.incl>

"p2=p1*2"
"d11=30m"

"acqt0=−p1*2/3.1416"

1 ze
2 30m
  "TAU=vd-d12"
  d12 pl9:f1
  d1 cw:f1 ph29
  4u do:f1
  d12 pl1:f1
  TAU
  p1 ph2
  go=2 ph31
  d11 wr #0 if #0 ivd
  lo to 1 times td1
exit

ph1=0 2
ph2=0 0 2 2 1 1 3 3
ph29=0
ph31=0 0 2 2 1 1 3 3

;pl1 : f1 channel - power level for pulse (default)
;pl9 : f1 channel - power level for presaturation
;p1 : f1 channel -  90 degree high power pulse
;p2 : f1 channel - 180 degree high power pulse
;d1 : relaxation delay; 1–5 * T1
;d11: delay for disk I/O                   [30 msec]
;d12: delay for power switching            [20 usec]
;vd : variable delay, taken from vd-list
;ns: 8 * n
;ds: 4
;td1: number of experiments = number of delays in vd-list
;FnMODE: undefined
;define VDLIST
BASIC PROTOCOL 3
Measurement of the relaxation R1n for the imino protons
A second preliminary parameter required for the determination of the imino exchange rate (kex) is the longitudinal relaxation rate (R1) of the imino protons. This parameter is not directly measurable but can be determined as a sum of the longitudinal imino relaxation plus the exchange rate R1n= (R1 + kex). A standard inversion recovery experiment, including a binominal water suppression element after the π/2 read-out pulse is used to determine R1n. Optimizing the delay time in the binominal suppression sufficiently suppresses the water signal while leaving the imino peaks visible.
Materials
Use the same 3 mm NMR tube containing duplex DNA with the same spectrometer setup as described under Basic Protocol 2.
- Follow steps 1–4 of Basic Protocol 2 to prepare the DNA sample for this measurement, if not already done.
- Set the transmitter to the water signal to minimize any off-resonance effects.
- Determine the proton pulse length at high power in a one-pulse experiment, observing the zero intensity crossing of the water signal following a 360° pulse and optimize the transmitter offset.
- Setup the standard inversion recovery, which includes a binominal water suppression element (Marius Clore, Kimber et al. 1983) as shown in the Support Protocol 3, consisting of a 1 ms gradients, 200 µs recovery delay, followed by two π/2 hard pulse separated by the binominal delay and followed by the second 1 ms gradient and recovery delay before the acquisition takes place. Pulse and receiver phases should be equivalent at (x, x, −x, −x, y, y, −y, −y), with the exception of the second binominal pulse, whose phase is 180° inverted.
- Typical parameters for this measurement are: relaxation delay 15–20 sec, π/2 pulse of about 8 µs at 7 W (high power), 16–24 variable delays between 1 ms and 5 s, 120 µs binominal delay at 500 MHz, 1 ms shaped gradients and 200 µs gradient recovery delays. With an optimized setup, full dynamic of the receiver may be utilized. These experiments took about 3 h when acquiring 4 dummy scans, 32 acquisition scans and 16 delay times on an approximately 100 µM DNA sample.
Perform data analysis in analogy to the water T1-relaxation time analysis. Use the area of each imino peak to determine R1n = R1 + kex.
SUPPORT PROTOCOL 3
Pulse Sequence for inversion recovery measurement with binominal water suppression
;t1ir_11.mv
;avance-version (07/04/03)
;Adapted for high Q probes and H2O samples, M. Voehler, 3/2012
;T1 measurement using inversion recovery and water suppression using 1-1 pulse sequence

prosol relations=<triple>

#include <Avance.incl>
#include <Grad.incl>
#include <Delay.incl>

"p2=p1*2"
"d11=30m"

"acqt0=−p1*2/3.1416"

1 ze
2 d1 pl1:f1
  p2 ph1
  vd
  p1 ph2
  4u UNBLKGRAD
  4u
  p16:gp3
  d16
  p1 ph4
  d19
  p1 ph5
  4u
  p16:gp3
  d16
  4u BLKGRAD
  go=2 ph31
  d1 wr #0 if #0 ivd
  lo to 1 times td1
exit


ph1=0 0 2 2 1 1 3 3
ph2=0 0 2 2 1 1 3 3
ph4=0 0 2 2 1 1 3 3
ph5=2 2 0 0 3 3 1 1
ph31=0 0 2 2 1 1 3 3

;pl1 : f1 channel - power level for pulse (default)
;p1 : f1 channel -  90 degree high power pulse
;p2 : f1 channel - 180 degree high power pulse
;d1 : relaxation delay; 1–5 * T1
;d11: delay for disk I/O              [30 msec]
;d19: binominal delay  [115 usec]
;vd : variable delay, taken from vd-list
;NS: 8 * n
;DS: 4
;td1: number of experiments = number of delays in vd-list
;FnMODE: undefined
;define VDLIST

;this pulse program produces a ser-file (PARMOD = 2D)
;phase first FID then use split2D to create 1d spectra

;for z-only gradients:
;gpz3: 40% (24 G/cm)

;use gradient files:
;gpnam3: SMSQ10.100
BASIC PROTOCOL 4
Measurement of the exchange rate for the imino protons
As indicated before, an exchange between the imino- and water protons takes place at a rate, which is determined by base-pair opening in the DNA duplex. NMR offers a unique tool to monitor this exchange through the observation of the imino proton signal intensity as described by Guéron and Leroy (Gueron and Leroy 1995).The water proton spins are first selectively inverted and upon exchange, this inverted spin state is transferred to the imino protons, distinguishing the exchanged protons from the non-exchanged protons. Varying the time allowed for this exchange impacts the imino signal during acquisition and the data can then be fit to equation (1) (Gueron and Leroy 1995, Chen and Russu 2004). Several methods to invert the water signal selectively have been described, including the DANTE sequence (Morris and Freeman 1978) or using a shaped pulse (Bauer, Freeman et al. 1984). The latter is described in this protocol. A comparison between the two inversion methods revealed no significant difference.
Materials
Use the same 3 mm NMR tube containing duplex DNA with the same spectrometer setup as described under Basic Protocol 2 and 3.
Follow the first step of Basic Protocol 3 to prepare the DNA sample, determine the transmitter offset, and the π/2 hard pulse, if not already done.
Calculate the power level of a 2 ms Sinc1.1000 shaped proton π pulse for inversion of the water signal based on the π/2 hard pulse.
-
The experiment for measuring the imino exchange follows the proposed outline from Phan, Guéron and Leroy (Phan, Gueron et al. 2000) as shown in the Support Protocol 4.
The DANTE pulse was replaced with a 2 ms Sinc-shaped π-pulse (phase: x, −x) to invert the magnetization of the bulk water signal, followed by a 500 µs, 24 G/cm field gradient and a low level crusher gradient (0.1 G/cm) during the variable delay time, effectively eliminating any radiation damping effects. Both gradients were immediately followed by 200 µs recovery delay. The second recovery delay was followed by the π/2 read-out pulse (phase: x, x, −x, −x, y, y, −y, −y). The same binominal water suppression scheme as described in Basic Protocol 3 was utilized to suppress the water. The phase of the first binominal π/2 pulse was analog to the read-out pulse, while the one for second π/2 pulse was inverted. The receiver phase was analog to the read-out pulse.
Typical parameters for this measurement are: relaxation delay 15–20 sec, π/2 pulse of about 8 µs at 7 W (hard pulse), 16–24 variable delays between 1 ms and 5 sec, 120 µs binominal delay at 500 MHz, flanked by 1 ms shaped gradients and 200 µs gradient recovery delays. A fully optimized setup should suppress the water signal to the point where the full dynamic range of the receiver may be utilized. These experiments took about 3 h when acquiring 4 dummy scans, 32 acquisition scans and 16 delay times on an approximately 100 µM DNA sample.
Perform data analysis in analogy to the T1-relaxation time analysis of water, using the area of each imino peak. Export the data pair for each peak area and their respective delay time to GraphPad Prism (v. 6.0b for Mac OSX, GraphPad Software, La Jolla California USA, www.graphpad.com), and analyze it according to equation (1). This fit yields the exchange rate kex.
SUPPORT PROTOCOL 4
Pulse Sequence for measurement of imino exchange rate
;t1irexsp.mv
;Adapted by Markus Voehler, 12/2011
;Exchange measurement
;
;K. Snoussi, J.-L. Leroy, Biochem 40, 8898–8904 (2001)

prosol relations=<triple>

#include <Avance.incl>
#include <Grad.incl>
#include <Delay.incl>

"d11=30m"
"d12=20u"

"acqt0=−p1*2/3.1416"

1 ze
2 30m
  d12 BLKGRAD
  d1 pl0:f1
  "TAU=vd-80us-p29-(d16*2)"
  (p12:sp1 ph28):f1
  50u UNBLKGRAD
  p29:gp1
  d16
  10u gron0
  TAU
  20u groff
  d16 pl1:f1
  p1 ph2
  4u
  p16:gp3
  d16
  p1 ph2
  d19
  p1 ph3
  4u
  p16:gp3
  d16
  4u BLKGRAD
  go=2 ph31
  30m wr #0 if #0 ivd
  lo to 1 times td1
exit


ph1=0 2
ph2=0 0 2 2 1 1 3 3
ph3=2 2 0 0 3 3 1 1
ph28=0 2
ph29=0 2
ph31=0 0 2 2 1 1 3 3


;pl1 : f1 channel - power level for pulse (default)
;p1 : f1 channel -  90 degree high power pulse
;p12: f1 channel - 180 degree shaped pulse (H2O on resonance)
;p16: homospoil/gradient pulse
;p29: gradient pulse 3                      [500 usec]
;d1 : relaxation delay,1–5 * T1
;d11: delay for disk I/O                    [30 msec]
;d12: delay for power switching             [20 usec]
;d19 = (1/(2*d)), d = distance of next null (in Hz)
;vd : variable delay, taken from vd-list
;NS: 8 * n
;DS: 4
;td1: number of experiments = number of delays in vd-list
;FnMODE: undefined
;define VDLIST (min vd is 1ms)

;this pulse program produces a ser-file (PARMOD = 2D)

;for z-only gradients:
;gpz0: ca. 0.2% (0.1G/cm)
;gpz1: 40% (24 G/cm)
;gpz3: 30% (15 G/cm)

;use gradient files:
;gpnam1: SMSQ10.50
;gpnam3: SMSQ10.100
BASIC PROTOCOL 5
Measurement of the water inversion efficiency factor (E)
As indicated in equation (1), the water inversion efficiency (E) is the last parameter to be determined for the calculation of kex. The efficiency is a quality measure of the selective pulse inversion and can be expressed as followed (Crenshaw, Wade et al. 2011):
| (2) |
in which Winv and Wieq represent the peak areas of the water signal after inversion and read-out pulse with or without the inversion pulse, respectively. Use the same pulse sequence as described for the exchange measurement in Support Protocol 4, but without the variable delay and acquisition following immediately the read-out pulse, leaving the binominal water suppression out as shown in the Support Protocol 5. Since the water signal is observed, reduce the receiver gain and pulse power for the read-out pulse, as described in Basic Protocol 2, protocol step 3. Inversion of the bulk water signal leads inevitably to some imperfections, which show up in a slightly distorted peak. Therefore it is essential to compare the areas of the entire peaks with and without inversion when determining the efficiency (E). This assures comparable values for Winv and Wieq. Typical E values reported (Crenshaw, Wade et al. 2011) and measured were in the order of 1.85 to 1.95 (2 would be 100% inversion efficiency). Lorentzian lines can only be obtained when using the 20 µL sample in a 1mm NMR tube, but measurements on the actual sample, representing the situation during the kex determination are preferred.
Materials
Use the same 3 mm NMR tube containing the duplex DNA with the same spectrometer setup as described under Basic Protocols 2, 3 and 4.
Follow steps 1 and 2 of Basic Protocol 4 to prepare the DNA sample and setup the instrument for this measurement, if not already done.
- Use the same parameter set as described in Basic Protocol 4 for the imino exchange and change the pulse program according to the Support Protocol 5. Two 1D experiments are necessary to determine E.
- The Winv measurement acquires a spectrum including the inversion and read-out pulse. Since the water signal is observed, the receiver gain and read-out pulse power have to be reduced as described in Basic Protocol 2. The relaxation delay stays the same (15–20 sec), as well as the 1 ms shaped gradients followed by 200 µs gradient recovery delays. 4 dummy scans followed by 8 acquisition scans are used for signal averaging.
- Signal intensity for Weq is determined with the same parameter setup as in 2a) of this protocol. The inversion is suppressed by setting the power of the shape pulse to 0 W.
Process the resulting FIDs individually using an exponential line broadening and phase both spectra identically.
Shift the reference of one spectrum by about 500 Hz to separate the water signals in the two spectra.
After baseline correction, add the spectra together.
Now both water peaks can be integrated in one spectrum and one minus the integral ratio yields the efficiency as shown in equation (2).
The resulting E-value is used for the fit of the kex curve.
SUPPORT PROTOCOL 5
Pulse Sequence for measurement of efficiency (E)
;t1irexsp-E.mv
;Adapted by Markus Voehler, 4/2014
;Determination of E-Factor

prosol relations=<triple>

#include <Avance.incl>
#include <Grad.incl>
#include <Delay.incl>

"d11=30m"
"d12=20u"

"acqt0=−p1*2/3.1416"

1 ze
2 30m
  d12 BLKGRAD
  d1 pl0:f1
  (p12:sp1 ph28):f1
  50u UNBLKGRAD
  p29:gp1
  d16 pl1:f1
  p1 ph2
  4u BLKGRAD
  go=2 ph31
  30m wr #0
exit


ph1=0 2
ph2=0 0 2 2 1 1 3 3
ph3=2 2 0 0 3 3 1 1
ph28=0 2
ph29=0 2
ph31=0 0 2 2 1 1 3 3


;pl1 : 0W
;pl1 : f1 channel - power level for pulse (default)
;p1 : f1 channel -  90 degree high power pulse
;p12: f1 channel - 180 degree shaped pulse (H2O on resonance)
;p29: gradient pulse 3                      [500 usec]
;d1 : relaxation delay,1–5 * T1
;d11: delay for disk I/O                    [30 msec]
;d12: delay for power switching             [20 usec]
;NS: 8 * n
;DS: 4

;for z-only gradients:
;gpz1: 40% (24 G/cm)

;use gradient files:
;gpnam1: SMSQ10.50
COMMENTARY
Theory of the imino-exchange
Base pairing in nucleic acids plays a crucial role in their structure, interactions, and function. The kinetics of the base pair opening provides additional information to solution structure determination by NMR spectroscopy. The most common approach to determine the rates for base pair opening is the measurement of the imino exchange by magnetization transfer from water protons by 1H NMR, where each exchange event can be directly assigned to the imino proton of interest in the DNA base pair. Imino proton exchange occurs through base pair opening followed by exchange from the open state. The opening can be facilitated with the help of proton exchange catalyst (for example chemical base such as ammonia NH3), which provides the dissociation constants for base pair opening. The limit of the imino proton exchange rate at infinite catalyst concentration will translate into the rate of base pair opening, and base pair lifetimes. By analysis of the intrinsic catalysis, information about the geometry of the open state can be obtained as the intrinsic catalysis relates directly to the imino proton employed in the particular base pair (Gueron, Kochoyan et al. 1987, Gueron, Charretier et al. 1990, Gueron and Leroy 1995), Chen and Russu 2004):
| (3) |
where kop and kcl are the rates of opening and closing of the base pair, and kex,open is the rate of exchange from the open state. To determine the opening and closing rates, one varies the rate of exchange from the open state, kex,open, by adding to the DNA solution increasing concentrations of a proton acceptor. Ammonia has been widely used as a proton acceptor due to its small size and lack of charge, and to minimize catalysis due to presence of OH− ions (Gueron and Leroy 1995). However there are a number of different chemicals that can be used as a catalyst (Gueron and Leroy 1995). The final concentration of an active form of ammonia base catalyst at each titration point [B], can be calculated from the total ammonia concentration (c0), pH and the pKa value of ammonia as:
| (4) |
The rate of exchange of the imino proton from the open state of the base pair depends on the concentration of proton acceptor [B] (Chen and Russu 2004):
| (5) |
in which k0 is the rate of exchange from the open state in the absence of catalyst, kB is the constant rate for transfer of the imino proton to base catalyst in single nucleotides, and α is an accessibility factor of the proton acceptor to the imino proton in the open base. Previous studies have shown that, for ammonia base, α is close to unity (Gueron and Leroy 1995, Parker and Stivers 2010). The rate constant for exchange catalysis kB, is calculated from:
| (6) |
in which kD is bimolecular collision rate between the imino group and proton acceptor in the open state (1.0 × 10⁹ M−1s−1 for ammonia at 15°C (Gueron and Leroy 1995)), pKaNu and pKaB are the pKa values for imino proton of interest and ammonia base catalyst, respectively.
The final equation for the exchange rate is obtained by substituting kex,open in equation (3) with the expression derived in the equation (5):
| (7) |
Two kinetic regimes can characterize the base pair opening and closing, depending on the rate of exchange (Folta-Stogniew and Russu 1996, Chen and Russu 2004, Every and Russu 2008). The bimolecular exchange regime, also referred to EX2 regime, occurs when the concentration of proton acceptor is low (kex,open ≪ kcl). In that case, the observed rate of exchange is proportional to the rate of exchange from the open state (equation (3)), and therefore to the concentration of proton acceptor B (Chen and Russu 2004):
| (8) |
in which Kop = kop/kcl is the equilibrium constant for opening of the base that contains the imino proton. For the determination of the equilibrium constant for base pair opening (Kop), imino exchange rates are measured as a function of titrated base catalyst ammonia and fit to the equation (8).
The EX1 regime describes the unimolecular exchange and occurs at high concentrations of proton acceptor (kex,open ≫ kcl). In this regime, the exchange occurs in each opening event and kex = kop and the exchange time is equal to base pair lifetime. For the determination of the base pair opening (kop), imino exchange rates are measured as a function of titrated base catalyst ammonia and are fit to the equation (7).
T1 relaxation time of water
NMR measurements of the water spin-lattice relaxation have been reported in numerous places and context, as far back as the early 1950’s (Benedek and Purcell 1954, Chiarotti, Cristiani et al. 1955, Simpson and Carr 1958). It has been shown that the T1-relaxation time depends on the temperature (Simpson and Carr 1958), pressure (Benedek and Purcell 1954), or dissolved paramagnetic gases, in particular oxygen in aqueous solutions (Chiarotti, Cristiani et al. 1955), which all are relevant factors to be considered in this specific context.
Furthermore, the wide availability and use of highly sensitive NMR probes possessing high Q-factors, as is the case in cryogenically cooled probes, but also in many high field room temperature probes, has not only provided desired boosts in signal intensity, but also led to the undesired effect of radiation damping. This was not an issue for the relaxation measurements early on, but nonetheless the presence of radiation damping was recognized and described at that point (Bloembergen and Pound 1954) and has been expanded on since (Mao, Guo et al. 1994, Mao and Ye 1997, Taylor and Peterson 2010). It impacts the relaxation and exchange measurements discussed in this article in many ways. The presence of radiation damping manifests itself by a FID that grows in intensity before decaying, a broader than expected linewidth of the water signal, twisted signal phase at larger then π/2 pulses or a π pulse length longer than half of the respective 360° pulse. The commonly used inversion recovery experiment (Carr and Purcell 1954) to determine the longitudinal relaxation relies on an exact 180° pulse to invert the magnetization, followed by a variable delay time and π/2 read-out pulse. Applying this scheme to measure the longitudinal relaxation of water, where the sample contains roughly 110 M of protons, provides a challenge with regard to radiation damping and signal detection.
Alternative approaches have been proposed by Mao (Mao, Guo et al. 1994) to measure the relaxation times of strong signals utilizing saturation-recovery methods. Three methods to achieve selective saturation were described and further compared by Taylor (Mao and Ye 1997, Taylor and Peterson 2010), which included (a) selective pre-saturation by continuous-wave (CW) irradiation of the strong signal in analogy to the pre-saturation experiment (Alexander 1961), (b) DANTE-stile pre-saturation with a series of π/2 pulses (Morris and Freeman 1978), or (c) applying a crusher gradient following a π/2 pulse (Sklenar 1995). The selective presaturation of the strong signal is usually followed by a variable delay period and a read-out pulse, before acquiring the signal. If the NMR signal is very strong, as is the case in the relaxation measurement of water, a π/2 as a read-out pulse might be too strong and one has to apply an adequate, shorter pulse. Although some radiation damping may still be present in the detection period even with these methods, it now can be dealt with by using the peak area instead of the peak intensity for data analysis (Mao, Guo et al. 1994, Mao, Guo et al. 1994, Taylor and Peterson 2010). The peak area represents the entire FID, which includes small artifacts from radiation damping, whereas the peak intensity constitutes primarily the beginning of FID. This part of the FID is affected most by radiation damping, and therefore causes erroneous signal intensities.
Critical Parameters and Troubleshooting
The melting temperature of the DNA duplex is one of the critical parameters in the imino exchange experiments (Every and Russu 2007). An initial screening of the imino protons should be performed at first, by running pH-dependent and temperature-dependent 1H NMR experiments. Depending on the DNA melting temperature at different values of pH, the appropriate catalyst for the imino-exchange experiments should be used. There are several possible catalysts, which are optimal at different values of pH. For instance, ammonia or glycine are good catalysts at basic pH, whereas triethanolamine or imidazole are optimal at neutral pH (Gueron and Leroy 1995).
The pH of the experiment should be optimized according to the DNA sample characteristics. It should be recognized that the concentration of the active form of base catalyst, e.g., ammonia, is strongly pH dependent, the pH for the imino exchange reaction should carefully monitored. The pH should be maintained during the course of the titration and its experimental range should be as small as possible (up to 0.2 pH units difference). The pH should be measured at each titration point, either using an internal standard or an electrode. The addition of the triethanolamine (TEOA) to the DNA sample allows monitoring the pH of the reaction directly in the NMR tube during ammonia titration. This can be done by measuring the difference between the chemical shifts of the resonances of the two methylene groups of TEOA, according to previous reports (Chen and Russu 2004).
The temperature for the imino-exchange reaction should be determined from a temperature-dependent 1H NMR experiment. The resolution of the resonances on the NMR spectrum is temperature dependent. Thus one should choose the temperature, where all the imino resonances from DNA sample are the sharpest and of the highest intensity. This is very important, since as catalyst concentration is increased, imino-proton line broadening will be observed.
A set of catalyst stock solutions should be used to perform titration and to avoid dilution of the DNA sample. In this case, every time before the titration step, the volume of added catalyst should be calculated from the concentration of the ammonia stock solution, and from the concentration of the catalyst already present in the DNA sample. The minimum volume possible should be used (fractions of µL) to prevent excessive dilution of the DNA sample. The increase in volume results in line broadening of the imino protons, which in turns can be interpreted incorrectly as the effect of the catalyst used.
The inversion pulse can be either a DANTE pulse train or a single shape pulse. Comparative measurements between a 6 × 30°, 20 × 9°, or 30 × 6° DANTE pulse train with 100 µs inter-pulse delays and a 2ms Sinc shaped pulse consisting of 1000 individual points, showed no significant difference between the two inversion methods. The quality of inversion might depend more on the available spectrometer hardware and favor one over the other method.
For peak analysis one could use either peak intensity or its area. The method of choice for these experiments is to integrate the peaks and use their area. This reduces errors when small peaks are analyzed either due to low concentrations or when close to zero signal is detected and in cases where residual radiation damping is present, as discussed for the determination of the longitudinal water relaxation. Special care needs to be taken in the presence of overlapping peaks. These signals are best deconvoluted first.
It should be noted that when using ammonia as a base catalyst, the time of the whole series of titration and data collection should be minimized as much as possible. The long time and increasing concentrations of ammonia in DNA sample solution might have an effect on cytosine deamination.
Anticipated Results
Imino proton exchange rates are measured using magnetization transfer from water to imino protons. After processing and analysis, data are fit to equation (1) where I(t) and I0, are intensities of the imino proton peaks at a given delay time and at equilibrium, respectively. Figure 2 shows an example of the imino proton exchange profiles for a DNA duplex. The rapid initial decrease in intensity reflects the exchange of inverted water protons with the imino proton, and the increase in intensity represents the longitudinal relaxation of the water and imino proton magnetization.
Figure 2.

Imino proton exchange profiles of a DNA sample at different ammonia base catalyst concentrations. Profiles show the intensity of the imino proton resonance of the DNA duplex as a function of transfer delay time. Panel B shows the zoom-in view of panel A in the short range of tmix delays. I0/It is the ratio of the imino proton resonance intensity in the presence (I) and absence (I0) of magnetization transfer from solvent.
The characteristics of the base pair opening depend on the exchange properties and accessibility of the imino protons: N1 of guanine and N3 of thymine. For the imino proton to exchange with a proton acceptor present in the solution, the base pair has to undergo a conformational change from closed to open state. Thus, the hydrogen bonds of the base pair have to break. Thymine pairs with adenine via two hydrogen bonds; therefore it is easier for this base pair to open and exchange its imino proton, than for guanine, which pairs with cytosine via three hydrogen bonds. In that case, for the unmodified DNA duplex, the rates for exchange will be substantially higher for the T:A relative to the G:C base pair as shown in Figure 3.
Figure 3.

Imino proton exchange catalysis in the DNA duplex upon addition of the general base catalyst ammonia.
The exchange rates and derived kinetic parameters may vary for modified base pairs or bases with adducts or cross-links. Such imino proton exchange experiments and determination of base pair opening kinetics have been conducted previously on modified DNA (Leroy, Gao et al. 1992, Moe and Russu 1992, Bohon and Carlos 2005, Parker and Stivers 2010, Friedman, Jiang et al. 2011, Every and Russu 2013, Szulik, Voehler et al. 2013).
Typically, the lifetimes of the A:T or G:C base pairs in unmodified DNA are within the range of approximately 1–30 ms and 10–50 ms, respectively, and the open base pair lifetime is in the millisecond scale (Moe and Russu 1992, Gueron and Leroy 1995). The rates for base pair opening range within 10–50 s−1 for A:T or G:C base pairs in unmodified DNA. The equilibrium constant for base pair opening is approximately in the range of 10−6–10−7 (Chen and Russu 2004, Parker and Stivers 2010).
The exchange of the imino proton from the open state is also sequence dependent, as shown before (Gueron and Leroy 1995, Dornberger, Leijon et al. 1999, Warmlander, Sen et al. 2000, Chen and Russu 2004).
Time Considerations
The NMR data collection depends on the DNA sample concentration. The higher the DNA sample concentration the shorter the time of data acquisition. For example, for a 100 µM DNA sample with a set up of 4 dummy scans followed by 16 scans of averaging signal, and the longest delay time of 15 sec, a single titration experiment will take up to 2–3 h, including set up. The overall time of NMR data collection is multiplied by the 15–20 titration points that should be collected. The data analysis, including processing of NMR data and calculation of kinetic parameters will take ~1–2 days.
ACKNOWLEDGEMENT
We would like to thank Dr. Irina Russu, Dr. James T. Stivers and Dr. Megan E. Núñez for helpful discussions in performing the experiments.
This work was supported by NIH grants R01 CA-55678, R01 ES-05509, and P01 CA-160032 (M.P.S.). Funding for NMR was supplied by Vanderbilt University and NIH grants S10 RR-05805, S10 RR-025677 and NSF Grant DBI 0922862, the latter funded by the American Recovery and Reinvestment Act of 2009 (Public Law 111-5).
LITERATURE CITED
- Alexander S. Spin-Echo Method for Measuring Relaxation Times in Two-Line NMR Spectra. Review of Scientific Instruments. 1961;32(9):1066–1067. [Google Scholar]
- Bauer C, Freeman R, Frenkiel T, Keeler J, Shaka AJ. Gaussian pulses. Journal of Magnetic Resonance. 1984;58(3):442–457. (1969) [Google Scholar]
- Benedek GB, Purcell EM. Nuclear Magnetic Resonance in Liquids under High Pressure. The Journal of Chemical Physics. 1954;22(12):2003–2012. [Google Scholar]
- Bloembergen N, Pound RV. Radiation Damping in Magnetic Resonance Experiments. Physical Review. 1954;95(1):8–12. [Google Scholar]
- Bohon J, Carlos R. Effect of 6-thioguanine on the stability of duplex DNA. Nucleic acids research. 2005;33(9):2880–2886. doi: 10.1093/nar/gki572. [DOI] [PMC free article] [PubMed] [Google Scholar]
- Bustamante C, Smith SB, Liphardt J, Smith D. Single-molecule studies of DNA mechanics. Current opinion in structural biology. 2000;10(3):279–285. doi: 10.1016/s0959-440x(00)00085-3. [DOI] [PubMed] [Google Scholar]
- Carr HY, Purcell EM. Effects of diffusion on free precession in nuclear magnetic resonance experiments. Physical Review. 1954;94(3):630. [Google Scholar]
- Chen C, Russu IM. Sequence-Dependence of the Energetics of Opening of AT Basepairs in DNA. Biophysical Journal. 2004;87(4):2545–2551. doi: 10.1529/biophysj.104.045179. [DOI] [PMC free article] [PubMed] [Google Scholar]
- Chiarotti G, Cristiani G, Giulotto L. Proton relaxation in pure liquids and in liquids containing paramagnetic gases in solution. Il Nuovo Cimento. 1955;1(5):863–873. [Google Scholar]
- Crenshaw CM, Wade JE, Arthanari H, Frueh D, Lane BF, Nunez ME. Hidden in Plain Sight: Subtle Effects of the 8-Oxoguanine Lesion on the Structure, Dynamics, and Thermodynamics of a 15-Base Pair Oligodeoxynucleotide Duplex. Biochemistry. 2011;50(39):8463–8477. doi: 10.1021/bi201007t. [DOI] [PMC free article] [PubMed] [Google Scholar]
- Dhavan GM, Lapham J, Yang S, Crothers DM. Decreased imino proton exchange and base-pair opening in the IHF-DNA complex measured by NMR. Journal of molecular biology. 1999;288(4):659–671. doi: 10.1006/jmbi.1999.2690. [DOI] [PubMed] [Google Scholar]
- Dornberger U, Leijon M, Fritzsche H. High base pair opening rates in tracts of GC base pairs. Journal of Biological Chemistry. 1999;274(11):6957–6962. doi: 10.1074/jbc.274.11.6957. [DOI] [PubMed] [Google Scholar]
- Duguid JG, Bloomfield VA, Benevides JM, Thomas GJ., Jr DNA melting investigated by differential scanning calorimetry and Raman spectroscopy. Biophysical Journal. 1996;71(6):3350–3360. doi: 10.1016/S0006-3495(96)79528-0. [DOI] [PMC free article] [PubMed] [Google Scholar]
- Every AE, Russu IM. Probing the role of hydrogen bonds in the stability of base pairs in double-helical DNA. Biopolymers. 2007;87(2–3):165–173. doi: 10.1002/bip.20811. [DOI] [PubMed] [Google Scholar]
- Every AE, Russu IM. Influence of magnesium ions on spontaneous opening of DNA base pairs. The Journal of Physical Chemistry B. 2008;112(25):7689–7695. doi: 10.1021/jp8005876. [DOI] [PMC free article] [PubMed] [Google Scholar]
- Every AE, Russu IM. Opening dynamics of 8-oxoguanine in DNA. Journal of Molecular Recognition. 2013;26(4):175–180. doi: 10.1002/jmr.2262. [DOI] [PubMed] [Google Scholar]
- Folta-Stogniew E, Russu IM. Base-Catalysis of Imino Proton Exchange in DNA: Effects of Catalyst upon DNA Structure and Dynamics. Biochemistry. 1996;35(25):8439–8449. doi: 10.1021/bi952932z. [DOI] [PubMed] [Google Scholar]
- Friedman JI, Jiang YL, Miller PS, Stivers JT. Unique dynamic properties of DNA duplexes containing interstrand cross-links. Biochemistry. 2011;50(5):882–890. doi: 10.1021/bi101813h. [DOI] [PMC free article] [PubMed] [Google Scholar]
- Gueron M, Charretier E, Hagerhorst J, Kochoyan M, Leroy J, Moraillon A. Applications of imino proton exchange to nucleic acid kinetics and structures. In: Sarma RH, Sarma MH, editors. Structure and methods: proceedings of the Sixth Conversation in the Discipline Biomolecular Stereodynamics held at the State University of New York at Albany. 1990. Jun 6–10, 1989. [Google Scholar]
- Gueron M, Kochoyan M, Leroy JL. A single model of DNA base-pair opening drives imino proton exchange. Nature. 1987;328:89–92. doi: 10.1038/328089a0. [DOI] [PubMed] [Google Scholar]
- Gueron M, Leroy J-L. [16] Studies of base pair kinetics by NMR measurement of proton exchange. In: Thomas LJ, editor. Methods in enzymology. Vol. 261. Academic Press; 1995. pp. 383–413. [DOI] [PubMed] [Google Scholar]
- Hwang T-L, Mori S, Shaka A, van Zijl PC. Application of phase-modulated CLEAN chemical EXchange spectroscopy (CLEANEX-PM) to detect water-protein proton exchange and intermolecular NOEs. Journal of the American Chemical Society. 1997;119(26):6203–6204. [Google Scholar]
- Kochoyan M, Leroy JL, Gueron M. Processes of base-pair opening and proton exchange in Z-DNA. Biochemistry. 1990;29(20):4799–4805. doi: 10.1021/bi00472a008. [DOI] [PubMed] [Google Scholar]
- Kovacs H, Moskau D, Spraul M. Cryogenically cooled probes - a leap in NMR technology. Progress in Nuclear Magnetic Resonance Spectroscopy. 2005;46(2–3):131–155. [Google Scholar]
- Lee YM, Lee EH, Seo YJ, Kang YM, Ha JH, Kim HE, Lee JH. Measurement of Hydrogen Exchange Times of the RNA Imino Protons Using by Phase-modulated CLEAN Chemical Exchange Spectroscopy. a a. 2009;1:1. [Google Scholar]
- Leijon M, Groeslund A. Effects of sequence and length on imino proton exchange and base pair opening kinetics in DNA oligonucleotide duplexes. Nucleic acids research. 1992;20(20):5339–5343. doi: 10.1093/nar/20.20.5339. [DOI] [PMC free article] [PubMed] [Google Scholar]
- Leroy JL, Gao X, Misra V, Gueron M, Patel DJ. Proton exchange in DNA-luzopeptin and DNA-echinomycin bisintercalation complexes: rates and processes of base-pair opening. Biochemistry. 1992;31(5):1407–1415. doi: 10.1021/bi00120a017. [DOI] [PubMed] [Google Scholar]
- Mao X-a, Guo J-x, Ye C-h. Radiation damping effects of transverse relaxation time measurements. Chemical physics letters. 1994;227(1):65–68. [Google Scholar]
- Mao X-A, Guo J-X, Ye C-H. Radiation damping effects on spin-lattice relaxation time measurements. Chemical physics letters. 1994;222(5):417–421. [Google Scholar]
- Mao X-A, Ye C-H. Understanding radiation damping in a simple way. Concepts in Magnetic Resonance. 1997;9(3):173–187. [Google Scholar]
- Marius Clore G, Kimber BJ, Gronenborn AM. The 1-1 hard pulse: A simple and effective method of water resonance suppression in FT 1H NMR. Journal of Magnetic Resonance. 1983;54(1):170–173. (1969) [Google Scholar]
- Moe JG, Russu IM. Kinetics and energetics of base-pair opening in 5'-d (CGCGAATTCGCG)-3'and a substituted dodecamer containing G. cntdot. T mismatches. Biochemistry. 1992;31(36):8421–8428. doi: 10.1021/bi00151a005. [DOI] [PubMed] [Google Scholar]
- Morris GA, Freeman R. Selective excitation in Fourier transform nuclear magnetic resonance. Journal of Magnetic Resonance. 1978;29(3):433–462. doi: 10.1016/j.jmr.2011.08.031. (1969) [DOI] [PubMed] [Google Scholar]
- Parker JB, Stivers JT. Dynamics of Uracil and 5-Fluorouracil in DNA. Biochemistry. 2010;50(5):612–617. doi: 10.1021/bi101536k. [DOI] [PMC free article] [PubMed] [Google Scholar]
- Phan A-T, Gueron M, Leroy J-L. Investigation of unusual DNA motifs. Methods in enzymology. 2000;338:341–371. doi: 10.1016/s0076-6879(02)38228-4. [DOI] [PubMed] [Google Scholar]
- Piotto M, Saudek V, Sklenar V. Gradient-tailored excitation for single-quantum NMR spectroscopy of aqueous solutions. J Biomol NMR. 1992;2(6):661–665. doi: 10.1007/BF02192855. [DOI] [PubMed] [Google Scholar]
- Plum G, Breslauer KJ. DNA lesions: a thermodynamic perspective. Annals of the New York Academy of Sciences. 1994;726(1):45–56. doi: 10.1111/j.1749-6632.1994.tb52796.x. [DOI] [PubMed] [Google Scholar]
- Priyakumar UD, MacKerell AD. NMR imino proton exchange experiments on duplex DNA primarily monitor the opening of purine bases. Journal of the American Chemical Society. 2006;128(3):678–679. doi: 10.1021/ja056445a. [DOI] [PMC free article] [PubMed] [Google Scholar]
- Rouzina I, Bloomfield VA. Force-induced melting of the DNA double helix 1. Thermodynamic analysis. Biophysical Journal. 2001;80(2):882–893. doi: 10.1016/S0006-3495(01)76067-5. [DOI] [PMC free article] [PubMed] [Google Scholar]
- Sambrook DWR, Green MR. Molecular Cloning, A LABORATORY MANUAL. Cold Spring Harbor, New York: Cold Spring Harbor Laboratory Press; 2001. [Google Scholar]
- Sancar A, Lindsey-Boltz LA, Unsal-Kacmaz K, Linn S. Molecular mechanisms of mammalian DNA repair and the DNA damage checkpoints. Annual review of biochemistry. 2004;73(1):39–85. doi: 10.1146/annurev.biochem.73.011303.073723. [DOI] [PubMed] [Google Scholar]
- Simpson JH, Carr HY. Diffusion and Nuclear Spin Relaxation in Water. Physical Review. 1958;111(5):1201–1202. [Google Scholar]
- Sinden RR. DNA structure and function. Gulf Professional Publishing; 1994. [Google Scholar]
- Sklenar V. Suppression of Radiation Damping in Multidimensional NMR Experiments Using Magnetic Field Gradients. Journal of Magnetic Resonance, Series A. 1995;114(1):132–135. [Google Scholar]
- Snoussi K, Leroy JL. Imino Proton Exchange and Base-Pair Kinetics in RNA Duplexes. Biochemistry. 2001;40(30):8898–8904. doi: 10.1021/bi010385d. [DOI] [PubMed] [Google Scholar]
- Szulik MW, Voehler MW, Ganguly M, Gold B, Stone MP. Site-Specific Stabilization of DNA by a Tethered Major Groove Amine, 7-Aminomethyl-7-deaza-2′-deoxyguanosine. Biochemistry. 2013;52(43):7659–7668. doi: 10.1021/bi400695r. [DOI] [PMC free article] [PubMed] [Google Scholar]
- Taylor RE, Peterson RD. Comparison of spin-lattice relaxation measurements made in the presence of strong radiation damping. Journal of Molecular Structure. 2010;970(1):155–159. [Google Scholar]
- Vu H, McCollum C, Jacobson K, Theisen P, Vinayak R, Spiess E, Andrus A. Fast oligonucleotide deprotection phosphoramidite chemistry for DNA synthesis. Tetrahedron Letters. 1990;31(50):7269–7272. [Google Scholar]
- Warmlander S, Sen A, Leijon M. Imino proton exchange in DNA catalyzed by ammonia and trimethylamine: evidence for a secondary long-lived open state of the base pair. Biochemistry. 2000;39(3):607–615. doi: 10.1021/bi991863b. [DOI] [PubMed] [Google Scholar]