

Abstract
Fasting plasma glucose (FPG) has been recognized as an important indicator for the overall glycemic state preceding the onset of metabolic diseases. So far, most indentified genome-wide association loci for FPG were derived from populations with European ancestry, with a few exceptions. To extend a thorough catalog for FPG loci, we conducted meta-analyses of 13 genome-wide association studies in up to 24,740 nondiabetic subjects with East Asian ancestry. Follow-up replication analyses in up to an additional 21,345 participants identified three new FPG loci reaching genome-wide significance in or near PDK1-RAPGEF4, KANK1, and IGF1R. Our results could provide additional insight into the genetic variation implicated in fasting glucose regulation.
Introduction
Fasting plasma glucose (FPG) levels are tightly regulated as a part of metabolic homeostasis (1). Failure in blood glucose regulation can lead to elevated FPG levels, representing an independent risk factor for type 2 diabetes (T2D) and a predictor of cardiovascular disease (2,3). The fasting glucose level is a moderately heritable trait with the heritability around 30% (4–6). A considerable number of genetic determinants influencing fasting glucose levels has been identified from numerous genetic studies in the past few years. The total heritability of fasting glucose levels, however, is yet to be fully explained.
To date, 39 genetic loci harboring variants associated with FPG have been identified from genome-wide association (GWA) studies and GWA meta-analyses that were conducted in populations of European ancestry (7,8). The genetic basis of glycemic regulation has not been fully explored in non-European populations, with only one study in East Asians that identified a single locus associated with FPG (rs895636 at the SIX2-SIX3 loci) (9). Considering differences in the allele frequencies and linkage disequilibrium (LD) structures among ethnic groups, large-scale genetic studies in populations of non-European ancestries may increase the chance to detect additional novel genetic loci for FPG.
GWA meta-analyses have an advantage to identify genetic variants with small effect size and low allele frequency that were hardly detected in a single GWA study (10). Therefore, in this study, we aimed to identify novel loci influencing fasting glucose variation by conducting GWA meta-analysis in East Asian populations. We conducted a two-stage association study, comprising a discovery set (stage 1) of 24,740 individuals from the Asian Genetic Epidemiology Network (AGEN) and follow-up de novo genotyping replication set (stage 2) of 21,345 individuals from independent East Asian populations (Table 1 and Supplementary Fig. 1).
Table 1.
Study design and samples
| Representative | Study | Ethnic group | Genotyping method | Sample size | |
|---|---|---|---|---|---|
| Stage 1 (discovery) | KNIH | KARE | Korean | Affymetrix 5.0 | 7,696 |
| HEXA | Korean | Affymetrix 6.0 | 3,385 | ||
| CAVAS | Korean | Illumina 1M | 3,205 | ||
| NUS | SP2(1) | Chinese | Illumina 1M | 933 | |
| SP2(2) | Chinese | Illumina 610K | 1,044 | ||
| SP2(3) | Chinese | Illumina 550K | 305 | ||
| VU/SCI | SBCS | Chinese | Affymetrix 6.0 | 2,017 | |
| SMHS | Chinese | Affymetrix 6.0/Illumina 660K | 291 | ||
| Tulane University | GenSalt | Han Chinese | Affymetrix 6.0 | 1,832 | |
| NCGM | CAGE | Japanese | Illumina 550K | 756 | |
| UNC | CLHNS | Filipino | Affymetrix 5.0 | 1,624 | |
| Harvard University | CRC | Chinese | Illumina 610K | 733 | |
| Yonsei University | KCPS-II | Korean | Affymetrix 5.0 | 919 | |
| Stage 1 total | 24,740 | ||||
| Stage 2 (de novo replication) | KNIH | Health2 | Korean | TaqMan | 5,277 |
| RIKEN/UT | BBJ | Japanese | Multiplex PCR invader assay | 1,883 | |
| SJTU | SJTUDS | Han Chinese | MassARRAY | 3,412 | |
| Ehime University | JMGP | Japanese | TaqMan | 10,299 | |
| CUHK | CUHKS | Han Chinese | Sequenom MassARRAY | 474 | |
| Stage 2 total | 21,345 | ||||
| Overall | AGEN | AGEN-FPG | East Asian | 46,085 |
Stage 1 includes 13 studies that provided full GWA analysis results for FPG. Stage 2 includes five studies that provided de novo replication results of SNPs selected from stage 1. BBJ, BioBank Japan; CUHK, Chinese University of Hong Kong; CUHKS, Chinese University of Hong Kong Diabetes Study; Health2, Health2 Study; JMGP, The Japanese Millennium Genome Project; KNIH, Korea National Institute of Health; NUS, National University of Singapore; SCI, Shanghai Cancer Institute; SJTU, Shanghai Jiao Tong University; SJTUDS, Shanghai Jiao Tong University Diabetes Study; UNC, University of North Carolina; UT, The University of Tokyo; VU, Vanderbilt University.
Research Design and Methods
Study Subjects
Stage 1 subjects were drawn from 13 GWA studies participating in the AGEN consortium, which was organized in 2010 to enable GWA studies of metabolic traits such as diabetes, hypertension, and obesity. These 13 studies consist of 24,740 subjects from the Korea Association REsource (KARE) project, Health Examinee shared control study (HEXA), Cardiovascular Disease Association Study (CAVAS), three Singapore Prospective Study Programs (SP2), Shanghai Breast Cancer Study (SBCS), Shanghai Men's Health Study (SMHS), Genetic Epidemiology Network of Salt Sensitivity (GenSalt), Cardio-metabolic Genome Epidemiology (CAGE) Network, Cebu Longitudinal Health and Nutrition Survey (CLHNS), Cardiometabolic Risk in Chinese (CRC) study, and the Korean Cancer Prevention Study-II (KCPS-II). Stage 2 included 21,345 subjects from five independent studies for de novo replication analysis. Each study obtained approval from the appropriate institutional review board, and all participants provided written informed consent across the studies. Information including the study design and descriptive characteristics of each participating study is outlined in Supplementary Table 1 and the Supplementary Data.
Phenotype Measurement
Fasting glucose levels were measured from whole blood, plasma, or serum for each cohort. Fasting whole-blood glucose levels were multiplied by 1.13 to convert to FPG levels. Anthropometric measurements, such as BMI, were obtained by standardized procedures.
Genotyping, Imputation, and Quality Control
Genotyping and quality control methods for individual studies are outlined in Supplementary Table 2. A variety of genotyping platforms from Affymetrix or Illumina were applied to each individual GWA analysis to obtain the entire genome scan data. Imputation of genotypes to the HapMap Phase 2 (CHB + JPT except for CLHNS, which used HapMap CHB + JPT + CEU) as the reference panel was carried out using the programs MACH, IMPUTE, or BEAGLE. Imputed single nucleotide polymorphisms (SNPs) with high imputation quality (proper-info >0.5 for IMPUTE and Rsq >0.3 for MACH and BEAGLE) were used for subsequent association analysis. Genotyping for de novo replication in stage 2 was carried out by TaqMan, Multiplex PCR invader assay, or Sequenom MassArray method.
Statistical Analyses
Only nondiabetic individuals were tested for FPG by excluding diabetic patients, individuals using antidiabetes medicine, and individuals with fasting glucose ≥7 mmol/L. The rank-based inverse normal transformed FPG was tested for the association analyses to improve the normality of the FPG distribution and alleviate the impact of outliers. Association analyses were adjusted for sex and BMI (plus recruitment area in KARE and National Center for Global Health and Medicine [NCGM] studies) to compensate for multivariate linear regression analyses in the additive genetic mode. For the family design of the GenSalt study, family relationship was adjusted using a linear mixed model in which family identification was used as a random effect. Association analyses were performed using the programs SNPTEST, Mach2qtl, or PLINK (Supplementary Table 2). The meta-analysis was conducted using an inverse-variance method assuming fixed effects with a Cochran Q test to assess heterogeneity between the 13 studies. All meta-analyses were performed using the METAL software, and study-specific genomic control adjustment was applied. Genomic control inflation factor (λ) was estimated from the median of the χ2 statistic divided by 0.456. The λ for the meta-analysis was 1.06 (and was less than 1.029 for individual studies), indicating that the results seen in stage 1 were probably not the result of population stratification. The Manhattan plot showing the negative log P value distribution for stage 1 meta-analysis results was generated by WGAViewer software. The quantile-quantile plot of trend test P values showed deviations from the null distribution due to the strong associations observed for FPG. Regional association plots from genome-wide meta-analysis results were generated using the LocusZoom software.
Gene Relationships Across Implicated Loci Analysis
To understand gene relationships across implicated loci, a Gene Relationships Across Implicated Loci (GRAIL) analysis was conducted as described previously (11,12). A total of 43 FPG genes comprising 40 previously known genes (Supplementary Table 3) and 3 genes newly implicated in this study (Table 2) were included for the analysis. PubMed abstracts published after December 2006 were not included for the analysis to reduce confounding by results from FPG GWA studies.
Table 2.
Identified genetic loci associated with FPG at genome-wide significance in East Asian populations
| Chr | Candidate gene | Effect allele | Other allele | Stage 1 (discovery) |
Stage 2 (de novo replication) |
Combined (stage 1+2) |
||||
|---|---|---|---|---|---|---|---|---|---|---|
| β ± SEM | P | β ± SEM | P | β ± SEM | P | |||||
| New loci identified in this study | ||||||||||
| rs733331 | 2 | PDK1-RAPGEF4 | A | G | 0.048 ± 0.009 | 7.18E-08 | 0.029 ± 0.007 | 3.85E-05 | 0.036 ± 0.006 | 6.98E-11 |
| rs10815355 | 9 | KANK1 | T | G | 0.074 ± 0.012 | 3.73E-10 | 0.027 ± 0.009 | 3.59E-03 | 0.045 ± 0.007 | 1.26E-09 |
| rs2018860 | 15 | IGF1R | A | T | 0.050 ± 0.009 | 1.72E-08 | 0.019 ± 0.007 | 7.21E-03 | 0.031 ± 0.006 | 2.99E-08 |
| Previously reported loci | ||||||||||
| rs780094 | 2 | GCKR | C | T | 0.052 ± 0.009 | 3.58E-09 | — | — | 0.052 ± 0.009 | 3.58E-09 |
| rs895636 | 2 | SIX2-SIX3 | T | C | 0.069 ± 0.010 | 2.53E-13 | — | — | 0.069 ± 0.010 | 2.53E-13 |
| rs13387347 | 2 | G6PC2-ABCC11 | C | T | 0.114 ± 0.009 | 2.35E-36 | — | — | 0.114 ± 0.009 | 2.35E-36 |
| rs9356744 | 6 | CDKAL1 | C | T | 0.057 ± 0.009 | 9.24E-10 | — | — | 0.057 ± 0.009 | 9.24E-10 |
| rs1974620 | 7 | TMEM195 | T | C | 0.063 ± 0.009 | 2.79E-11 | — | — | 0.063 ± 0.009 | 2.79E-11 |
| rs730497 | 7 | GCK | A | G | 0.121 ± 0.011 | 7.72E-27 | — | — | 0.121 ± 0.011 | 7.72E-27 |
| rs3802177 | 8 | SLC30A8 | G | A | 0.063 ± 0.009 | 5.23E-12 | — | — | 0.063 ± 0.009 | 5.23E-12 |
| rs4237150 | 9 | GLIS3 | C | G | 0.053 ± 0.009 | 4.31E-09 | — | — | 0.053 ± 0.009 | 4.31E-09 |
| rs10811661 | 9 | CDKN2A/B | T | C | 0.062 ± 0.009 | 8.66E-12 | — | — | 0.062 ± 0.009 | 8.66E-12 |
| rs3847554 | 11 | MTNR1B | T | C | 0.059 ± 0.009 | 2.20E-11 | — | — | 0.059 ± 0.009 | 2.20E-11 |
| rs6048216 | 20 | FOXA2 | T | C | 0.095 ± 0.013 | 1.91E-12 | — | — | 0.095 ± 0.013 | 1.91E-12 |
Chr, chromosome.
Results
Our stage 1 meta-analyses from 24,740 AGEN subjects revealed signals showing strong evidence for FPG associations. Most of them were in known FPG loci (Fig. 1). Twenty-three of 40 FPG loci that were detected mostly in the European populations were replicated in our stage 1 meta-analyses (with P < 0.05 and a consistent direction of effect) (Supplementary Table 3). Of these, 11 (GCKR, SIX2-SIX3, G6PC2-ABCC11, CDKAL1, TMEM195, GCK, SLC30A8, GLIS3, CDKN2A/B, MTNR1B, and FOXA2) reached genome-wide significance and showed similar direction of association as in the original reports (Table 2).
Figure 1.
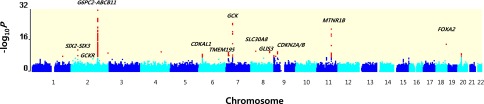
Genome-wide Manhattan plot of the meta-analysis for FPG in East Asian populations. Shown are the –log10 P values using the trend test for SNPs distributed across the entire autosomal genome (NCBI build 37). The red dots at each locus indicate the signals with P < 10−6 detected in the GWA meta-analysis. Approximately 2.4 mol/L SNPs that were present in at least 13 stage 1 studies were used to generate the plot.
After removing signals within previously identified FPG loci, SNPs showing the deviation between the distributions of the observed and expected P values were still observed on the quantile-quantile plot (Supplementary Fig. 2). Those signals likely represent new FPG loci that require validation in additional investigations. For follow-up replication, we selected three independent signals (i.e., with pairwise LD statistics r2 <0.2 and minor allele frequency ≥0.05 within a 500-kb window of the genomic region) from the stage 1 meta-analysis based on our arbitrary inclusion threshold (P < 5 × 10⁻⁷), heterogeneity P value >0.01, and at least 10 studies having been included in the meta-analysis. To consolidate genetic associations for the promising three new variants, we conducted de novo genotyping. The stage 2 replication analysis (five studies, up to 21,345 subjects) showed a statistically significant association of these three variants with FPG and the same direction of association as in the stage 1 analysis results (Table 2).
An overall meta-analysis of the total samples (18 studies, up to 46,085 subjects) identified three novel loci for FPG reaching genome-wide significance (P < 5 × 10⁻⁸). These FPG-associated loci were located close to PDK1-RAPGEF4 (rs733331, Poverall = 6.98 × 10⁻¹¹), KANK1 (rs10815355, Poverall = 1.26 × 10⁻⁹), and IGF1R (rs2018860, Poverall = 2.99 × 10⁻⁸) (Table 2 and Fig. 2). The newly identified loci in our study showed less significant association in European ancestry subjects studied by the MAGIC investigators (P < 5 × 10⁻³) (2). Notably, two of the new loci (near PDK1-RAPGEF4 and KANK1) have very low minor allele frequencies (<0.01) in Europeans (Supplementary Table 4).
Figure 2.


Regional association plots of three newly discovered FPG loci. A−C: The SNP positions are shown at the top and the regional association results from the GWA meta-analysis are shown in the middle. The trend test −log10 P values are shown for SNPs distributed in a 0.8-Mb genomic region centered on the most strongly associated signal, which is depicted as a purple diamond for the combined stage 1 and 2 results. The locations of known genes in the region are shown at the bottom. The genetic information is from the Human Genome hg19, and the LD structure is based on the 1000 Genomes East Asian Ancestry data (March 2012). chr, Chromosome.
Discussion
SNP rs733331 is located on chromosome 2q31 between PDK1 (pyruvate dehydrogenase kinase (PDK) isozyme 1) and RAPGEF4 (Rap guanine nucleotide exchange factor 4). Pyruvate dehydrogenase, a mitochondrial multienzyme complex, is one of the important key enzymes responsible for glucose homeostatic regulation. The enzyme activity by cyclic de-phosphorylation cascades is regulated by a specific PDK. A previous functional study reported that liver-specific Pdk1 deficiency in mice was associated with postprandial hyperglycemia (13). In addition, a potential regulator of PDK1, the pancreas-specific miR-375, was directly implicated in the regulation of glucose-induced biological responses (14). RAPGEF4 has a role in initiating insulin secretion and mediating cAMP-dependent pulsatile insulin release (15).
The rs10815355 signal on chromosome 9p24 is located in an intron of KANK1 (KN motif and ankyrin repeat domains 1), which has a role in the formation of the cytoskeleton by regulating actin polymerization. KANK1 negatively regulates the formation of actin stress fibers and cell migration through the inhibition of ρ-associated kinase activity (16).
Recently, the population-based Metabolic Syndrome in Men (METSIM) study conducted exome array analysis in 8,229 nondiabetic Finnish males (17). This study demonstrated that genetic variant rs3824420, encoding Arg667His in KANK1 and located 90 kb from rs10815355, was associated with circulating proinsulin levels and related insulin processing and secretion traits (17). In the METSIM study, rs10815355 also exhibited association with proinsulin levels at GWA significance (Supplementary Table 5). The substantial attenuation in association for both SNPs in conditional analysis suggests that rs10815355 likely represents the same signal as rs3824420 for the proinsulin levels. This result is supported by the strong LD (r2 = 0.787, D’ = 1.000 [K.L.M. and METSIM scientists, unpublished data]) calculated by the genotypes in METSIM (Supplementary Table 5).
Both rs10815355 and rs3824420 were not significantly associated with fasting glucose levels in METSIM (Supplementary Table 5). On the other hand, in addition to the strong association of rs10815355 for FPG, our AGEN stage 1 meta-analysis (seven studies, up to 11,822 subjects) demonstrated that rs3824420 was also marginally associated with fasting glucose (Pstage 1 = 0.035). Considering the substantial differences in SNP minor allele frequency and LD between the two ethnic groups, these discrepancies between AGEN and METSIM are not surprising (Supplementary Table 6). It is known that genetic variants with low allele frequency are hardly detected in the GWA studies (18).
Unlike the case of FPG, both rs10815355 and rs3824420 were not associated with the insulin-related traits such as fasting insulin and HOMA of β-cell function in one of the AGEN stage 1 studies (KARE, up to 7,183 subjects) (Supplementary Table 7). To detect the evidence of association for these traits in the East Asian populations, meta-analysis combining all AGEN stage 1 data (thus improving power by increasing the sample size) should be carried out (Supplementary Table 7).
Although two SNPs, rs10815355 and rs3824420, are weakly linked in East Asians (r2 = 0.087, D’ = 0.362 in HapMap CHB/JPT), the association strength of one SNP was moderately diminished after adjustment for the other SNP in our conditional analyses using data from three AGEN stage 1 studies, KARE, HEXA, and CAVAS (up to 12,178 subjects) (Supplementary Table 8). These results plausibly indicate the functional relevance of rs10815355 to rs3824420 in the KANK1 region for FPG association in the East Asian populations. Further study will be needed to determine whether these signals share an underlying unrevealed causal variant for FPG levels. Other conditional analyses demonstrated that association signals of rs10815355 and rs3824420 for FPG remained after adjustment for the insulin-related traits (Supplementary Table 9). These results suggested that the FPG association of the KANK1 region was not simply secondary to the association for insulin-related traits in our study.
SNP rs2018860 in 15q26 is located in an intron of IGF1R (insulin-like growth factor receptor), which is involved in cell growth, differentiation, migration, and metabolism and is a major aspect of glucose homeostasis (19). IGF1R, the protein encoded by IGF1R, has tyrosine kinase activity that stimulates growth in many different cell types and blocks apoptosis in multiple signaling pathways (20,21). Recent GWA analyses detected the association of IGF1R with higher serum uric acid concentrations in European populations (22). Serum uric acid levels as a potential biomarker have been reported in association with impaired glucose metabolism (23). In addition, a two-stage study reported a putative role of IGF1R variants on insulin resistance and arterial hypertension (24). Expression of a dominant-negative IGF1R in muscle leads to severely impaired insulin-mediated glucose uptake (25). β-Cell−specific knockout of IGF1R results in hyperinsulinemia and impaired glucose tolerance (26). IGF1R is involved in mediating GLP-1 increase in glucose competence and proliferation on the β-cell (27).
Given the knowledge that the substantial elevation of FPG is one of the typical signs of T2D, we investigated the relevance of the three new FPG signals to T2D risk from AGEN-T2D meta-analysis data (11). None showed evidence for association with T2D (Supplementary Table 10). These results indicate that the three new variants influencing FPG likely have limited impact on T2D risk, as exemplified by MADD and SLC2A2 loci in the previous report (2).
We performed the GRAIL literature-based annotation analysis (12) to investigate functional connectivity among the three new FPG genes from this study and the 40 known genes from previous studies (Supplementary Table 11). The strongest connections were observed in biological pathways, such as insulin secretion, circadian rhythm, and carbohydrate digestion, along with the most frequently connecting terms, including insulin, glucose, circadian, and growth. The results highlighted biological functions of newly identified loci in the regulation of glucose metabolism (Supplementary Table 12 and Supplementary Fig. 3).
This study is the largest GWA study meta-analysis, to our knowledge, conducted for FPG in East Asians. In conclusion, our meta-analysis identified three novel loci in or near the PDK1, KANK1, and IGF1R genes at genome-wide significance levels. This study was also able to replicate many of the FPG risk loci that were previously established in Europeans. The identification of these loci provides the possibility to further the functional connection and the causal evidence in fasting glucose regulation and related diseases.
Supplementary Material
Article Information
Acknowledgments and Funding. This work was supported by grants from Korea Centers for Disease Control and Prevention (4845-301, 4851-302, and 4851-307) and an intramural grant from the Korea National Institute of Health (2012-N73002-00), the Republic of Korea. Y.S.C. acknowledges support from the National Research Foundation of Korea grant funded by the Korean government (Ministry of Education, Science and Technology) (2012R1A2A1A03006155). CLHNS was supported by U.S. National Institutes of Health (NIH) grants DK078150, TW05596, HL085144, and TW008288 and pilot funds from RR20649, ES10126, and DK56350. The authors thank the Office of Population Studies Foundation research and data collection teams and the study participants who generously provided their time for this study. The authors thank Markku Laakso (University of Kuopio, Finland), Michael Boehnke (University of Michigan), Francis Collins (NIH, Bethesda, MD), and the METSIM study investigators for providing access to unpublished data. METSIM data were generated and analyzed with support from the Academy of Finland (contract 124243), the Finnish Heart Foundation, the Finnish Diabetes Foundation, Tekes (contract 1510/31/06), the Commission of the European Community (HEALTH-F2-2007-201681), and NIH grants DK093757, DK072193, DK062370, and 1Z01 HG000024. SBCS was supported by R01CA064277; SMHS by R01CA082729; and GWA studies by R37CA070867, R01CA082729, R01CA124558, R01CA148667, R01CA122364, R01CA122756, and R01CA137013 (all NIH grants), as well as Ingram Professorship and Research Reward funds from the Vanderbilt University School of Medicine. The authors want to thank Regina Courtney (the Vanderbilt University School of Medicine) for DNA preparation and Jing He (the Vanderbilt University School of Medicine) for data processing and analyses. S.O.U. acknowledges a grant from the National 973 Program (2011CB504001), National Natural Science Foundation of China (81170735), and Excellent Young Medical Expert of Shanghai (XYQ2011041). The authors thank all the medical staff of the Shanghai Clinical Center for Diabetes, all the participants and the staff of the BioBank Japan project, and Minoru Iwata, Kazuyuki Tobe (First Department of Internal Medicine, University of Toyama), Kazuki Yasuda, Masato Kasuga (Diabetes Research Center, Research Institute, National Center for Global Health and Medicine), and Hiroshi Hirose (Health Center, Keio University School of Medicine) for the preparation of DNA and clinical information. They also thank the technical staff of the Laboratory for Endocrinology, Metabolism and Kidney diseases at the RIKEN Center for Integrative Medical Sciences for performing SNP genotyping. They thank Hayato Fujita (Department of Diabetes and Metabolic Diseases, Graduate School of Medicine, The University of Tokyo) for statistical analysis. S.M. acknowledges a grant from the Leading Project of Ministry of Education, Culture, Sports, Science and Technology, Japan. W.J. acknowledges a grant from the National Natural Science Foundation of China (81322010 and 81170735), National 863 Program (2012AA02A509), Shanghai Rising Star Program (12QH1401700), Shanghai Talent Development Grant (2012041), Excellent Young Medical Expert of Shanghai (XYQ2011041), and National Young Top Talent Support Program. The authors would like to acknowledge support from the Hong Kong Foundation for Research and Development in Diabetes, established under the auspices of the Chinese University of Hong Kong, the Hong Kong government Research Grant Committee Central Allocation Scheme (CUHK 1/04C) and Theme-Based Research Scheme (T12-402/13-N), the Innovation and Technology Fund (ITS/088/08 and ITS/487/09FP), a Chinese University Direct Grant, and NIH grant NIH-RFA DK-085545-01 (from the National Institute of Diabetes and Digestive and Kidney Diseases). GenSalt is supported by research grants (U01HL072507, R01HL087263, and R01HL090682) from the NIH National Heart, Lung, and Blood Institute.
Duality of Interest. No potential conflicts of interest relevant to this article were reported.
Author Contributions. C.H., Q.C., S.J., W.Y.S., D.G., J.C.N.C., L.S.A., M.S., Y.Y.T., W.Z., N.K., J.H., X.O.S., R.C.W.M., T.K., W.J., T.M., L.Q., ES.T., K.L.M., B.-G.H., Y.S.C., and B.-J.K. supervised the study. J.-Y.H., C.H., S.J., D.G., S.M., J.E.H., L.S.A., W.Z., J.H., X.O.S., T.K., L.Q., K.L.M., B.-G.H., Y.S.C., and B.-J.K. conceived and designed the experiments. Y.T., Q.C., R.Z., D.G., J.H.O., Y.-J.K., F.J., S.M., J.E.H., J.S., and J.H. performed the experiments. J.-Y.H., X.S., Y.W., J.Lia., Y.T., C.H., K.H., C.H.T.T., Q.Z., F.T., M.J.G., R.T.H.O., Y.J.K., J.Lo., S.K., J.Liu, T.L.Y., Y.Y.T., L.Q., and Y.S.C. performed statistical analysis. J.-Y.H., X.S., Y.W., J.Lia., C.H., K.H., C.H.T.T., Q.Z., S.J., M.J.G., R.T.H.O., T.Y., W.Y.S., J.Lo., N.R.L., S.K., T.K., J.Liu, S.M., J.C.N.C., L.S.A., J.-B.B., T.L.Y., Y.Y.T., R.C.W.M., L.Q., K.L.M., and Y.S.C. analyzed the data. J.-Y.H., J.Lia., Y.T., Q.C., M.J.G., R.T.H.O., T.O., W.Y.S., J.Lo., S.K., T.K., J.Liu, S.U., J.C.N.C., W.L., K.J.J., T.N., M.H.L., T.L.Y., Y.K., N.T., H.O., S.-H.L., M.-H.S., D.H.S., B.Y.C., J.S., Y.-T.G., Y.-B.X., W.Z., M.Y., X.O.S., R.C.W.M., L.Q., and Y.S.C. interpreted the data. J.-Y.H., L.Q., ES.T., K.L.M., and Y.S.C. drafted or revised the manuscript. Reagents, materials, and analysis tools were contributed by J.-Y.H., J.Lia., Y.T., Q.C., M.J.G., R.T.H.O., T.O., W.Y.S., J.Lo., S.K., K.T., J.Liu, S.U., J.C.N.C., W.L., K.J.J., T.N., M.H.L., T.L.Y., Y.K., N.T., H.O., S.-H.L., M.-H.S., D.H.S., B.Y.C., J.S., Y.-T.G., Y.-B.X., W.Z., M.Y., X.O.S., R.C.W.M., L.Q., and Y.S.C.
Y.S.C. is the guarantor of this work and, as such, had full access to all the data in the study and takes responsibility for the integrity of the data and the accuracy of the data analysis.
Appendix
The programs discussed in the Research Design and Methods section are available from the following Web sites: PLINK, http://pngu.mgh.harvard.edu/~purcell/plink; WGAViewer, http://compute1.lsrc.duke.edu/softwares/WGAViewer; METAL, http://www.sph.umich.edu/csg/abecasis/Metal/index.html; SNAP, http://www.broadinstitute.org/mpg/snap; HapMap, http://hapmap.ncbi.nlm.nih.gov; LocusZoom, http://csg.sph.umich.edu/locuszoom; GRAIL, http://www.broadinstitute.org/mpg/grail.
Footnotes
This article contains Supplementary Data online at http://diabetes.diabetesjournals.org/lookup/suppl/doi:10.2337/db14-0563/-/DC1.
J.-Y.H., X.S., Y.W., J.Lia., Y.T., C.H., K.H., C.H.T.T., Q.C., Q.Z., S.J., and F.T. contributed equally as co-first authors.
N.K., M.Y., J.H., X.O.S., R.C.W.M., T.K., W.J., T.M., L.Q., ES.T., K.L.M., B.-G.H., Y.S.C., and B.-J.K. jointly supervised this work.
References
- 1.Bouatia-Naji N, Bonnefond A, Cavalcanti-Proença C, et al. A variant near MTNR1B is associated with increased fasting plasma glucose levels and type 2 diabetes risk. Nat Genet 2009;41:89–94 [DOI] [PubMed] [Google Scholar]
- 2.Dupuis J, Langenberg C, Prokopenko I, et al. DIAGRAM Consortium. GIANT Consortium. Global BPgen Consortium. Anders Hamsten on behalf of Procardis Consortium. MAGIC Investigators . New genetic loci implicated in fasting glucose homeostasis and their impact on type 2 diabetes risk. Nat Genet 2010;42:105–116 [DOI] [PMC free article] [PubMed] [Google Scholar]
- 3.Shaye K, Amir T, Shlomo S, Yechezkel S. Fasting glucose levels within the high normal range predict cardiovascular outcome. Am Heart J 2012;164:111–116 [DOI] [PMC free article] [PubMed] [Google Scholar]
- 4.Henkin L, Bergman RN, Bowden DW, et al. Genetic epidemiology of insulin resistance and visceral adiposity. The IRAS Family Study design and methods. Ann Epidemiol 2003;13:211–217 [DOI] [PubMed] [Google Scholar]
- 5.Freeman MS, Mansfield MW, Barrett JH, Grant PJ. Heritability of features of the insulin resistance syndrome in a community-based study of healthy families. Diabet Med 2002;19:994–999 [DOI] [PubMed] [Google Scholar]
- 6.Li WD, Dong C, Li D, Garrigan C, Price RA. A quantitative trait locus influencing fasting plasma glucose in chromosome region 18q22-23. Diabetes 2004;53:2487–2491 [DOI] [PubMed] [Google Scholar]
- 7.Manning AK, Hivert MF, Scott RA, et al. DIAbetes Genetics Replication And Meta-analysis (DIAGRAM) Consortium. Multiple Tissue Human Expression Resource (MUTHER) Consortium . A genome-wide approach accounting for body mass index identifies genetic variants influencing fasting glycemic traits and insulin resistance. Nat Genet 2012;44:659–669 [DOI] [PMC free article] [PubMed] [Google Scholar]
- 8.Scott RA, Lagou V, Welch RP, et al. DIAbetes Genetics Replication and Meta-analysis (DIAGRAM) Consortium . Large-scale association analyses identify new loci influencing glycemic traits and provide insight into the underlying biological pathways. Nat Genet 2012;44:991–1005 [DOI] [PMC free article] [PubMed] [Google Scholar]
- 9.Kim YJ, Go MJ, Hu C, et al. MAGIC consortium . Large-scale genome-wide association studies in East Asians identify new genetic loci influencing metabolic traits. Nat Genet 2011;43:990–995 [DOI] [PubMed] [Google Scholar]
- 10.Panagiotou OA, Willer CJ, Hirschhorn JN, Ioannidis JP. The power of meta-analysis in genome-wide association studies. Annu Rev Genomics Hum Genet 2013;14:441–465 [DOI] [PMC free article] [PubMed] [Google Scholar]
- 11.Cho YS, Chen CH, Hu C, et al. DIAGRAM Consortium. MuTHER Consortium . Meta-analysis of genome-wide association studies identifies eight new loci for type 2 diabetes in east Asians. Nat Genet 2012;44:67–72 [DOI] [PMC free article] [PubMed] [Google Scholar]
- 12.Raychaudhuri S, Plenge RM, Rossin EJ, et al. International Schizophrenia Consortium . Identifying relationships among genomic disease regions: predicting genes at pathogenic SNP associations and rare deletions. PLoS Genet 2009;5:e1000534. [DOI] [PMC free article] [PubMed] [Google Scholar]
- 13.Okamoto Y, Ogawa W, Nishizawa A, et al. Restoration of glucokinase expression in the liver normalizes postprandial glucose disposal in mice with hepatic deficiency of PDK1. Diabetes 2007;56:1000–1009 [DOI] [PubMed] [Google Scholar]
- 14.El Ouaamari A, Baroukh N, Martens GA, Lebrun P, Pipeleers D, van Obberghen E. miR-375 targets 3′-phosphoinositide-dependent protein kinase-1 and regulates glucose-induced biological responses in pancreatic beta-cells. Diabetes 2008;57:2708–2717 [DOI] [PMC free article] [PubMed] [Google Scholar]
- 15.Idevall-Hagren O, Barg S, Gylfe E, Tengholm A. cAMP mediators of pulsatile insulin secretion from glucose-stimulated single beta-cells. J Biol Chem 2010;285:23007–23018 [DOI] [PMC free article] [PubMed] [Google Scholar]
- 16.Kakinuma N, Roy BC, Zhu Y, Wang Y, Kiyama R. Kank regulates RhoA-dependent formation of actin stress fibers and cell migration via 14-3-3 in PI3K-Akt signaling. J Cell Biol 2008;181:537–549 [DOI] [PMC free article] [PubMed] [Google Scholar]
- 17.Huyghe JR, Jackson AU, Fogarty MP, et al. Exome array analysis identifies new loci and low-frequency variants influencing insulin processing and secretion. Nat Genet 2013;45:197–201 [DOI] [PMC free article] [PubMed] [Google Scholar]
- 18.Tabangin ME, Woo JG, Martin LJ. The effect of minor allele frequency on the likelihood of obtaining false positives. BMC Proc 2009;3(Suppl. 7):S41 [DOI] [PMC free article] [PubMed] [Google Scholar]
- 19.LeRoith D, Yakar S. Mechanisms of disease: metabolic effects of growth hormone and insulin-like growth factor 1. Nat Clin Pract Endocrinol Metab 2007;3:302–310 [DOI] [PubMed] [Google Scholar]
- 20.Withers DJ, Burks DJ, Towery HH, Altamuro SL, Flint CL, White MF. Irs-2 coordinates Igf-1 receptor-mediated beta-cell development and peripheral insulin signalling. Nat Genet 1999;23:32–40 [DOI] [PubMed] [Google Scholar]
- 21.Riedemann J, Macaulay VM. IGF1R signalling and its inhibition. Endocr Relat Cancer 2006;13(Suppl. 1):S33–S43 [DOI] [PubMed] [Google Scholar]
- 22.Köttgen A, Albrecht E, Teumer A, et al. LifeLines Cohort Study. CARDIoGRAM Consortium. DIAGRAM Consortium. ICBP Consortium. MAGIC Consortium . Genome-wide association analyses identify 18 new loci associated with serum urate concentrations. Nat Genet 2013;45:145–154 [DOI] [PMC free article] [PubMed] [Google Scholar]
- 23.Hairong Nan, Zengchang Pang, Shaojie Wang, et al. Serum uric acid, plasma glucose and diabetes. Diab Vasc Dis Res 2010;7:40–46 [DOI] [PubMed] [Google Scholar]
- 24.Sookoian S, Gianotti TF, Gemma C, Burgueño AL, Pirola CJ. Role of genetic variation in insulin-like growth factor 1 receptor on insulin resistance and arterial hypertension. J Hypertens 2010;28:1194–1202 [DOI] [PubMed] [Google Scholar]
- 25.Le Roith D, Kim H, Fernandez AM, Accili D. Inactivation of muscle insulin and IGF-I receptors and insulin responsiveness. Curr Opin Clin Nutr Metab Care 2002;5:371–375 [DOI] [PubMed] [Google Scholar]
- 26.Kulkarni RN, Holzenberger M, Shih DQ, et al. Beta-cell-specific deletion of the Igf1 receptor leads to hyperinsulinemia and glucose intolerance but does not alter beta-cell mass. Nat Genet 2002;31:111–115 [DOI] [PubMed] [Google Scholar]
- 27.Cornu M, Modi H, Kawamori D, Kulkarni RN, Joffraud M, Thorens B. Glucagon-like peptide-1 increases beta-cell glucose competence and proliferation by translational induction of insulin-like growth factor-1 receptor expression. J Biol Chem 2010;285:10538–10545 [DOI] [PMC free article] [PubMed] [Google Scholar]
Associated Data
This section collects any data citations, data availability statements, or supplementary materials included in this article.