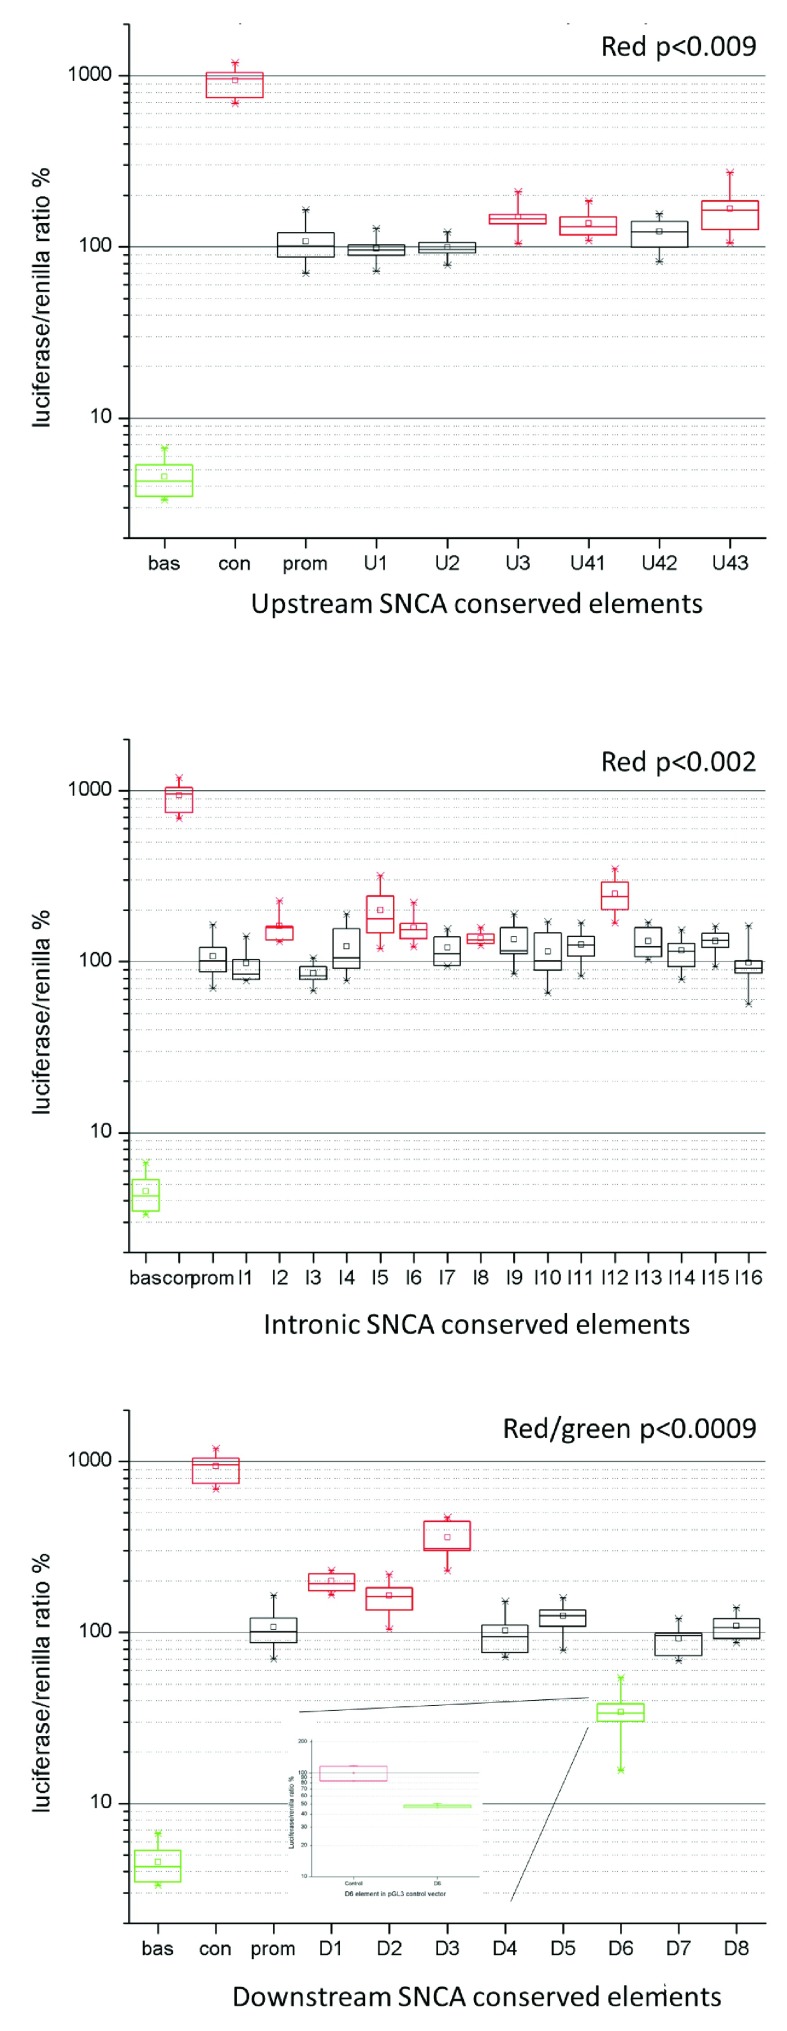
Figure 2. Non-coding conserved elements within the SNCA genomic locus show changes in luciferase assays.
Panels A–C show the luciferase assay results of ncECRs upstream ( A), intragenic ( B), and downstream ( C) of the SNCA gene. The X-axis shows the ncECRs, the Y-axis shows the ratio of luciferase and renilla expression as percentage. Bas=pGL3 basic, Con=pGL3 control, prom=pGL3 promoter construct. All red or green box plot elements represent ncECRs that modulate expression significantly. The box plots show the median (horizontal line within box), the 25 and 75% tiles (horizontal borders of box), and the whiskers show the minimal and maximal values. Panel C, insert: Luciferase assay results of D6 element cloned into the pGL3 control vector construct.

