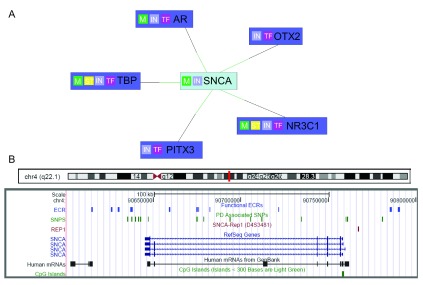
Figure 3. In silico analysis reveals midbrain transcription factors binding to two ncECRs.

A. MatInspector network view of SNCA promoter interaction with TFs that also potentially bind to two ncECRs (I12 and D6) within the SNCA gene. M=gene product is part of metabolic pathway, IN=input gene, TF=transcription factor, ST=gene product is part of signal transduction pathway, green line=matches target promoter B. UCSC Genome browser custom track of PD associated SNPs (based on PD Gene metaanalysis), Rep1 allele and functional ECR regions on chromosome 4 (Human Genome Assembly Feb. 2009, GRCh37/hg19).
