

Abstract
Three-photon excitation fluorescence correlation spectroscopy was used to detect oligomerization equilibria of rat liver phosphofructokinase. The fluorescence intensity produced by the three-photon excitation of tryptophan was collected using the DIVER microscope. In this home-built upright microscope, a large area photomultiplier, placed directly below the sample, is used as the detector. The lack of optical elements in the microscope detection path results in a significantly improved detection efficiency in the UV region down to about 300 nm, which encompasses the fluorescence emission from tryptophan. The three-photon excitation autocorrelation decays obtained for phosphofructokinase in the presence of F6P showed the presence of large oligomers. Substitution of F6P with ATP in the buffer medium results in dissociation of the large oligomers, which is reported by the decreased autocorrelation amplitude. The three-photon excitation process was verified from the slope of the log–log plot of intensity against laser power.
Introduction
The only naturally fluorescent amino acids are the aromatics, i.e., tryptophan, tyrosine, and phenylalanine, but in general tryptophan fluorescence dominates tyrosine fluorescence, and both dominate phenylalanine fluorescence.1,2 The endogenous fluorescence from tryptophan has been used to study properties of proteins since the original observation by Weber.3,4 Tryptophan usually dominates protein emission, not only because it has a higher extinction coefficient than tyrosine (5579 M–1 cm–1 at 279 nm for tryptophan versus 1405 M–1 cm–1 at 275 nm for tyrosine) but also because tyrosine can be so readily quenched in the protein matrix. Fluorescence methodologies have been used for several decades to study protein oligomerization and aggregations.1,5−10 A comparatively modern method to determine protein oligomerization and association–dissociation equilibrium at low concentration levels originates from the analysis of fluctuations in fluorescence intensity. Techniques based on fluctuations in fluorescence intensity, namely single point fluorescence correlation spectroscopy (FCS), raster image correlation spectroscopy (RICS), photon counting histogram (PCH), and number and brightness (N&B), have been used to study protein interactions both in vitro and in vivo.11−23 One of the main drawbacks to these methods, however, is that they almost always require addition of an external fluorophore, either an organic or inorganic molecule or a fluorescent protein. Tryptophans are endogenously present in almost all proteins, and hence it would be useful if the fluorescence from tryptophan residues could be used for the fluorescence fluctuation based techniques.
The main difficulties of using tryptophan as a fluorescent probe in the fluctuation based techniques are severalfold. These difficulties include the need for ultraviolet excitation, the optical transmission properties of the components of the commercial laser scanning microscope, and the relative low brightness of the tryptophan fluorescence. The laser sources directly capable of excitation at 280 nm are very limited, and FCS requires a highly focused excitation source, like that provided by a laser. A second option involves using an optical parametric oscillator (OPO) to achieve two-photon excitation by doubling an original wavelength of 560 nm.24 This arrangement involves complicated laser alignment and is difficult to operate. Instead, we chose to use three-photon excitation by utilizing the 840 nm emission of a commercially available titanium–sapphire laser as the excitation source. The three-photon excitation has a very low probability of absorption and requires higher power than the two-photon excitation. However, this power is still easily achievable with commercial Ti–sapphire lasers.
Experimental Section
As mentioned, the transmission properties of the optics of commercial laser scanning microscopes present a problem for work with ultraviolet light wavelengths. The scanning mirrors and the lenses have good transmissions above 400 nm, but the transmitted signal decreases dramatically in the UV. The objectives usually used for the excitation and collection of fluorescence in the epi configuration of a microscope do not transmit below 370 nm, except for quartz objectives. Combinations of these optical elements result in low efficiency of photon detection in the UV range of tryptophan emission. Thus, for excitation using UV lasers, both excitation and emission efficiencies are adversely affected. However, for multiphoton excitation, the excitation is not in the UV and only the emission suffers. To circumvent this difficulty, we used the home-built DIVER (deep imaging via enhanced-photon recovery) microscope, originally designed for deep tissue imaging,25−27 to measure intensity fluctuations resulting from tryptophan fluorescence. The excitation part of the DIVER microscope has the regular upright configuration of a commercial microscope. The three-photon excitation of tryptophan requires an excitation wavelength near 840 nm, and this wavelength transmission is not affected by the objective. The high UV sensitivity of DIVER comes from the simplicity and lack of optics in the detection part of the microscope. The sample is placed directly above the filter wheel assembly and the filter wheel assembly is housed on top of the wide area PMT detector. Thus, the fluorescence in the forward direction goes through the filter assembly and is collected by the PMT (Figure 1a). The combination of a BG39 filter (placed to protect the PMT from direct light at 840 nm) and an UG11 filter results in fluorescence detection from 300 to 400 nm (magenta shaded area in Figure 1b) which is suitable for tryptophan fluorescence. The simplicity of the emission path of the DIVER results in higher sensitivity of the UV emission and makes it especially suitable for UV detection, for both harmonic generation and fluorescence.
Figure 1.
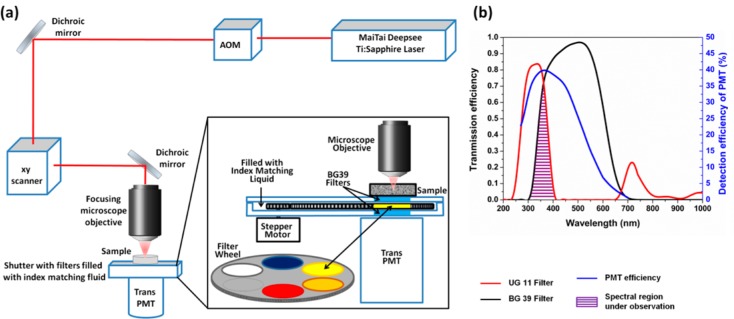
Schematic representation of the DIVER microscope setup.25,26 (a) The upright excitation scheme and positioning of sample directly on top of wide area PMT. The inset shows the construction of the filter wheel assembly. (b) Overlap of the transmission spectra of the filters used, UG11 (red line) and BG39 (black line), and the detection efficiency of the PMT (blue line). The overlapped wavelength area (purple) is used for detection of tryptophan fluorescence.
Results and Discussion
The experiments to obtain three-photon excitation FCS had three main objectives. The first one involved proving that three-photon excitation can be achieved using a commercial Ti–sapphire laser in the DIVER. To obtain evidence of the three-photon effect, log–log plots of intensity against laser power were constructed. The slope of the linear fit of this plot is indicative of the multiphoton effect and a slope of one, two, or three indicates the one-photon, two-photon, or three-photon effect, respectively.28,29 Fluorescence intensity traces of four different samples: N-acetyl-l-tryptophanamide (NATA) and three tryptophan-containing protein systems, α-chymotrypsinogen A, rat liver phosphofructokinase, and phage F1 virus, were measured as a function of increasing laser power and the log–log plots of observed count rate versus excitation power were constructed. Figure 2 represents these plots, and in each of these cases the value of the slope of the linear fit has a value close to three, determining the three-photon excitation. We note that the concentrations used for these experiments were much higher than those used for the subsequent FCS experiments, since the goal was simply to observe the effect of excitation power on the count rate.
Figure 2.

Excitation power dependence of (a) NATA, (b) α-chymotrypsinogen A, (c) phosphofructokinase, and (d) phage F1 virus. The slopes of the linear fits were around 3, demonstrating three-photon excitation of these molecules.
Once it was determined that the fluorescence from the three-photon excitation effect can indeed be achieved in the DIVER microscope the next step was to determine the point spread function (PSF) for the three-photon excitation. Unlabeled polystyrene beads (d = 100 nm) were embedded in a gelatin matrix and excited with 1038 nm (λ/3 = 1038/3 = 346 nm). These beads absorb at 840 nm (wavelength of tryptophan excitation), but the gelatin matrix melts due to a local heating effect and local motions start complicating the measurements. To obtain the PSF, z-stack images of these beads were measured with a pixel size of 0.012 μm and Z steps of 0.20 μm. Prior to imaging, the beads were sonicated for 2 h to ensure minimal aggregation. The 3D image was reconstructed using SimFCS, developed by Dr. Enrico Gratton at the Laboratory for Fluorescence Dynamics at the University of California, Irvine. SimFCS was also used for the data acquisition by the DIVER and for further analysis described in this study. The size of the bead was smaller than the PSF, and thus deconvolution of the intensity image with the size of the bead resulted in the calculation of the size of the PSF, 0.2 μm in the XY and 0.5 μm at the Z axis. This value is similar to those obtained by Schrader et al. for the three-photon excitation at 900 nm.30
Figure 3.
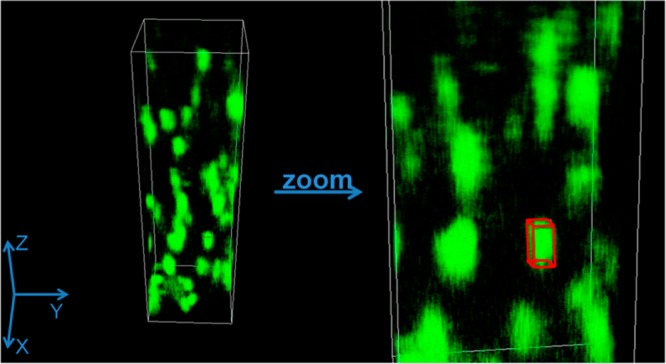
3D reconstruction of the Z stack image of polystyrene beads embedded in gelatin matrix when excited with 1038 nm laser line. The sizes of the images of beads were measured using the measuring cuboid (shown in red in the zoomed in image).
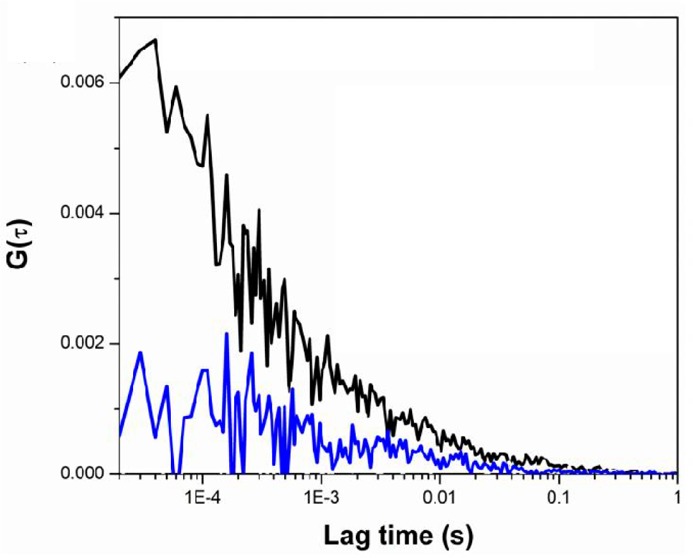
The next step was to obtain three-photon excitation FCS and study the oligomerization equilibrium of the rat liver phosphofructokinase (PFK). Rat liver phosphofructokinase is believed to exist as a tetramer in the presence of MgATP and in the absence of fructose-6-phosphate (F6P). In the presence of F6P, the tetramers associate and create larger oligomers, believed to be an octamer of tetramers.31−34 There are ten tryptophans present in each monomeric unit of the phosphofructokinase, and thus the tetramer and the octamer of tetramers contain 40 and 320 tryptophan residues, respectively.35 The large number of tryptophans increases the particle brightness, defined as counts per protein (molecule) per second, and makes the fluorescence easier to detect at the low concentration of protein required to have sufficient fluctuations in the excitation/emission volume. This brightness also enables us to readily distinguish fluorescence from the background signal. The three-photon excitation FCS decays were measured for the 20 and 7 μM subunit (i.e., monomer) concentration of PFK in 20 mM MOPS buffer in the presence of 5 mM F6P and after substitution of F6P with 5 mM ATP. 5 mM MgCl2 was present in all samples. The results are presented in Figure 4. In the presence of F6P the correlation is much more prominent than the one in the presence of ATP, and the ratio of the two G(0) values are ≈6.2. This observation is due to the fact that in the presence of F6P the major contributing species to the correlation function is the octamer of tetramers. In a solution containing just the octamer of tetramers, the concentration of fluorescent species is one-eighth compared to the same solution containing only tetramers. The amplitude of the correlation function G(0) is inversely proportional to the concentration, and thus the octamer of tetramers in the presence of F6P has a higher correlation amplitude. When F6P is substituted with ATP, the large oligomers dissociate and the major contributing species becomes the tetramers. Thus, the concentration increases and the amplitude of the autocorrelation decreases. The ratio of G(0) values indicates this change in concentration.
Figure 4.
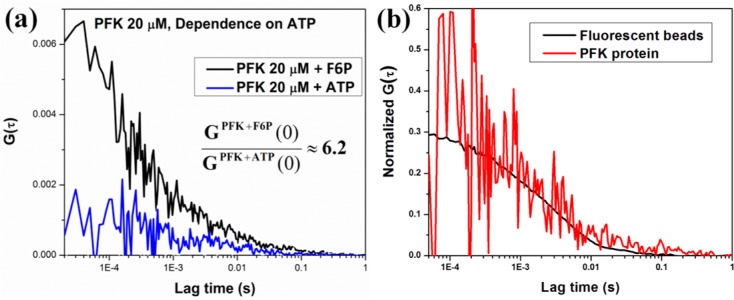
(a) Single point FCS decays of the phosphofructokinase (PFK) in the presence of fructose 6 phosphate (F6P) (black) and in the presence of ATP (blue). (b) Overlap of normalized autocorrelation functions of PFK (red), 100 nm polystyrene beads (black).
To compare the time scales of autocorrelation decays of biological systems with different sizes, three-photon excitation FCS decays were measured for 100 nm polystyrene beads along with the PFK protein. The normalized autocorrelation decays of these two samples are plotted in Figure 4b, and the red and black colors represent the decays for PFK and beads, respectively. These correlation decays were fitted with the following diffusion equation to obtain characteristic diffusion time of these two samples:
| 1 |
where τD is the characteristic diffusion time of a biomolecule and s is the shape factor and has a value of 2.5. The octamer of tetramers are the main contributors toward the FCS decays of PFK in the presence of F6P and have a characteristic diffusion time of 1.45 ± 0.1 ms. This value is similar to that obtained for the correlation decays of the 100 nm polystyrene beads (1.65 ± 0.1 ms). These results demonstrate that three-photon excitation FCS can indeed be achieved and used to study oligomerization equilibrium using the commercially available Ti–sapphire laser and the high sensitivity and forward geometry of the DIVER microscope.
In this study we have shown and expanded the idea of using three-photon excitation FCS to look at the oligomerization equilibria of proteins using their intrinsic tryptophan fluorescence. We have demonstrated that the combination of the UV sensitivity of the DIVER microscope and three-photon excitation achieved by the Ti–sapphire laser allow this experiments to be feasible. Multiphoton excitation was used before to excite tryptophan, for FCS measurements and for imaging.36−39 The detection limits for the two-photon excitation FCS varied from a few million (highly unlikely in biological systems) to a few hundred tryptophans in each unit of the fluorescent species. In the most recent paper involving measurement of FCS curves in proteins using tryptophan fluorescence by Sahoo et al.,38 the authors looked at aggregated proteins containing greater than 300 000 tryptophan residues. In our system, to obtain a clean correlation decay in ∼5 min acquisition time, the number of tryptophan residues in a protein complex present at submicromolar oligomer concentration is required to be ∼200. This observation shows the extraordinary sensitivity of DIVER combined with three-photon excitation can lead to a single-point FCS measurement of proteins in buffer. Three-photon FCS was previously tried for understanding dynamics in DNA.40 This study used extrinsic label of DNA base analogue 2-aminopurine, and the corresponding correlation decay was very noisy and was not used by the authors to calculate diffusion. Currently we are trying to improve the sensitivity of the system and to use this system to look at virus particles in more detail. The final goal is to follow the infection process of virus particles without labeling and to monitor the real time state of infection. The very large number of tryptophans in viruses can be useful for the strong signal-to-noise ratio and identification of virus capsid inside the cells. The three-photon excitation FCS can also be extended to study other protein oligomerization processes, provided there are enough tryptophan to give rise to significant signal-to-noise ratio.
Acknowledgments
The authors thank Carissa Vetromile and Patton Garay for their assistance in the early stages of this work. This work was supported in part by Grants NIH P41-GM103540, P50-GM076516 (E.G. and S.R.), and GM033216 (G.D.R.) and Robert A. Welch Grant A1543 (G.D.R.).
The authors declare no competing financial interest.
Funding Statement
National Institutes of Health, United States
References
- Jameson D. M.Introduction to Fluorescence; Taylor and Francis Publishers: New York, 2014. [Google Scholar]
- Lakowicz J. R.Principles of Fluorescence Spectroscopy; Springer: Berlin, 2006; Vol. 1. [Google Scholar]
- Weber G.; Teale F. W. J. Ultraviolet Fluorescence of Aromatic Amino Acids. Biochem. J. 1957, 65, 476–482. [DOI] [PMC free article] [PubMed] [Google Scholar]
- Teale F. W. J.; Weber G. Ultraviolet Fluorescence of Proteins. Biochem. J. 1959, 72, 15. [Google Scholar]
- Beechem J. M.; Brand L. Time-Resolved Fluorescence of Proteins. Annu. Rev. Biochem. 1985, 54, 43–71. [DOI] [PubMed] [Google Scholar]
- Jameson D. M.; Reinhart G. D.. Fluorescent Biomolecules: Methodologies and Applications; Plenum Press: New York, 1989. [Google Scholar]
- Jameson D. M.; Sawyer W. H. Fluorescence Anisotropy Applied to Biomolecular Interactions. Methods Enzymol. 1995, 246, 283–300. [DOI] [PubMed] [Google Scholar]
- Chen Y.; Barkley M. D. Toward Understanding Tryptophan Fluorescence in Proteins. Biochemistry 1998, 37, 9976–9982. [DOI] [PubMed] [Google Scholar]
- Giepmans B. N. G.; Adams S. R.; Ellisman M. H.; Tsien R. Y. The Fluorescent Toolbox for Assessing Protein Location and Function. Science 2006, 312, 217–224. [DOI] [PubMed] [Google Scholar]
- Gell D.; Grant R.; Mackay J.. The Detection and Quantitation of Protein Oligomerization. In Protein Dimerization and Oligomerization in Biology; Springer: New York, 2012; Vol. 747, pp 19–41. [DOI] [PubMed] [Google Scholar]
- Magde D.; Elson E. L.; Webb W. W. Fluorescence Correlation Spectroscopy. II. An Experimental Realization. Biopolymers 1974, 13, 29–61. [DOI] [PubMed] [Google Scholar]
- Digman M. A.; Gratton E. Fluorescence Correlation Spectroscopy and Fluorescence Cross-Correlation Spectroscopy. Wiley Interdiscip Rev. Syst. Biol. Med. 2009, 1, 273–282. [DOI] [PMC free article] [PubMed] [Google Scholar]
- Schwille P.; Korlach J.; Webb W. W. Fluorescence Correlation Spectroscopy with Single-Molecule Sensitivity on Cell and Model Membranes. Cytometry 1999, 36, 176–82. [DOI] [PubMed] [Google Scholar]
- Digman M. A.; Dalal R.; Horwitz A. F.; Gratton E. Mapping the Number of Molecules and Brightness in the Laser Scanning Microscope. Biophys. J. 2008, 94, 2320–2332. [DOI] [PMC free article] [PubMed] [Google Scholar]
- Ossato G.; Digman M. A.; Aitken C.; Lukacsovich T.; Marsh J. L.; Gratton E. A Two-Step Path to Inclusion Formation of Huntingtin Peptides Revealed by Number and Brightness Analysis. Biophys. J. 2010, 98, 3078–3085. [DOI] [PMC free article] [PubMed] [Google Scholar]
- Digman M. A.; Stakic M.; Gratton E. Raster Image Correlation Spectroscopy and Number and Brightness Analysis. Fluoresc. Fluctuation Spectrosc., Part A 2013, 518, 121–144. [DOI] [PubMed] [Google Scholar]
- Rossow M. J.; Sasaki J. M.; Digman M. A.; Gratton E. Raster Image Correlation Spectroscopy in Live Cells. Nat. Protoc. 2010, 5, 1761–1774. [DOI] [PMC free article] [PubMed] [Google Scholar]
- Chen Y.; Muller J. D.; So P. T. C.; Gratton E. The Photon Counting Histogram in Fluorescence Fluctuation Spectroscopy. Biophys. J. 1999, 77, 553–567. [DOI] [PMC free article] [PubMed] [Google Scholar]
- Muller J. D.; Chen Y.; Gratton E. Resolving Heterogeneity on the Single Molecular Level with the Photon-Counting Histogram. Biophys. J. 2000, 78, 474–486. [DOI] [PMC free article] [PubMed] [Google Scholar]
- Muller J. D.; Chen Y.; Gratton E. Resolving Heterogeneity on the Single Molecular Level with the Photon-Counting Histogram. Biophys. J. 2000, 78, 474–486. [DOI] [PMC free article] [PubMed] [Google Scholar]
- Jameson D. M.; James N. G.; Albanesi J. P. Fluorescence Fluctuation Analysis Approaches to the Study of Receptors in Live Cells. Methods Enzymol. 2013, 519, 87–113. [DOI] [PubMed] [Google Scholar]
- Chakraborty M.; Kuriata A. M.; Henderson J. N.; Salvucci M. E.; Wachter R. M.; Levitus M. Protein Oligomerization Monitored by Fluorescence Fluctuation Spectroscopy: Self-Assembly of Rubisco Activase. Biophys. J. 2012, 103, 949–958. [DOI] [PMC free article] [PubMed] [Google Scholar]
- Haustein E.; Schwille P. Fluorescence Correlation Spectroscopy: Novel Variations of an Established Technique. Annu. Rev. Biophys. Biomol. Struct. 2007, 36, 151–169. [DOI] [PubMed] [Google Scholar]
- Nishimura G.; Kinjo M. Multi-Photon Fluorescence Correlation Spectroscopy: A Quantification of Tryptophan Methylester Solutions by Visible Emission. Opt. Rev. 2003, 10, 588–591. [Google Scholar]
- Crosignani V.; Dvornikov A.; Aguilar J. S.; Stringari C.; Edwards R.; Mantulin W. W.; Gratton E. Deep Tissue Fluorescence Imaging and in Vivo Biological Applications. J. Biomed. Opt. 2012, 17, 116023–1–116023–7. [DOI] [PMC free article] [PubMed] [Google Scholar]
- Crosignani V.; Dvornikov A.; Gratton E. Enhancement of Imaging Depth in Turbid Media Using a Wide Area Detector. J. Biophotonics 2011, 4, 592–599. [DOI] [PMC free article] [PubMed] [Google Scholar]
- Crosignani V.; Jahid S.; Dvornikov A. S.; Gratton E. A Deep Tissue Fluorescence Imaging System with Enhanced SHG Detection Capabilities. Microsc. Res. Tech. 2014, 77, 368–373. [DOI] [PMC free article] [PubMed] [Google Scholar]
- Gryczynski I.; Malak H.; Lakowicz J. R. Three-Photon Excitation of a Tryptophan Derivative Using a Fs-Ti:Sapphire Laser. Biospectroscopy 1996, 2, 9–15. [Google Scholar]
- Gryczynski I.; Malak H.; Lakowicz J. R. Three-Photon Excitation of N-Acetyl-L-Tyrosinamide. Biophys. Chem. 1999, 79, 25–32. [DOI] [PubMed] [Google Scholar]
- Schrader M.; Bahlmann K.; Hell S. W. Three-Photon-Excitation Microscopy: Theory, Experiment and Applications. Optik 1997, 104, 116–124. [Google Scholar]
- Reinhart G. D.; Lardy H. A. Rat-Liver Phosphofructokinase - Kinetic Activity under Near-Physiological Conditions. Biochemistry 1980, 19, 1477–1484. [DOI] [PubMed] [Google Scholar]
- Reinhart G. D.; Lardy H. A. Rat-Liver Phosphofructokinase - Kinetic and Physiological Ramifications of the Aggregation Behavior. Biochemistry 1980, 19, 1491–1495. [DOI] [PubMed] [Google Scholar]
- Reinhart G. D.; Lardy H. A. Rat-Liver Phosphofructokinase - Use of Fluorescence Polarization to Study Aggregation at Low Protein-Concentration. Biochemistry 1980, 19, 1484–1490. [DOI] [PubMed] [Google Scholar]
- Reinhart G. D.; Hartleip S. B. Perturbation of the Quaternary Structure and Allosteric Behavior of Rat Liver Phosphofructokinase by Polyethylene Glycol. Arch. Biochem. Biophys. 1987, 258, 65–76. [DOI] [PubMed] [Google Scholar]
- Kwitek A. E.; Gullings-Handley J.; Yu J. M.; Carlos D. C.; Orlebeke K.; Nie J.; Eckert J.; Lemke A.; Andrae J. W.; Bromberg S.; et al. High-Density Rat Radiation Hybrid Maps Containing over 24,000 SSLPs, Genes, and ESTs Provide a Direct Link to the Rat Genome Sequence. Genome Res. 2004, 14, 750–757. [DOI] [PMC free article] [PubMed] [Google Scholar]
- Horton N. G.; Wang K.; Kobat D.; Clark C. G.; Wise F. W.; Schaffer C. B.; Xu C. In Vivo Three-Photon Microscopy of Subcortical Structures within an Intact Mouse Brain. Nat. Photonics 2013, 7, 205–209. [DOI] [PMC free article] [PubMed] [Google Scholar]
- Lippitz M.; Erker W.; Decker H.; van Holde K. E.; Basche T. Two-Photon Excitation Microscopy of Tryptophan-Containing Proteins. Proc. Natl. Acad. Sci. U. S. A. 2002, 99, 2772–2777. [DOI] [PMC free article] [PubMed] [Google Scholar]
- Sahoo B.; Balaji J.; Nag S.; Kumar S.; Maitia S. Protein Aggregation Probed by Two-Photon Fluorescence Correlation Spectroscopy of Native Tryptophan. J. Chem. Phys. 2008, 129, 0751031–0751035. [DOI] [PubMed] [Google Scholar]
- Xu C.; Zipfel W.; Shear J. B.; Williams R. M.; Webb W. W. Multiphoton Fluorescence Excitation: New Spectral Windows for Biological Nonlinear Microscopy. Proc. Natl. Acad. Sci. U. S. A. 1996, 93, 10763–10768. [DOI] [PMC free article] [PubMed] [Google Scholar]
- Katilius E.; Woodbury N. W. Multi-Photon Excitation Fluorescence Correlation Spectroscopy of Fluorescent DNA Base Analogs. Proc. SPIE 2004, 5232, 160–167. [Google Scholar]