

Abstract
Background:
Clinical assessment of lower limb kinematics during dynamic tasks may identify individuals who demonstrate abnormal movement patterns that may lead to etiology of exacerbation of knee conditions such as patellofemoral joint (PFJt) pain.
Purpose:
The purpose of this study was to determine the reliability, validity and associated measurement error of a clinically appropriate two‐dimensional (2‐D) procedure of quantifying frontal plane knee alignment during single limb squats.
Methods:
Nine female and nine male recreationally active subjects with no history of PFJt pain had frontal plane limb alignment assessed using three‐dimensional (3‐D) motion analysis and digital video cameras (2‐D analysis) while performing single limb squats. The association between 2‐D and 3‐D measures was quantified using Pearson's product correlation coefficients. Intraclass correlation coefficients (ICCs) were determined for within‐ and between‐session reliability of 2‐D data and standard error of measurement (SEM) was used to establish measurement error.
Results:
Frontal plane limb alignment assessed with 2‐D analysis demonstrated good correlation compared with 3‐D methods (r = 0.64 to 0.78, p < 0.001). Within‐session (0.86) and between‐session ICCs (0.74) demonstrated good reliability for 2‐D measures and SEM scores ranged from 2° to 4°.
Conclusion:
2‐D measures have good consistency and may provide a valid measure of lower limb alignment when compared to existing 3‐D methods.
Clinical Relevance:
Assessment of lower limb kinematics using 2‐D methods may be an accurate and clinically useful alternative to 3‐D motion analysis when identifying individuals who demonstrate abnormal movement patterns associated with PFJt pain.
Level of Evidence:
2b
Keywords: Patellofemoral joint pain, dynamic knee valgus, functional tasks
INTRODUCTION
Individuals with patellofemoral joint (PFJt) pain have been found to demonstrate abnormal lower extremity mechanics during functional tasks such as running,1 hop landing,2 step‐down manoeuvres3 and single limb squats.4,5 Altered frontal plane knee alignment during such activity is often expressed as “dynamic knee valgus”.6 Dynamic knee valgus is characterised by excessive knee abduction, combined with femoral adduction and internal rotation and relative external tibial rotation6 and is thought to result due to weakness or diminished or delayed neuromuscular activation of hip musculature.5 Control of frontal plane knee motion is important, as dynamic knee valgus during functional activity may result in increased frontal plane loading of the PFJt7‐10 and contribute to etiology or exacerbation of PFJt pain symptoms.1‐3,10 Identification of individuals who demonstrate excessive knee valgus during functional tasks may allow for identification and modification of abnormal movement patterns.
Three‐dimensional (3‐D) motion analysis systems are the established method of quantifying frontal plane knee alignment during functional tasks due to their high levels of accuracy and reliability.5 However, the clinical use of 3‐D motion analysis is limited by financial, spatial and supportive co‐operative costs associated with this system.11,5 An alternative to 3‐D motion analysis is the use of two‐dimensional (2‐D) video analysis procedures where standard video cameras are used to capture performance of functional tasks which are then imported into software packages that perform kinematic analysis.12 Therefore, 2‐D video analysis may provide clinicians with a useful tool that is a portable, inexpensive and readily available.11,13,5 However, although 2‐D video analysis has advantages in terms of cost and ease of use, in order for clinicians to provide objective clinical measures of frontal plane knee alignment, the use of 2‐D video analysis as a clinical measurement tool depends on the reliability and validity of the kinematic data it produces.
A number of studies have been conducted to examine the validity and reliability of 2‐D video analysis of movement patterns during functional tasks.11,5,14 McLean et al11 reported a moderate relationship between 2‐D and 3‐D methods with 2‐D peak frontal plane knee alignment accounting for 58% to 64% of the variance in average peak 3‐D knee abduction angle between subjects during side‐step and side‐jump activities. In contrast, Willson and Davis5 found that 2‐D frontal plane knee alignment reflected 23% to 30% of the variance of 3‐D values during single limb squats. However, the authors did note that subjects with more negative 2‐D values during the squats demonstrated significantly increased knee external rotation and hip adduction, which are important components of dynamic knee valgus.
These studies suggest that frontal plane knee alignment is not a result of a single joint motion but is likely made up of movements including hip adduction, hip internal rotation, knee valgus and tibial external rotation.1‐3,10 Two‐dimensional video analyses may not be able to demonstrate the same level of accuracy as 3‐D methods when quantifying each of these movements independently. However, the potential for a 2‐D approach to assessing frontal plane knee alignment during functional tasks should not be discounted.
Therefore, the purpose of this study was to describe a 2‐D video capture procedure that quantifies frontal plane knee alignment as a single measure (frontal plane projection angle, FPPA) during single limb squats at 60° of knee flexion. The validity of 2‐D FPPA will be determined by correlating 2‐D results with those determined from established methods (3‐D motion analysis). In addition, 2‐D methods will be assessed for reliability and associated measurement error.
METHODS
Subjects
Eighteen recreationally active subjects (nine females and nine males) were recruited. The average age of the subjects were 31 ± 9 years, average height was 171 ± 9 cm, average body mass was 71 ± 15 kg and average BMI was 24 ± 4 kg/m2. Potential subjects were excluded from participating if they experienced lower extremity pain during functional movements, had apparent gait dysfunction, had a history of trauma or surgery to the lower limb in the past 12 months, or if they could not achieve 60° of knee flexion during single limb squats. Written informed consent was obtained from all subjects before participation and the study was approved by The School Research Ethics Committee at Cardiff Metropolitan University.
Data Collection
Kinematic data was collected on two different occasions separated by approximately one week. On each occasion subjects had frontal plane alignment of the knee (FPPA) assessed during a single limb squat manoeuvre at 60° of knee flexion; with one session utilizing 2‐D analysis methods and the second using 3‐D methods, with the order of testing randomised for each subject. Eight of the 18 subjects returned to have 2‐D FPPA assessed on one further occasion at least 48 hours after initial 2‐D testing in order to establish between‐session reliability.
A 12‐camera motion capture system (Vicon MCAM1; Oxford Metrics Group, Oxford UK) was used to acquire 3‐D marker data during single limb squats at a sampling frequency of 120 Hz. A modified Cleveland Clinic lower body marker configuration (Motion Analysis Corp, Santa Rosa, USA) was applied to each subject by a single experimenter. Tracking markers (9 mm diameter) were placed with double‐sided tape over the following anatomical landmarks: bilateral acromium processes, anteriorsuperior iliac spine (ASIS), posteriorsuperior iliac spine (PSIS), iliac crest, medial and lateral femoral condyles, medial and lateral malleoli, calcaneus, and first, second and fifth metatarsal heads. Lateral thigh and shank clusters consisting of three non‐collinear markers secured to each leg also acted as tracking markers. Temporary markers on the medial femoral condyle, medial malleolus and first and fifth metatarsophalangeal joints were used for a static calibration trial only and were removed prior to the dynamic trials. Three usable dynamic trials were collected for each subject.
Three‐dimensional co‐ordinates for the static and dynamic trials were reconstructed and exported in C3D format for further analysis within Vicon Nexus 1.4 software (Oxford Metrics Group, Oxford, UK). Each trial was processed and any gaps identified were interpolated with gaps greater than 10 frames checked manually for errors in marker tracking. A lower extremity kinematic model was created for each subject using Visual 3‐D motion capture software (Version 5, C‐motion Inc., Rockville, MD, USA). The model included the thigh, shank and foot segments. All lower extremity segments were modelled as conical frustra based on inertial parameters estimated from anthropometric data.15 From the static trial, the hip joint centres were estimated using fixed percentages of the ASIS breadth along the x, y and z axes. For the dynamic trials, the remaining lower extremity markers and static trial data were used to estimate knee and ankle joint centres. From these segments, the FPPA was quantified using a standard joint co‐ordinate system. Based on previous work by Yu et al,16 the 3‐D marker co‐ordinates were filtered using a fourth‐order, zero‐lag, low‐pass Butterworth filter with a cut off frequency of 12 Hz.
Two‐dimensional video footage of single limb squats was recorded by two commercially available digital video cameras (Sony Handycam DCR‐HC37, Tokyo, Japan) sampling at a frequency of 40Hz. Camera one was placed at a distance of 3 m from the subject perpendicular to the frontal plane and at the height of the subjects knee, while camera two was placed at the same height and distance from the subject and perpendicular to the sagittal plane. All digital video footage was recorded at a standard (10x) optical zoom throughout each trial to standardize the camera position between subjects. Digital footage recorded by both cameras was synchronised at the point of initial ground contact, determined using a light stimulus within the digital video camera’s field of view.
In order to determine FPPA from 2‐D video capture, reflective markers (9mm diameter) were attached at each ASIS, at the midpoint of the femoral condyles to approximate the centre of the knee joint, the midpoint of the ankle malleoli for the centre of the ankle joint to approximate the radiographic landmarks employed by Willson and Davis5 (Figure 1). The midpoints were determined using a standard tape measure, and all markers were placed by the same experimenter. Markers were used to determine joint centres as this method has been shown to increase intra‐and inter‐rater reliability in comparison to manual digitisation of the joint centres via video.17 Digital videos of each single limb squat were imported and markers digitized using Quintic Biomechanics software package (9.03 version 17, Quintic Consultancy Ltd, Coventry, UK). All digitizing was performed by the same experimenter and each trial was re‐digitized on three different occasions with the mean value used for further analysis.
Figure 1.
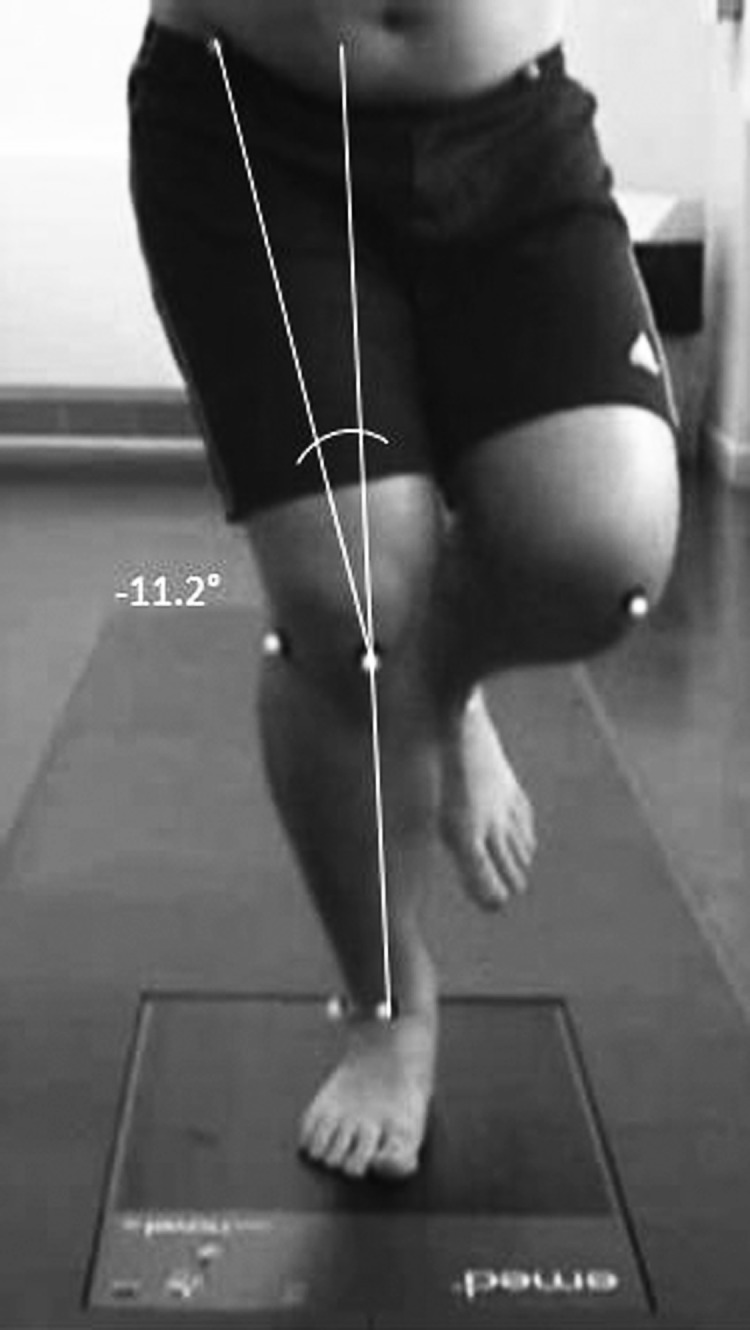
Frontal plane projection angle (FPPA) during a single limb squat.
Frontal Plane Projection Angle (FPPA)
FPPA was calculated by measuring the angle formed by lines drawn between the thigh and hip markers and between the ankle and knee markers (Figure 1). As described by Willson and Davis5 from a frontal view, when the knee marker was medial to a line from the ankle marker to the thigh marker, the FPPA was negative. The FPPA was positive if the knee marker was lateral to a line drawn from ankle marker to the thigh marker. Negative FPPA values reflected knee valgus, excursion of the knee toward the midline of the body and positive FPPA values reflected knee varus.
The FPPA of each limb was calculated in static single limb stance to determine starting joint positions and then again at 60° of knee flexion. Based on previous work by Van der Leeden et al18 the mean FPPA value from three trials was used for analysis as this was found to be the minimum number of measurements needed to be able to obtain a consistent average and could also be used to assess for within‐session reliability.
Single Limb Squats
Single limb squats were performed by subjects as described previously5,19 with the experimenter providing a demonstration of the squatting technique and providing standardised verbal instructions. Subjects were instructed to stand barefoot on the test limb with the opposite limb flexed at the knee to approximately 90°. Each subject had their arms folded in front of their body to assist with balance and was looking straight ahead. Subjects were asked to perform single limb squats to 60° of knee flexion in a controlled manner and without losing balance, before returning to the starting position.
Squat depth was limited to approximately 60°15,20 in order to avoid higher joint forces associated with increased ranges of motion that may exacerbate knee pain symptoms in individuals with PFJt pain.21 Each squat was performed over a five second period at a standardized speed with the experimenter acting as a counter. The first count initiated the movement, the third indicated the lowest point of the squat and the fifth indicated the end. There was a two‐minute recovery period between squats to minimise the effect of fatigue. Trials were only accepted if the subject appeared to squat to the 60° minimum desired degree of knee flexion at a constant speed and maintained balance throughout. Trials not meeting these criteria were excluded and another trial was collected. Prior to testing subjects practiced, four to six times, the single limb squats in order to warm‐up and familiarize themselves with the test. Subjects were given feedback on the depth of the squats (using a standard goniometer) and speed of their squats during these trials until they could consistently and accurately perform the test movement.
Statistical Analysis
Descriptive statistics including mean, standard deviation and range values were calculated for each trial. A paired samples t test was used to test for differences between 2‐D and 3‐D methods. The alpha level was set at p <.05 for all tests. Pearson correlation coefficients (r) were used to analyze association between 2‐D and 3‐D methods. The magnitude of correlations were interpreted as small (0 to 0.3), moderate (0.3 to 0.5), large (0.5 to 0.7) and very large (0.7 to 1.0).22
Concurrent validity between 2‐D and 3‐D methods was graphically illustrated using a Bland‐Altman plot,23 which charts the difference between FPPA values calculated by the 2‐D and 3‐D methods against the combined mean to allow visualization of the direction of dispersion of each data point from the combined mean. Good agreement between methods is indicated if variation between upper and lower limits of agreement is low (< 5°).24
The relative reliability for 2‐D FPPA measurements was determined by calculating intraclass correlation coefficents (ICCs) and 95% confidence intervals (CI) for within‐session (ICC3,1) and between‐session reliability (ICC2,1).25 Within‐session reliability was calculated based on data 2‐D FPPA data collected from three trials performed during the same session, and between‐session reliability was estimated using the mean of three trials performed when eight subjects were re‐tested seven days post initial testing. ICC values were interpreted according to criteria outlined by Coppieters et al:26 poor < .40, fair .40 to .70, good .70 to .90, and excellent > .90. All statistical analysis was conducted using SPSS (Version 20.0 Chicago, IL, USA).
Measurement error scores were established by calculating the standard error of measurement (SEM). The SEM provides a value for random measurement error in the same unit as the measurement itself, quantifies within‐subject variability, and reflects the amount of measurement error for any given trial (within‐session reliability) and for any test occasion (between‐session reliability).27
RESULTS
Descriptive statistics for 2‐D and 3‐D FPPA during stance and for the single limb squats are presented in Table 1. The first aim of the study was to compare FFPA assessed using 2‐D analysis to FPPA measures taken from established 3‐D analysis methods during single limb stance and squats. Two‐dimensional methods were found to be highly correlated with 3‐D methods during stance (r = 0.64, p = 0.002, 95% CI = 0.25 to 0.91) and single limb squats (r = 0.78, p = <0.001, 95% CI = 0.49 to 0.91) (Table 2) (Figure 2). Examination of Bland‐Altman plots and calculation of upper and lower limits of agreement indicated that variability in difference scores between 2‐D and 3‐D FPPA measures fell within the pre‐determined limit of 5° (Figure 3). The second aim of the study was to examine within‐session, between‐session and associated measurement error of 2‐D FPPA during single limb squats. Two‐dimensional FPPA measures demonstrated good within‐session (ICC3, 1 = 0.86, 95% CI = 0.94 to 0.72), and between‐session (ICC2, 1 = 0.78, 95% CI = 0.18 to 0.97) reliability. SEM values for 2‐D FPPA ranged from 2° to 4° (Table 3).
Table 1.
Descriptive statistics of 2‐D and 3‐D measures during single limb stance and single limb squats.
| METHOD | FPPA (°) | SD | 95% CI | SEM (°) |
|---|---|---|---|---|
| 2‐D (STANCE) | ‐4.88 | 2.94 | −6.34 to −3.42 | 0.69 |
| 3‐D (STANCE) | −6.44 | 4.14 | −8.50 to −4.38 | 0.98 |
| 2‐D (SLS) | −7.80 | 7.33 | −11.45 to −4.16 | 1.73 |
| 3‐D (SLS) | −6.83 | 6.53 | −10.07 to −3.58 | 1.54 |
FPPA = frontal plane projection angle; SD = standard deviation; CI = confidence interval; SEM = standard error of measurement; 2‐D = two dimensional motion analysis; 3‐D = three dimensional motion analysis.
Table 2.
Pearson correlation coefficients (r) and p values demonstrating correlation between 2‐D FPPA and 3‐D methods during single limb squats.
| FPPA | r | P | 95% CI |
|---|---|---|---|
| Static Trial | 0.64 | 0.002 | 0.25 to 0.85 |
| Single Limb Squat Trial | 0.78 | <0.001 | 0.49 to 0.91 |
FPPA = frontal plane projection angle; CI = confidence interval.
Figure 2.

Scatterplot illustrating association between frontal plane knee alignment (FPPA) assessed using 2‐D (x‐axis) and 3‐D methods (y‐axis) during single limb squats at 60° of knee flexion.
Figure 3.

Bland‐Altman plot demonstrating agreement between methods. The solid horizontal line represents the mean differences, and dashed lines the 95% limits of agreement.
Table 3.
Within‐ and between‐session reliability of 2‐D FPPA measures.
| ICC | 95% CI | SEM (°) | |
|---|---|---|---|
| Within‐day | 0.86 | 0.94 to 0.72 | 2.10 |
| Between‐day | 0.74 | 0.18 to 0.97 | 3.82 |
FPPA = frontal plane projection angle; CI = confidence interval; SEM = standard error of measurement.
DISCUSSION
Previous researchers have suggested that abnormal frontal plane alignment of the knee during functional tasks may increase loading of the PFJt7‐10 and contribute to etiology or exacerbation of knee conditions including PFJt pain.1‐3,10 Objective clinical measures of frontal plane knee alignment are important in identifying individuals who demonstrate excessive knee valgus during functional tasks as abnormal movement patterns can be recognized and subsequent training and intervention programs aimed at reducing frontal plane malalignment can be evaluated.13 Two‐dimensional video analysis may be a cheaper, and easier to operate method compared to established 3‐D methods. However, the use of 2‐D video analysis as a clinical measurement tool depends on the reliability and validity of the kinematic data it produces.
Supporting the authors' first hypothesis, average 2‐D FPPA obtained from video analysis during single limb stance (r = 0.64, p = 0.002) and single limb squats (r = 0.78, p = <0.001) were consistent with 3‐D FPPA calculations of the same activities. During single limb squats this equated to 2‐D FPPA accounting for 61% of the variance in 3‐D knee valgus. Similar associations have been reported by McLean et al11 who found that 2‐D peak FPPA explained 58% to 64% of the variance in average peak 3‐D knee valgus between subjects during side‐step and side‐jump activities. However, these results are in contrast to Willson and Davis5 who reported small, non‐significant correlations between 2‐D FPPA and 3‐D knee valgus angle (r = 0.21, p = .20) during single limb squats.
Willson and Davis5 suggest that the lack of association between measurements may be due to the degree of knee valgus at which FPPA is recorded during functional tasks. Both McLean et al11 and the present study recorded greater FPPA values than those achieved by Willson and Davis5, indicating that FPPA was recorded at a point during the functional task in which knee valgus was more pronounced. Willson and Davis5 recorded 2‐D data at approximately 55° of knee flexion, whereas McLean et al12 obtained 2‐D FPPA at the instance of peak knee abduction, and the present study assessed 2‐D FPPA at 60° of knee flexion, which for many of the subjects was the maximum achievable knee flexion angle. Therefore, a threshold degree of knee flexion may exist (possibly >55°) that when reached during functional tasks compromises frontal plane knee control and results in more pronounced knee motion in the frontal plane. At the present time, it is unclear whether such a relationship exists and whether assessing frontal plane knee alignment when knee valgus is most pronounced increases validity of 2‐D measures with more research needed in this area.
The second aim of the study was to assess within‐and between‐session reliability and measurement error associated with of 2‐D video analysis. Measurement of 2‐D FPPA during single limb squats was found to have good within‐session reliability (ICC = 0.86), which is consistent with previous investigations by Munro et al14 and Willson et al19 who reported ICCs of 0.72 and 0.88 respectively when assessing within‐session 2‐D FPPA during single limb squats. Good within‐session or intra‐tester reliability achieved in the present study is important as it gives an insight into the accuracy of 2‐D video analysis with potential random error associated with 2‐D FPPA measurements reduced if data are consistent. In addition, between‐session reliability in the current study was good (ICC = 0.74) and similar to values reported previously by Munro et al14 when assessing 2‐D FPPA during single limb squats (ICC = 0.80). Good between‐session ICCs indicates good test‐retest reliability and reproducibility of observed values when 2‐D FPPA measurement is repeated over time.
The ICC provides an estimate of relative reliability for consistency of 2‐D FPPA measurement and reflects the test’s ability to differentiate between participants both within‐ and between sessions. However, the ICC does not provide information about the accuracy of individual 2‐D FPPA scores. The standard error of measurement (SEM) is a measure of absolute reliability that can be used to enhance clinical decision making by quantifying the reliability of 2‐D FPPA scores within individual participants on different occasions.24 SEM can communicate measurement error associated with 2‐D FPPA video analysis in clinically useful terms as it is expressed in the same units as the original measure. The present study found within‐session SEM values of 2° and between‐session SEM values of 4°.
To the author’s knowledge, the only comparable study is by Munro et al,14 who reported similar SEM values of approximately 3° when assessing between‐session reliability of 2‐D FPPA during single limb squats. The slightly higher SEM found in the current study compared to Munro et al14 is likely due to factors such as marker placement error, data filtering methods, and the increased possibility of within‐subject performance variation between sessions. In addition, a Bland Altman plot was created to assess agreement between 2‐D and 3‐D methods. Upper and lower limits of agreement indicated that variability in difference scores between 2‐D and 3‐D FPPA measures fell within 5°, which has been suggested to be a clinically acceptable range of error when using standard goniometry.25
One of the limitations of this study is that the sample population were all recreationally active university staff and students who were assessed during single limb squats. The discrepancy in frontal plane knee motion observed from this and other studies suggests that FPPA is a measure that varies across tasks and subject populations. Therefore, the results may not differentiate between men and women or be applicable to other populations such as elite athletes, adolescent and older age groups, or individuals with lower limb injury. In addition, the present study only assessed intra‐rater reliability and may not achieve the same levels of reliability if multiple raters are used. Future studies should focus on assessing 2‐D FPPA reliability and validity in different populations and include inter‐rater reliability.
Another limitation of this study was that only the dominant lower limb was assessed during single limb squats. This decision was based on evidence suggesting that the dominant limb displays more high risk neuromuscular characteristics than the non‐dominant limb28 and may be more important when assessing for excessive knee valgus. However, it may be that both the dominant and non‐dominant limb is equally at risk of excessive frontal plane motion associated with knee conditions such as PFJt pain. During dynamic tasks the dominant limb may be over‐utilised and put under more strain, while the non‐dominant limb, may be being under‐utilized and made slightly weaker and more prone to excessive knee valgus. Therefore, future research should require experimenters to examine both lower limbs when assessing frontal plane knee alignment during functional tasks.
CONCLUSION
The results of the present study suggest that 2‐D video analysis is significantly correlated with 3‐D frontal plane measures during single limb squats, and demonstrates good within‐ and between‐session reliability as well as acceptable measurement error. Whilst 2‐D FPPA may not be as accurate as 3‐D analysis in quantifying each independent movement that contributes to dynamic knee valgus, it may provide clinicians with a useful tool that is portable, inexpensive and readily available that can be used to assess frontal plane knee alignment during functional tasks. Objective clinical assessment of lower limb kinematics during dynamic tasks may identify individuals who demonstrate abnormal movement patterns that may lead to etiology of exacerbation of knee conditions such as PFJt pain. The results of this study may not be generalizable to all populations as it is unclear whether injury, age, or activity levels may influence 2‐D FPPA measurements. Thus, these results may not be applicable to elite athletes, adolescents, or patients from older age groups. Also, only intra‐rater reliability was assessed in this study; further study on other populations and assessment of inter‐rater reliability is therefore required.
REFERENCES
- 1.Dierks TA Manal KT Hamill J, et al. Proximal and distal influences on hip and knee kinematics in runners with patellofemoral pain during a prolonged run. J Ortho Sports Phys Ther. 2008; 38:448‐456. [DOI] [PubMed] [Google Scholar]
- 2.Herrington L Knee valgus angle during single leg squat and landing in patellofemoral pain patients and controls. Knee. 2014; 21:514‐517. [DOI] [PubMed] [Google Scholar]
- 3.Boling MC Padua DA Marshall SW, et al. A Prospective Investigation of Biomechanical Risk Factors for Patellofemoral Pain Syndrome The Joint Undertaking to Monitor and Prevent ACL Injury (JUMP‐ACL) Cohort. Am J Sports Med. 2009; 37:2108‐2116. [DOI] [PMC free article] [PubMed] [Google Scholar]
- 4.Crossley K Zhang W Schache A, et al. Performance on single limb squat task indicates hip muscle function. Am J Sports Med. 2011; 39:866‐873. [DOI] [PubMed] [Google Scholar]
- 5.Willson JD Davis I Utility of the frontal plane projection angle in females with patellofemoral pain. J Ortho Sports Phys Ther. 2008b; 36:606‐615. [DOI] [PubMed] [Google Scholar]
- 6.Hewett TE Myer GD Ford KR, et al. Biomechanical measures of neuromuscular control and valgus loading of the knee predict anterior cruciate ligament injury risk in female athletes: a prospective study. Am J Sports Med. 2005; 33:492‐501. [DOI] [PubMed] [Google Scholar]
- 7.Chen YJ Sher 1 Powers CM Quantification of patellofemoral joint reaction forces during functional tasks: a subject specific, three dimensional model. J Appl Biomech. 2010; 26:415‐423. [DOI] [PubMed] [Google Scholar]
- 8.Huberti HH Hayes WC Patellofemoral contact pressures. The influence of q‐angle and tendofemoral contact. J Bone Joint Surg Am. 1984; 66:715‐724. [PubMed] [Google Scholar]
- 9.Myer GD Ford KR Khoury J, et al. Development and validation of a clinic‐based prediction tool to identify female athletes at high risk for anterior cruciate ligament injury. Am J Sports Med. 2010; 38:2025‐2033. [DOI] [PMC free article] [PubMed] [Google Scholar]
- 10.Powers CM The Influence of Abnormal Hip Mechanics on Knee Injury: A Biomechanical Perspective. J Ortho Sports Phys Ther. 2010; 40:42‐51. [DOI] [PubMed] [Google Scholar]
- 11.McLean SG Walker K Ford KR, et al. Evaluation of a two‐dimensional analysis method as a screening and evaluation tool for anterior cruciate ligament injury. Br J Sports Med. 2005; 39:355‐362. [DOI] [PMC free article] [PubMed] [Google Scholar]
- 12.Norris BS Olson SL Concurrent validity and reliability of two dimensional video analyses of hip and knee motion during mechanical lifting. Physiother Theory Pract. 2011; 27:521‐530. [DOI] [PubMed] [Google Scholar]
- 13.Noyes FR Barber‐Westin SD Fleckenstein C, et al. The drop‐jump screening test: difference in lower limb control by gender and effect of neuromuscular training in female athletes. Am J Sports Med. 2005; 33:197‐207. [DOI] [PubMed] [Google Scholar]
- 14.Munro A Herrington L Carolan M Reliability of 2‐dimensional video assessment of frontal plane dynamic knee valgus during common athletic screening tasks. J Sport Rehabil. 2012; 21:7‐11. [DOI] [PubMed] [Google Scholar]
- 15.Claiborne TL Armstrong CW Gandhi V, et al. Relationship between hip and knee strength and knee valgus during a single leg squat. J Appl Biomech. 2006; 22:41‐50. [DOI] [PubMed] [Google Scholar]
- 16.Yu B Gabriel D Noble L, et al. Estimate of the optimum cutoff frequency for the Butterworth low‐pass digital filter. J Appl Biomech. 1999; 15:318‐329. [Google Scholar]
- 17.Bartlett R Bussey M Flyger N Movement variability cannot be determined reliably from no‐marker conditions. J Biomech. 2006; 39:3076‐3079. [DOI] [PubMed] [Google Scholar]
- 18.Van der Leeden M Dekker JH Siemonsma PC, et al. Reproducability of plantar pressure measurements in patients with chronic arthritis: a comparison of one‐step, two‐step, and three‐step protocols and an estimate of the number of measurements required. Foot Ankle Int. 2004; 25:739‐744. [DOI] [PubMed] [Google Scholar]
- 19.Willson JD Ireland ML Davis I Core strength and lower extremity alignment during single‐leg squats. Med Sci Sports Exerc. 2006; 38:945‐952. [DOI] [PubMed] [Google Scholar]
- 20.Bittencourt NFN Ocarino JM Mendonca LD, et al. Foot and hip contributions to high frontal plane knee projection angle in athletes: a classification and regression tree approach. J Ortho Sports Phys Ther. 2012; 42:996‐1004. [DOI] [PubMed] [Google Scholar]
- 21.Wallace DA Salem GJ Salinas R, et al. Patellofemoral joint kinetics while squatting with and without an external load. J Ortho Sports Phys Ther. 2002; 32:141‐148. [DOI] [PubMed] [Google Scholar]
- 22. Hopkins WG Marshall SW Batterham AM, et al. Progressive Statistics for Studies in Sports Medicine and Exercise Science. Med Sci Sports Exer. 2009; 41:3‐12. [DOI] [PubMed] [Google Scholar]
- 23.Bland JM Altman DG Statistical methods for assessing agreement between two methods of clinical measurement. Int J Nursing Studies. 2010; 47:931‐936. [PubMed] [Google Scholar]
- 24.Stratford PW Getting more from the literature: estimating the standard error of measurement from reliability studies. Physiother Can. 2004; 56:27‐30. [Google Scholar]
- 25.Shrout PE Fleiss JL Intraclass Correlations ‐ Uses in Assessing Rater Reliability. Psychological Bulletin. 1979; 86:420‐428. [DOI] [PubMed] [Google Scholar]
- 26.Coppieters M Stappaerts K Janssens K, et al. Reliability of detecting ‘onset of pain’ and ‘submaximal pain’ during neural provocation testing of the upper quadrant. Physiother Res Int. 2002; 7:146‐156. [DOI] [PubMed] [Google Scholar]
- 27.Lexell JE Downham DY How to assess reliability of measurements in rehabilitation. Am J Phys Med Rehabil. 2005; 84:719‐723. [DOI] [PubMed] [Google Scholar]
- 28.Ford KR Myer GD Hewett TE Valgus knee motion during landing in high school female and male basketball players. Med Sci Sports Exer. 2003; 35:1745‐1750. [DOI] [PubMed] [Google Scholar]