

Abstract
Inflammation is essential in defense against infection or injury. It is tightly regulated, as over-response can be detrimental, especially in immune-privileged organs such as the central nervous system (CNS). Microglia constitutes the major source of inflammatory factors, but are also involved in the regulation of the inflammation and in the reparation. Autotaxin (ATX), a phospholipase D, converts lysophosphatidylcholine into lysophosphatidic acid (LPA) and is upregulated in several CNS injuries. LPA, a pleiotropic immunomodulatory factor, can induce multiple cellular processes including morphological changes, proliferation, death and survival.
We investigated ATX effects on microglia inflammatory response to lipopolysaccharide (LPS), mimicking gram-negative infection. Murine BV-2 microglia and stable transfected, overexpressing ATX-BV-2 (A+) microglia were treated with LPS. Tumor necrosis factor α (TNFα), interleukin (IL)-6 and IL-10 mRNA and proteins levels were examined by qRT-PCR and ELISA, respectively. Secreted LPA was quantified by a radioenzymatic assay and microglial activation markers (CD11b, CD14, B7.1 and B7.2) were determined by flow cytometry.
ATX expression and LPA production were significantly enhanced in LPS treated BV-2 cells. LPS induction of mRNA and protein level for TNFα and IL-6 were inhibited in A+ cells, while IL-10 was increased. CD11b, CD14, and B7.1 and B7.2 expressions were reduced in A+ cells.
Our results strongly suggest deactivation of microglia and an IL-10 inhibitory of ATX with LPS induced microglia activation.
Keywords: Autotaxin, microglia, inflammation, lysophosphatidic acid
INTRODUCTION
Numerous and highly prevalent pathologies affecting the central nervous system (CNS) are associated with increased inflammation including multiple sclerosis, Parkinson disease, Alzheimer disease, and ischemic stroke [Czlonkowska and Kurkowska-Jastrzebska, 2011]. A controlled inflammatory response to infection or an injury can be beneficial, while an exacerbated or prolonged response can become detrimental. As an important source of inflammatory factors, microglia are integral to many of these disease related pathologies [Munoz-Fernandez and Fresno, 1998]. The activation program of microglia can be sequential and includes morphological, phenotypic, and functional changes [Ponomarev et al., 2006]. The multiple aspects of a microglia response and the need to appropriately regulate the pro-inflammatory and anti-inflammatory stages of a response have raised interest in identify endogenous factors contributing to this regulation.
Microglia express integrin alpha M (CD11b) and innate immunity receptors such as receptor and co-receptor of lipopolysacharide (LPS) (Toll-like receptor 4 (TLR4) and CD14). Infection can trigger these receptors and induce subsequent signal transduction, transcription factors and cytokine production. For instance, LPS can induce NF-kB through TLR4/CD14 interaction and increase proinflammatory cytokines such as, TNF alpha (TNFα), interleukin (IL-6) as well as anti-inflammatory cytokines such as, IL-10 (IL-10) [Aloisi et al., 1999; Bruce et al., 1996; Cacci et al., 2005]. Factors produced by activated microglia including cytokines, chemokines, and free radicals can be neurotoxic [Rock et al., 2004]. In association with the production of pro-inflammatory factors and polarization to an M1 phenotype, microglia increase expression of major histocompatibility complex (MHC) class I and II and co-stimulatory molecules (CD80 and CD86) [Mack et al., 2003; Ponomarev et al., 2005]. Recent data suggests that polarization of microglia to an anti-inflammatory/repair M2 phenotype with expression of IL-10 and TGFβ contributes to their role in reparation and regulation [Boche et al., 2013; Taylor and Sansing, 2013].
Understanding the progression of this injury program and associated regulatory factors has taken a prominent emphasis in neurodegenerative and neuro-reparative research. Within such a framework, a growing interest has emerged for the potential involvement of lysophosphatidic acid (LPA) [Zhao and Natarajan, 1831]. LPA is a phospholipid exerting numerous biological activities, including cell proliferation, differentiation, and migration. These actions occur through activation of specific G-protein coupled receptors [Ishii et al., 2004]. LPA is hydrolyzed from lysophosphatidylcholine (LPC) as a result of the secretion of the ectonucleotide pyrophosphatase phosphodiesterase-2 (ENPP2, autotaxin, ATX) enzyme exhibiting lysophospholipase D (lysoPLD) activity [Umezu-Goto et al., 2002]. ATX is a 125kDa enzyme released by cultured human melanoma cells [Stracke et al., 1992]. Recent work demonstrated a role for ATX in numerous physiological processes including cell motility, angiogenesis, and adipogenesis [Ferry et al., 2003; Nakanaga et al., 2010; van Meeteren et al., 2006] that are mediated mainly through LPA production [Okudaira et al., ; van Meeteren and Moolenaar, 2007]. ATX is known to be upregulated under various inflammatory conditions such the ones that occur in cancer, arthritis, or multiple sclerosis [Hammack et al., 2004; Liu et al., 2009a; Liu et al., 2009b; Nochi et al., 2008]. ATX is expressed within the subventricular zone and choroid plexus epithelium during development, and in the normal adult brain. However, it is also expressed in leptomeningeal cells and oligodendrocyte precursor cells [Savaskan et al., 2007]. Following traumatic injury, ATX expression is increased in reactive astrocytes [Savaskan et al., 2007]. A concurrent developmental profile for LPA receptor expression has been reported [Ohuchi et al., 2008]. The expression of ATX and LPA receptors temporally contribute to the differentiation of oligodendrocyte precursor cells [Yuelling and Fuss, 2008]. We recently reported that ATX could down-regulate an oxidative stress response in cultured microglia providing a protective effect to prevent cell death [Awada et al., 2012]. Given the critical functions of microglia in responding to and modulating brain injury, the ability of ATX to minimize microglia cell death associated with an oxidative stress response suggests a potential beneficial role for ATX in vivo [Awada et al., 2012]. We now demonstrate that LPS induces ATX production in BV-2 microglial cells and ATX overexpression inhibits LPS-induced pro-inflammatory cytokine elevation through up-regulation of the anti-inflammatory cytokine, interleukin-10 (IL-10).
METHODS
Microglial culture
A murine microglial BV-2 cell line (obtained from Pr. Philippe Gasque, GRI, la Reunion, France) and BV-2 cells transfected with pcDNA3 autotaxin (clones corresponding to the stable transfection of the empty vector (EV) and of ATX (A+) [Awada et al., 2012]) were maintained in Dulbecco’s Modified Eagle’s Medium (DMEM; Biotech, South America) supplemented with 10% fetal bovine serum (FBS; < 0.02 ng/mL endotoxin), 100 U/mL penicillin, and 100 μg/mL streptomycin at 37°C in a humidified incubator under and 95% air. Viability of ATX (+) cells was similar to that of non-transformed cells as assessed by trypan blue exclusion and cell counting. All culture reagents were obtained from Biotech. Cells were passage by trypsinization and all experiments were conducted on cells with less than 30 passages.
Primary microglia were prepared as previously described [Harry et al., 2002]. Briefly primary mixed glia cultures were prepared from the cortical layer of 2-day-old CD-1 mice. Meninges were carefully removed and tissue digested 20 min in 2.5 % trypsin and dissociated by trituration. Cells were collected through a series of centrifugation and filtration, resuspended in 10 ml DMEM/F12 media containing 10% heat inactivated low-endotoxin FBS, penicillin, and streptomycin and plated in T75 tissue culture flasks at a density of 1×10⁶ cells/ml. Cells were maintained in a as humidified tri-gas incubator under 5% CO2. Media was changed every 3 days thereafter. After 12 days in culture, cultures were shaken (180–200 rpm/4 hrs). The media was collected and centrifuged at 1200 rpm for 10 min and pelleted microglia cells were resuspended in complemented media and plated into poly L lysine coated 6-well Costar tissue culture plates at 105 cells per well. Cells were maintained under incubator conditions for 24 hrs prior to experimental manipulation.
LPS time course for TNF, IL-10 and ATX
BV-2 cells were plated at a density of 105 cells per well in sterile 6-well tissue culture plates and maintained for 24 hrs. Upon media change, individual wells of confluent cells were randomly assigned, in triplicate, as controls with normal culture medium or exposed for 4–24 hrs with LPS (10ng/mL or 1µg/mL; Escherichia coli K-235> 55.104 U/mg, Sigma, France) to determine the time course of response for mRNA levels of TNFα, IL-10, and ATX.
Cell dosing with LPS and Lysophosphatidic acid (LPA)
Based upon identification of a peak time for LPS-induced TNFα mRNA elevation (Fig. 1) the 4-hr timepoint was selected for further studies. Native BV-2 cells or primary microglia were plated at a density of 105 cells per well in 6-well plates (105 mm2). At 24 hrs, individual wells, in triplicate, were randomly assigned to treatment condition of either a media change to normal culture medium (control) or medium containing LPS (1 µg/mL). During the 4-hr exposure period cells were co-exposed to either control vehicle or 1 μM LPA (containing an oleic acid at the sn-1 position of the glycerol; Sigma-Aldridge, France). The presence of 1 μM LPA did not alter cell viability as assessed by trypan blue exclusion and cell counting.
Figure 1. TNFα, IL-10, ATX expression and LPA accumulation in LPS stimulated microglia.

BV-2 cells were incubated for 4, 8, 16 and 24 hours in the absence or presence of LPS (10ng/mL or 1µg/mL). mRNA level were determined by qRT-PCR for TNFα (A), IL-10 (B) and ATX (C). Results are the mean ± SD from at least three independent experiments performed in triplicate. Statistics are *** p<0.001, ** p<0.01, significantly different from control values, as determined by Dunnett’s t-test following a significant overall two way ANOVA (n=3–6).
Quantitative RT-PCR
Following the 4-hr incubation with or without LPS in the presence or absence of LPA, total RNA was extracted from BV-2 cells, EV, and A+ cells using Trizol reagent (Invitrogen, France). Six μg of RNA was reversed transcribed to cDNA using random primers (Sigma, St. Louis, MO) and Moloney Murine Leukemia Virus (MMLV, Invitrogen). cDNA was amplified by PCR (Biosystems, France) using the SYBR green master-mix (Eurogentec, Belgium) and specific murine primers (Table 1, Eurogentec). Each PCR cycle was conducted for 15sec at 95°C and 1min at 60°C. Relative RNA amounts were calculated with relative standard curves for each mRNA of interest and glyceraldehyde-3-phosphate dehydrogenase (GAPDH). Data was normalized relative to GAPDH for each individual sample and analyzed using ABI Prism 7000 SDS software.
Table 1.
Primers and probes for Real-Time Q-RT-PCR.
| Gene | Forward primer | Reverse primer |
|---|---|---|
| GAPDH | 5’-TTCACCACCATGGAGAAGGC- 3’ | 5’-GGCATGGACTGTGGTCATGA- 3’ |
| ATX | 5’-GACCCTAAAGCCATTATTGCTAA- 3’ | 5‘-GGGAAGGTGCTGTTTCATGT- 3‘ |
| TNFα | 5’-TGGCCTCCCTCTCATCAGTT- 3’ | 5‘-GCTTGTCACTCGAATTTTGAGAAG- 3’ |
| IL-6 | 5’-CAGAATTGCCATCGTACAACTCTTTTCTCA- 3’ | 5‘- AAGTGCATCATCGTTGTTCATACA- 3’ |
| IL-10 | 5‘-ACCTCCTCCACTGCCTTGCT- 3’ | 5‘-GGTTGCCAAGCCTTATCGGA- 3’ |
| LPA1 | 5‘-CATGGTGGCAATCTACGTCAA- 3’ | 5‘-AGGCCAATCCAGCGAAGAA- 3’ |
Quantification of LPA by radioenzymatic assay
Following the 4-hr incubation with 1µg/mL LPS, media was collected and the level of LPA determined from normal BV-2 cells. Lipids were extracted from the media with an equal volume of 1-butanol and evaporated (SC210A SpeedVac Plus; Thermoscientific, France). The total amount of LPA in the media was determined using a radioenzymatic assay as previously described [Saulnier-Blache et al., 2000]. Briefly, extracted lipids were converted to 14[C]-phosphatidic acid with recombinant LPA acyl-transferase in the presence of 14[C]-oleoyl-CoA. Reaction products were extracted with methanol and separated by one-dimensional silica gel 60 thin-layer chromatography (TLC) glass plate (Merck, Rahway, NJ). The separated bands were detected by direct digital autoradiography and X-ray film after contact autoradiography.
TNFα, IL-6, and IL-10 protein quantitation
After 4 hrs of exposure to normal media or LPS (1 µg/mL), media was collected from each of the cell lines, aliquoted (100 µL) and stored at −20°C. Protein levels of TNFα, IL-6 (eBioscience; Cliniscience, France), and IL-10 (Southern Biotech; Cliniscience, France) were determined by ELISA according to the manufacturer’s protocol. Briefly, adherent cells were scrapped from each well in 1 mL of ice-cold phosphate buffer saline (PBS) then lysed with 50 μL of lysis buffer (25 mM Tris, 10 mM KCl, 1 mM EDTA and 1% Triton). Total protein levels were determined by bicinchoninc acid agent as previously described [Smith et al., 1985].
Quantification of CD11b, CD14, CD80, and CD86 expression using flow cytometry
Following 4-hr incubation with normal media or LPS (1 µg/mL), cells were washed with ice cold PBS, scraped, and incubated with blocking buffer (PBS/1% bovine serum albumin (BSA)) for 10 min to block non-specific binding. Free-floating cells were incubated with mouse monoclonal antibodies to either CD11b, CD14, CD80, or CD86 (1:200 dilution in PBS/BSA 1%; Bioscience), for 1 hr at 4°C. Cells were then washed in PBS, incubated with phycoerythrin PE-conjugated secondary IgG (1:1000 dilution, Molecular Probes®, France) for 30 min at 4°C and analyzed by flow cytometry using FACScan flow cytometer (Becton Dickinson, France). The cytometer was operated at 488nm excitation laser. Red fluorescence was measured with a high pass filter at 630nm (FLH-2). The forward scatter (FSC) and side scatter (SSC) of particles passing the laser were determined.
NF-kB and AP-1 activation
RAW-Blue™ cells (Invivogen, France) derived from RAW 264.7 macrophages and stably transfected with a construct in which NF-kB and AP1 activation lead to the secretion of secreted embryonic alkaline phosphatase (SEAP) were used to assess NF-kB and AP-1 activation [Hoo et al.]. Cells were maintained in DMEM supplemented with 10% FBS and 200mg/mL G418 (normal culture medium) in a humidified incubator under 5% CO2 / 95% air. Cells (<15 passages) were resuspended in fresh normal culture medium and an 180μL aliquot of cell suspension (100,000 cells) was added per well of a 96-well tissue culture plate. Condition media (CM) was obtained as supernatants of BV-2 or A+ cells collected after 4 hrs. RAW-Blue cells were incubated (37°C; 5% CO2) for 4 hrs with normal culture medium, LPS (1 µg/mL), LPA (1 µM), or conditioned medium (CM). After incubation, 1.10−3 M p-nitrophenyl-phosphate (PNPP, Sigma, France; dissolved in 0.1M glycine buffer containing 1 mM MgCl2, 1mM ZnCl2, pH 10.4) was added to each well and the cells incubated at 37°C for 30 min. The conversion of PNPP + H2O to para-nitrophenol (PNP) + phosphate due to the presence of SEAP resulted in a change to a yellow color allowing for detection at 460 nm measured using a microplate reader (Fluostar; BMG, France). Data is presented as total absorbance relative to control.
Statistical analysis
Data were analyzed by either a Student’s t-test for two group comparisons or by an one way or two way ANOVA followed by a Dunnett’s or Tukey’s test for comparisons of multiple doses or times (GraphPad Prism version 6.0c for Mac OsX, GraphPad Software, La Jolla California USA). Statistical significance was set at p < 0.05. Data are expressed as mean ± SD from a minimum of three independent experiments (n=3 to 6) performed in triplicate.
RESULTS
LPS elevated TNFα and decreased IL-10 mRNA levels
Exposure of BV-2 cells to LPS produced a dose related elevation in TNFα mRNA levels (Fig. 1A). At both dose levels, TNFα mRNA levels were significantly elevated at 4 hrs. At 8 hrs, significant elevations were seen only in the 1µg/mL dose group with the lower 10 ng/mL dose group showing elevation but not reaching statistical significance. This was a transient response and by 16 and 24 hrs mRNA levels were not statistically different from control. At 1 µg/mL LPS, IL-10 mRNA levels were significantly decreased at 4, 8 and 16 hrs, returning to within control levels at 24 hrs (Fig. 1B). For the lower LPS dose (10ng/mL), a significant decrease in IL-10 was observed only at 8 hrs, returning to control levels by 16 hrs (Fig. 1B).
LPS elevated ATX mRNA levels and induced LPA production
Control cells displayed a detectable level of ATX mRNA that was significantly increased by LPS (1 µg/mL) at 4 – 16 hrs, returning to within control levels by 24 hrs (Fig. 1C). Following 4 hrs of exposure to LPS (1 µg/mL) the elevation in ATX mRNA levels was accompanied by a significant elevation of LPA released into the culture media compared to controls (Fig. 2) suggesting an increase in ATX activity.
Figure 2. LPA accumulation in LPS stimulated BV-2.

LPA accumulation was quantified by radioenzymatic assay after 4 hours of culture media from BV-2 cells untreated or in the presence of 1 µg/mL of LPS. Student T test **P<0.01.
Modulation of the LPS response by ATX
To examine the impact of ATX on LPS-induced TNFα, BV-2 cells and primary microglia were exposed to 1 µg/mL LPS in the absence or presence of 1 µM LPA for 4 hrs. In control cells, LPS induced changes in cell morphology consistent with activation and elevated the production of TNFα protein at a level comparable to that observed in the dose-ranging study. In the presence of LPA, the normal LPS-induced change in cell morphology was not observed and elevations in TNFα mRNA and protein levels were significantly lower as compared to the LPS-induced elevations observed in the absence of LPA (Fig. 3A, 3B). BV-2 cells transfected with the original plasmid PCDNA3 (EV) or with a PCDNA-ATX plasmid (A+) showed no evidence of decreased cell viability and failed to display the normal LPS (1 µg/mL) induced morphological changes. Rather, the cells maintained morphological features similar to control cells (data not shown).
Figure 3. Effect of LPA on LPS-induced TNFα protein.

BV-2 cells or primary microglia were treated for 4 hours with 1 µg/mL of LPS in the absence or presence of 1 µM LPA. TNFα mRNA levels were determined by qRT-PCR and TNFα protein levels by ELISA. Results are expressed as % of LPS response (LPS 100%). LPA alone did not change basal levels of TNFα mRNA or protein. Data represents the mean ± SD (n=3–6). *** p<0.001, * p<0.05 significantly different from LPS treated cells, as determined by Dunnett’s t-test following a significant overall ANOVA.
In BV2 cells, mRNA levels of LPA receptor 1 (LPA1) were expressed at a low level under control culture conditions and were not altered with LPS (1 µg/mL) exposure (Fig. 4A). In EV cells, the basal level of LPA1 mRNA was slightly, but not significantly, higher than controls. Upon stimulation with 1 µg/mL LPS, levels were significantly elevated. In the A+ cells, the overexpression of ATX resulted in a significant increase in mRNA levels for the LPA1 under control conditions and in presence of LPS (Fig. 4A). Upon stimulation with 1 µg/mL LPS, an increase in ATX mRNA levels was observed in all cell lines however, the level of induction over their cell specific controls was relatively small in the BV-2 and EV cells (Fig. 4B). As predicted, in the A+ cells, basal ATX mRNA levels were higher than those seen in the other two cell lines (data not shown) and, with LPS stimulation, there was a significant and pronounced elevation in ATX mRNA levels (Fig. 4B).
Figure 4. Effect of LPS and ATX on LPA receptor (LPA1) expression and ATX expression.

BV-2 cell, empty vector (EV) or autotaxin (A+) transfected cells were incubated for 4 hours in the absence or presence of LPS (1 µg/mL). mRNA encoding LPA1 (A) and ATX (B) were quantified by RT PCR as described in the Materials and Methods. Results are the mean ± SD from experiments performed in triplicate. * p<0.05, **p<0.01, *** p<0.001, LPS treated values significantly different from control values (BV2, EV, A+); ### p<0.001, Overexpressing ATX (A+) values significantly different from EV values, as determined by Tukey’s post hoc analysis following a significant overall two way ANOVA (n=3).
TNFα, IL-6, and IL-10 mRNA levels in BV-2, EV and A+ cells in the presence of LPS
Basal mRNA levels for TNFα were similar in the BV-2 and EV cells and slightly lower in the A+ cells. LPS induced similar elevations in TNFα mRNA levels in the BV-2 and EV cells while, in the A+ cells a decrease was observed (Fig. 5A). IL-6 mRNA levels showed a similar pattern with basal and LPS-induced levels similar for the BV-2 and EV cells. Basal levels were similar in the A+ cells and no changes were observed with LPS (Fig. 5B). For the anti-inflammatory cytokine, IL-10, basal levels were very low in the BV-2 cells and failed to show an induction by LPS (Fig. 5C). EV cells showed a basal level of mRNA expression for IL-10 that was decreased following LPS exposure. With an overexpression of ATX in the A+ cells, the basal mRNA level for IL-10 was significantly higher than that observed in the other two cell lines and significantly decreased by LPS (Fig. 5C).
Figure 5. Cytokines mRNA expression in presence of LPS.

BV-2 cell, empty vector (EV) or autotaxin (A+) transfected cells were incubated for 4 hr in the absence or presence of LPS (1 µg/mL). mRNA encoding TNFα (A), IL-6 (B) and IL-10 (C), were quantified by RT PCR as described in the Materials and Methods. Results are the mean ± SD of three independent experiments. *** p<0.001, LPS treated values significantly different from control values (BV2, EV, A+), ### p<0.001, Overexpressing ATX (A+) values significantly different from EV values, as determined by Tukey’s post hoc analysis following a significant overall two way ANOVA (n=3).
TNFα, IL-6, and IL-10 protein in BV-2, EV and A+ cells in the presence of LPS
Basal protein levels for TNFα, IL-6, and IL-10 were similar in the BV-2 and EV cells (Fig. 6A–C). In the A+ cells, a slightly lower basal level of TNF protein was detected; however, this failed to reach statistical significance (Fig. 6A). For IL-6, the lower protein level in the A+ cells was significantly lower than the other two cell lines (Fig. 6B) and for the anti-inflammatory cytokine, IL-10 the basal levels were significantly higher (Fig. 6C). Following LPS, TNFα protein levels were increased in the BV-2 and EV cells but were slightly decreased in the A+ cells (Fig. 6A). IL-6 was elevated in the BV-2 cells by LPS but was not elevated in the EV cells. For the A+ cells the relative increase in IL-6 following LPS was similar to that seen in the BV-2 cells however, the absolute protein level was substantially less (Fig. 6C). In all cell lines, the protein levels for IL-10 were significantly lower following LPS as compared to vehicle controls. For the anti-inflammatory cytokine IL-10, all three of the cell lines demonstrated a lower protein level following LPS. In the A+ cells, basal levels of IL-10 were significantly higher than those observed in either the BV-2 or EV cells and while the proportional decrease of approximately 50% following LPS was similar, there remained a significantly higher level of IL-10 protein (Fig. 6C).
Figure 6. Cytokines proteins production in presence of LPS.

BV-2, empty vector (EV) or autotaxin (A+) transfected cells were incubated for 4 hours in the absence or presence of LPS (1 µg/mL). TNFα (A), IL-6 (B) and IL-10 (C) protein levels were determined by ELISA. Results are the mean ± SD from experiments performed in triplicate. * p<0.05, ** p<0.01, *** p<0.001, LPS treated values significantly different from control values (BV2, EV, A+), ### p<0.001, Overexpressing ATX (A+) values significantly different from EV values as determined by by Tukey’s post hoc analysis following a significant overall two way ANOVA (n=3).
CD11b, CD14, CD80, and CD86 mRNA levels in the presence of LPS
Stimulation of microglia was estimated by measuring mRNA levels of different CDs. Basal levels for CD11b, CD14, CD80, and CD86 were significantly lower in the A+ cells as compared to BV-2 cells (Fig. 7A–D). Upon stimulation with LPS, CD11b was found to be significantly elevated in the BV-2 cells with no concurrent significant elevation in CD14, CD80, or CD86 (Fig. 7A and 7D). A+ cells displayed no evidence of stimulation by LPS on the expression levels for CD11b, CD14, CD80, or CD86 (Fig. 7A–F).
Figure 7. Autotaxin and microglial membrane proteins expression.
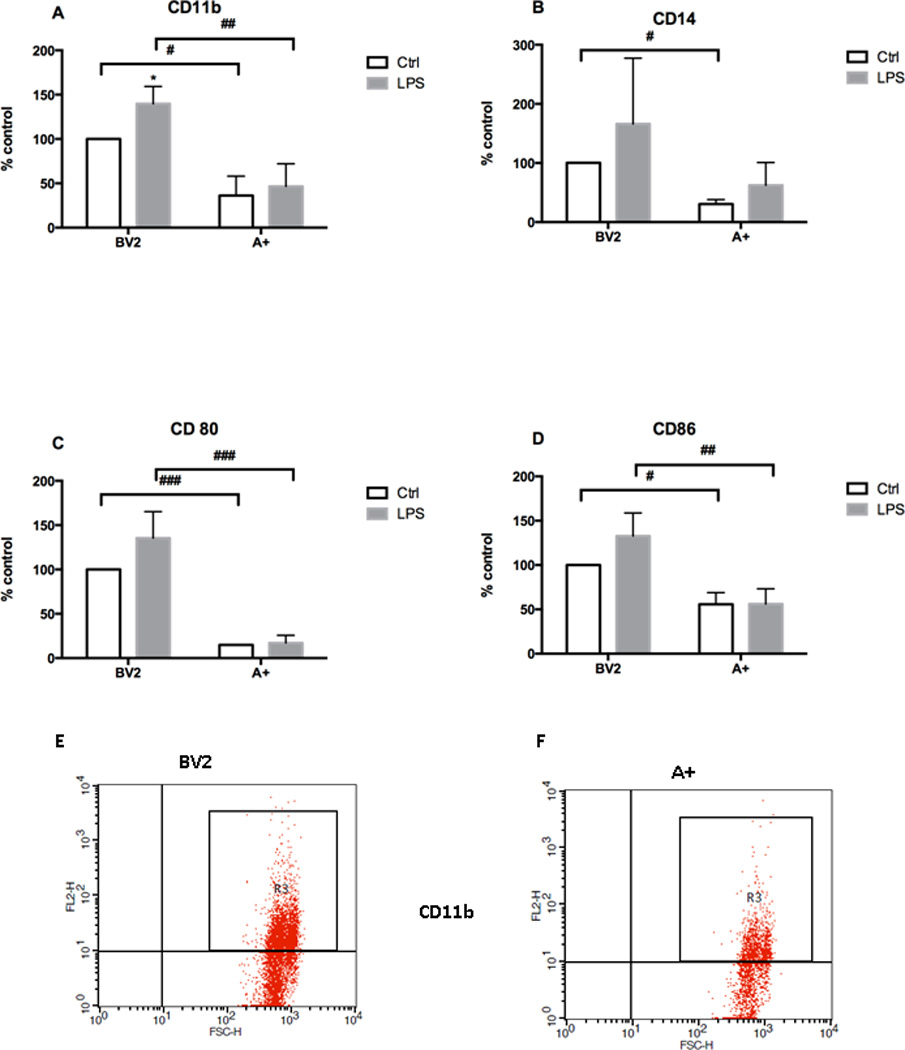
Non-transfected cells (NT) or autotaxin (A+) transfected cells were incubated for 24 hours in the presence or absence of LPS. (A) CD11b, (B) CD14, (C) CD80 and (D) expression were evaluated by FACS. Results are the mean ± SD from 3 independent experiments conducted in triplicate, *p<0.05 LPS treated significantly different from respective control values. # p<0.05, ## p<0.01, ### p<0.001, Overexpressing A+ significantly different from BV-2 values, as determined by Tukey’s post-hoc analysis following a significant overall two way ANOVA (n=3). Representative FCAS scatter plot for CD11b, (E) BV-2 non-transfected cells and (F). A+ cells in presence of LPS (1 µg/mL)
NF-kB and AP-1 activation in the presence of LPA or conditioned media from A+ cells
In RAW-Blue™ cells, LPS significantly induced NF-kB activation in (Fig. 8). A similar level of activation over controls was observed in cells co-exposed to LPS (1 µg/ml) and conditioned medium (CM) from normal BV2 cells. Co-exposure of LPA (1 µM) with LPS resulted in an approximate 30% inhibition of NF-kB activation. A similar reduction was seen with the co-administration of CM from A+ cells. This combined exposure resulted in an approximate 50% inhibition of LPS-induced NF-kB activation
Figure 8. NF-kB activation.

Non-transfected cells (NT) or autotaxin (A+) transfected cells were incubated for 24 hours with or without LPS (1 µg/mL). The supernatant (conditioned medium (CM)) from the different cell cultures were then added to RAW-Blue cell. NF-kB activity is determined as described in material and methods. Results are the mean ± SD from 3 independent experiments performed in triplicate. *** p<0.001, significantly different from LPS values, as determined by Dunnett’s t-test posthoc analysis following a significant overall ANOVA (n=3).
DISCUSSION
Activation of microglia and increase in inflammatory factors are physiological responses to various injuries or diseases, including infection, which are necessary processes to restore homeostasis. In addition to removal of cellular debris or aberrant proteins, microglia cells are also involved in the reparation process. However, extended microglial activation and excessive pro-inflammatory response may be detrimental to cells within the environment and for that reason, their activation/deactivation is closely regulated under normal conditions. In the process of regulation, it has been proposed that the pro-inflammatory M1 phenotype of microglia can be down-regulated by a concurrent or subsequent microglia polarization to the anti-inflammatory/repair M2 phenotype. The induction of an M2 phenotype has been proposed for promotion of tissue regeneration or regulation of the inflammatory response and repair [Aguzzi et al., 2013; Chawla et al., 2011]. In the current study, we demonstrate a potential role for ATX in regulating a pro-inflammatory response and activation of BV-2 microglia cells. The concomitant elevation of the anti-inflammatory protein, IL-10, suggests a role in regulating this inhibition. The induction of ATX production and activity by LPS and the inhibition of an LPS response in ATX overexpressing cells suggest an active role for ATX in the down regulation of an acute inflammatory response.
Autotaxin, through its phospholipase D activity, constitutes the main source of LPA, by catalyzing the conversion of lysophosphatidylcholine (LPC) into LPA [Tokumura et al., 2002; Umezu-Goto et al., 2002]. LPA binding to its receptors leads to several different physiological activities including angiogenesis, adipocytes differentiation, and myelination [Ferry et al., 2003; Fox et al., 2003; van Meeteren et al., 2006]. However, the role of ATX in inflammation remains controversial. Elevations in ATX and/or LPA receptors have been reported in inflammatory conditions, including human rheumatoid arthritis (RA) [Nochi et al., 2008], multiple sclerosis [Hammack et al., 2004], and mammary gland inflammatory diseases [Liu et al., 2009a; Liu et al., 2009b]. Yet, LPA inhibition of LPS-induced inflammation in macrophages and in mice suggests anti-inflammatory properties [Fan et al., 2008]. Here we show, for the first time, that stimulation of microglia by LPS induces an increase in ATX mRNA levels and LPA production. A similar increase of ATX in response to LPS has been described in the human monocytic cell line, THP-1 involving PKR, JNK, and p38 MAPK-mediated mechanisms [Li et al., 2012; Li and Zhang, 2009]. In the current study, the partial inhibition of NF-kB by conditioned medium from the clone overexpressing ATX suggesting that ATX/LPA affects multiple pathways including NF-κB.
While not examined in the current study, the various transcription pathways induced in monocytes for the production of ATX in the presence of LPS are likely to be similar in microglia [Li et al., 2012; Li and Zhang, 2009]. Microglia, as well as, monocytes / macrophages express TLR4 and CD14, the receptor and co-receptor for LPS recognition. These receptors are involved in the innate immunity functions of microglia and binding of the receptor by LPS induces a pro-inflammatory cytokine response. Based on our findings, the decrease in CD14 expression seen with ATX suggests a role for ATX in down-regulating the LPS response through inhibition of co-receptor expression.
To date, a total of 5 LPA receptors belonging to the family of G-protein-coupled receptors have been described. Each of the LPA receptors is encoded by a different gene (lpA1/Edg2, lpA2/Edg4, lpA3/Edg7, lpA4/P2Y9/GPR23, lpA5/GPR92) and difference in the LPA receptor type has been reported depending of the species [Meyer zu Heringdorf and Jakobs, 2007; Moller et al., 2001]. In cultured rat microglia cells, the main microglia LPA receptor is LPA3 while in mouse LPA1 serves as the primary receptor [Moller et al., 2001]. Our results are consistent with the expression of LPA1 in mouse BV-2 microglia as previously demonstrated [Moller et al., 2001], and suggest that ATX increase leads to an increase of LPA that could bind to the microglia LPA1 and activates the corresponding signaling pathway. The basal expression level of LPA1 is significantly higher in microglia overexpressing ATX as well as the level of induction by LPS.
Microglia can be stimulated to an M1 phenotype in different environments including inflammation and oxidative stress [Vijitruth et al., 2006]. Recently, we have shown that ATX mRNA levels are elevated in microglia upon oxidative stress, suggesting an up-regulation under such environmental conditions [Awada et al., 2012]. Over expression of ATX in microglia improves their resistance to hydrogen peroxide, decreases intracellular reactive oxygen species and increases enzyme involved in the detoxification such as catalase demonstrating that ATX have a protective role in oxidative stress [Awada et al., 2012]. A role for ATX in the regulation of the acute inflammatory response has been previously proposed [Li et al., 2012; Li and Zhang, 2009]. In vivo studies reported a significant decrease in LPS-induced plasma TNFα levels in mice pre-treated with LPA while IL-6 was not changed [Fan et al., 2008]. A similar finding has been reported for cultured peritoneal macrophages with a decreased production of TNFα protein and no change in IL-6 following LPS in the presence LPA [Fan et al., 2008]. Our results demonstrate the ability of ATX to minimize LPS induced activation of microglia and the release of pro-inflammatory cytokines including TNFα and IL-6. In autotaxin overexpressing cells (A+), the basal level of TNFα mRNA was lower and LPS did not induce an elevation of TNFα. The differences between our findings and those of Fan et al [2008] in the effect on IL-6 could be due to a continuous production of LPA via overexpression of ATX in our study as compared to the previous study’s use of an acute LPA treatment. The observed elevation in IL-10 in cells over-expressing ATX suggests that the inhibition of TNFα following LPS is related to the higher basal level of the anti-inflammatory cytokine IL-10 and a potential polarization of cells to the M2 state.
Microglia in various phenotypic stages express integrin alpha M (CD11b) with elevations observed in activated microglia [Ladeby et al., 2005]. A study from Ma and co-workers examining spinal cord microglia in vivo suggested that LPA induced microglia activation and increased CD11b [Ma et al., 2010]. Under these in vivo conditions it is likely that the response to LPA observed in microglia reflected the diverse cell population and potential mediation of the response. Using defined microglia culture systems, we found that ATX overexpression decreased BV-2 activation and that LPA inhibited TNFα expression and production in LPS stimulated primary microglia. CD14 and TLRs are also involved in the activation of the microglia as antigen-presenting cell (APC) [Olson and Miller, 2004] and we found a similar expression pattern for CD14 as was observed for CD11b. Interestingly, we found that the expression of the co-stimulatory molecules B7.1 and B7.2 were lowered in the A+ clone, indicating that not only was the innate immunity of microglia down-regulated but also their adaptive immune functions.
The association between ATX and cancer, as well as, inflammation-associated pathologies has lead to the development of ATX inhibitors in the perspective of therapeutic strategies [Federico et al., 2008; Gierse et al., 2010]. However, in contrast, our results on microglia and those by Fan et al. [2008] on macrophages suggest a beneficial role of ATX in CNS injury by protecting the microglia cells and down-regulating their activation. These potential beneficial actions may open new therapeutic perspectives for ATX or LPA.
Acknowledgements
This work was supported by the Intramural Research Program of NIEHS/NIH and by grants from ‘Conseil Régional de La Réunion’, Europe (CPER/FEDER) and ‘Ministère de L’enseignement Supérieur et de la Recherche’. RA was a recipient of fellowships for both teaching and research activities from the Ministère de l’Education Nationale, de l’Enseignement Supérieur et de la Recherche. AP is a recipient of fellowship from Conseil Régional de La Réunion. SG and JSSB were supported by INSERM (France), and by the Fondation de la Recherche Médicale (France) (grant #LRM20100618582). We would like to thanks Janine Santos and Shih-Heng (David) Chen for their reading and input in the manuscript.
LIST OF ABBREVIATIONS
- ANOVA
analysis of variance
- ATX
autotaxin
- CM
conditioned medium
- CNS
central nervous system
- GAPDH
glyceraldehyde-3-phosphate dehydrogenase
- IL
Interleukin
- LPA
lysophosphatidic acid
- LPA1
LPA receptor 1
- LPC
lysophosphatidylcholine
- LPS
lipopolysaccharide
- MHC
major histocompatibility complex
- SEAP
secreted embryonic alkaline phosphatase
- TLR
toll like receptor
- TNF
Tumor necrosis factor
Contributor Information
Rana Awada, Email: rawada@univ-reunion.fr.
Jean Sébastien Saulnier-Blache, Email: jean-sebastien.saulnier-blache@inserm.fr.
Sandra Grès, Email: sandra.gres@inserm.fr.
Emmanuel Bourdon, Email: Emmanuel.bourdon@univ-reunion.fr.
Philippe Rondeau, Email: Philippe.rondeau@univ-reunion.fr.
Avinash Parimisetty, Email: Avinash.parimisetty@univ-reunion.fr.
Ruben Orihuela, Email: orihuelarg@nih.gov.
G. Jean Harry, Email: harry@niehs.nih.gov.
Christian Lefebvre d’Hellencourt, Email: Christian.Lefebvre-d-Hellencourt@univ-reunion.fr.
References
- Aguzzi A, Barres BA, Bennett ML. Microglia: scapegoat, saboteur, or something else? Science. 2013;339:156–161. doi: 10.1126/science.1227901. [DOI] [PMC free article] [PubMed] [Google Scholar]
- Aloisi F, De Simone R, Columba-Cabezas S, Levi G. Opposite effects of interferon-gamma and prostaglandin E2 on tumor necrosis factor and interleukin-10 production in microglia: a regulatory loop controlling microglia pro- and anti-inflammatory activities. J Neurosci Res. 1999;56:571–580. doi: 10.1002/(SICI)1097-4547(19990615)56:6<571::AID-JNR3>3.0.CO;2-P. [DOI] [PubMed] [Google Scholar]
- Awada R, Rondeau P, Gres S, Saulnier-Blache JS, Lefebvre d'Hellencourt C, Bourdon E. Autotaxin protects microglial cells against oxidative stress. Free Radic Biol Med. 2012;52:516–526. doi: 10.1016/j.freeradbiomed.2011.11.014. [DOI] [PubMed] [Google Scholar]
- Boche D, Perry VH, Nicoll JA. Review: activation patterns of microglia and their identification in the human brain. Neuropathol Appl Neurobiol. 2013;39:3–18. doi: 10.1111/nan.12011. [DOI] [PubMed] [Google Scholar]
- Bruce AJ, Boling W, Kindy MS, Peschon J, Kraemer PJ, Carpenter MK, Holtsberg FW, Mattson MP. Altered neuronal and microglial responses to excitotoxic and ischemic brain injury in mice lacking TNF receptors. Nat Med. 1996;2:788–794. doi: 10.1038/nm0796-788. [DOI] [PubMed] [Google Scholar]
- Cacci E, Claasen JH, Kokaia Z. Microglia-derived tumor necrosis factor-alpha exaggerates death of newborn hippocampal progenitor cells in vitro. J Neurosci Res. 2005;80:789–797. doi: 10.1002/jnr.20531. [DOI] [PubMed] [Google Scholar]
- Chawla A, Nguyen KD, Goh YP. Macrophage-mediated inflammation in metabolic disease. Nat Rev Immunol. 2011;11:738–749. doi: 10.1038/nri3071. [DOI] [PMC free article] [PubMed] [Google Scholar]
- Czlonkowska A, Kurkowska-Jastrzebska I. Inflammation and gliosis in neurological diseases--clinical implications. J Neuroimmunol. 2011;231:78–85. doi: 10.1016/j.jneuroim.2010.09.020. [DOI] [PubMed] [Google Scholar]
- Fan H, Zingarelli B, Harris V, Tempel GE, Halushka PV, Cook JA. Lysophosphatidic acid inhibits bacterial endotoxin-induced pro-inflammatory response: potential anti-inflammatory signaling pathways. Mol Med. 2008;14:422–428. doi: 10.2119/2007-00106.Fan. [DOI] [PMC free article] [PubMed] [Google Scholar]
- Federico L, Pamuklar Z, Smyth SS, Morris AJ. Therapeutic potential of autotaxin/lysophospholipase d inhibitors. Curr Drug Targets. 2008;9:698–708. doi: 10.2174/138945008785132439. [DOI] [PMC free article] [PubMed] [Google Scholar]
- Ferry G, Tellier E, Try A, Gres S, Naime I, Simon MF, Rodriguez M, Boucher J, Tack I, Gesta S, Chomarat P, Dieu M, Raes M, Galizzi JP, Valet P, Boutin JA, Saulnier-Blache JS. Autotaxin is released from adipocytes, catalyzes lysophosphatidic acid synthesis, and activates preadipocyte proliferation. Up-regulated expression with adipocyte differentiation and obesity. J Biol Chem. 2003;278:18162–18169. doi: 10.1074/jbc.M301158200. [DOI] [PMC free article] [PubMed] [Google Scholar]
- Fox MA, Colello RJ, Macklin WB, Fuss B. Phosphodiesterase-Ialpha/autotaxin: a counteradhesive protein expressed by oligodendrocytes during onset of myelination. Mol Cell Neurosci. 2003;23:507–519. doi: 10.1016/s1044-7431(03)00073-3. [DOI] [PubMed] [Google Scholar]
- Gierse J, Thorarensen A, Beltey K, Bradshaw-Pierce E, Cortes-Burgos L, Hall T, Johnston A, Murphy M, Nemirovskiy O, Ogawa S, Pegg L, Pelc M, Prinsen M, Schnute M, Wendling J, Wene S, Weinberg R, Wittwer A, Zweifel B, Masferrer J. A novel autotaxin inhibitor reduces lysophosphatidic acid levels in plasma and the site of inflammation. J Pharmacol Exp Ther. 2010;334:310–317. doi: 10.1124/jpet.110.165845. [DOI] [PubMed] [Google Scholar]
- Hammack BN, Fung KY, Hunsucker SW, Duncan MW, Burgoon MP, Owens GP, Gilden DH. Proteomic analysis of multiple sclerosis cerebrospinal fluid. Mult Scler. 2004;10:245–260. doi: 10.1191/1352458504ms1023oa. [DOI] [PubMed] [Google Scholar]
- Harry GJ, Tyler K, d'Hellencourt CL, Tilson HA, Maier WE. Morphological alterations and elevations in tumor necrosis factor-alpha, interleukin (IL)-1alpha, and IL-6 in mixed glia cultures following exposure to trimethyltin: modulation by proinflammatory cytokine recombinant proteins and neutralizing antibodies. Toxicol Appl Pharmacol. 2002;180:205–218. doi: 10.1006/taap.2002.9390. [DOI] [PubMed] [Google Scholar]
- Hoo RL, Wong JY, Qiao C, Xu A, Xu H, Lam KS. The effective fraction isolated from Radix Astragali alleviates glucose intolerance, insulin resistance and hypertriglyceridemia in db/db diabetic mice through its anti-inflammatory activity. Nutr Metab (Lond) 7:67. doi: 10.1186/1743-7075-7-67. [DOI] [PMC free article] [PubMed] [Google Scholar]
- Ishii I, Fukushima N, Ye X, Chun J. Lysophospholipid receptors: signaling and biology. Annu Rev Biochem. 2004;73:321–354. doi: 10.1146/annurev.biochem.73.011303.073731. [DOI] [PubMed] [Google Scholar]
- Ladeby R, Wirenfeldt M, Garcia-Ovejero D, Fenger C, Dissing-Olesen L, Dalmau I, Finsen B. Microglial cell population dynamics in the injured adult central nervous system. Brain Res Brain Res Rev. 2005;48:196–206. doi: 10.1016/j.brainresrev.2004.12.009. [DOI] [PubMed] [Google Scholar]
- Li S, Xiong C, Zhang J. ATX and LPA receptor 3 are coordinately up-regulated in lipopolysaccharide-stimulated THP-1 cells through PKR and SPK1-mediated pathways. FEBS Lett. 2012;586:792–797. doi: 10.1016/j.febslet.2012.01.044. [DOI] [PubMed] [Google Scholar]
- Li S, Zhang J. Lipopolysaccharide induces autotaxin expression in human monocytic THP-1 cells. Biochem Biophys Res Commun. 2009;378:264–268. doi: 10.1016/j.bbrc.2008.11.047. [DOI] [PubMed] [Google Scholar]
- Liu S, Murph M, Panupinthu N, Mills GB. ATX-LPA receptor axis in inflammation and cancer. Cell Cycle. 2009a;8:3695–3701. doi: 10.4161/cc.8.22.9937. [DOI] [PMC free article] [PubMed] [Google Scholar]
- Liu S, Umezu-Goto M, Murph M, Lu Y, Liu W, Zhang F, Yu S, Stephens LC, Cui X, Murrow G, Coombes K, Muller W, Hung MC, Perou CM, Lee AV, Fang X, Mills GB. Expression of autotaxin and lysophosphatidic acid receptors increases mammary tumorigenesis, invasion, and metastases. Cancer Cell. 2009b;15:539–550. doi: 10.1016/j.ccr.2009.03.027. [DOI] [PMC free article] [PubMed] [Google Scholar]
- Ma L, Nagai J, Ueda H. Microglial activation mediates de novo lysophosphatidic acid production in a model of neuropathic pain. J Neurochem. 2010;115:643–653. doi: 10.1111/j.1471-4159.2010.06955.x. [DOI] [PubMed] [Google Scholar]
- Mack CL, Vanderlugt-Castaneda CL, Neville KL, Miller SD. Microglia are activated to become competent antigen presenting and effector cells in the inflammatory environment of the Theiler's virus model of multiple sclerosis. J Neuroimmunol. 2003;144:68–79. doi: 10.1016/j.jneuroim.2003.08.032. [DOI] [PubMed] [Google Scholar]
- Meyer zu Heringdorf D, Jakobs KH. Lysophospholipid receptors: signalling, pharmacology and regulation by lysophospholipid metabolism. Biochim Biophys Acta. 2007;1768:923–940. doi: 10.1016/j.bbamem.2006.09.026. [DOI] [PubMed] [Google Scholar]
- Moller T, Contos JJ, Musante DB, Chun J, Ransom BR. Expression and function of lysophosphatidic acid receptors in cultured rodent microglial cells. J Biol Chem. 2001;276:25946–25952. doi: 10.1074/jbc.M102691200. [DOI] [PubMed] [Google Scholar]
- Munoz-Fernandez MA, Fresno M. The role of tumour necrosis factor, interleukin 6, interferon-gamma and inducible nitric oxide synthase in the development and pathology of the nervous system. Prog Neurobiol. 1998;56:307–340. doi: 10.1016/s0301-0082(98)00045-8. [DOI] [PubMed] [Google Scholar]
- Nakanaga K, Hama K, Aoki J. Autotaxin--an LPA producing enzyme with diverse functions. J Biochem. 2010;148:13–24. doi: 10.1093/jb/mvq052. [DOI] [PubMed] [Google Scholar]
- Nochi H, Tomura H, Tobo M, Tanaka N, Sato K, Shinozaki T, Kobayashi T, Takagishi K, Ohta H, Okajima F, Tamoto K. Stimulatory role of lysophosphatidic acid in cyclooxygenase-2 induction by synovial fluid of patients with rheumatoid arthritis in fibroblast-like synovial cells. J Immunol. 2008;181:5111–5119. doi: 10.4049/jimmunol.181.7.5111. [DOI] [PubMed] [Google Scholar]
- Ohuchi H, Hamada A, Matsuda H, Takagi A, Tanaka M, Aoki J, Arai H, Noji S. Expression patterns of the lysophospholipid receptor genes during mouse early development. Dev Dyn. 2008;237:3280–3294. doi: 10.1002/dvdy.21736. [DOI] [PubMed] [Google Scholar]
- Okudaira S, Yukiura H, Aoki J. Biological roles of lysophosphatidic acid signaling through its production by autotaxin. Biochimie. 92:698–706. doi: 10.1016/j.biochi.2010.04.015. [DOI] [PubMed] [Google Scholar]
- Olson JK, Miller SD. Microglia initiate central nervous system innate and adaptive immune responses through multiple TLRs. J Immunol. 2004;173:3916–3924. doi: 10.4049/jimmunol.173.6.3916. [DOI] [PubMed] [Google Scholar]
- Ponomarev ED, Novikova M, Maresz K, Shriver LP, Dittel BN. Development of a culture system that supports adult microglial cell proliferation and maintenance in the resting state. J Immunol Methods. 2005;300:32–46. doi: 10.1016/j.jim.2005.02.011. [DOI] [PubMed] [Google Scholar]
- Ponomarev ED, Shriver LP, Dittel BN. CD40 expression by microglial cells is required for their completion of a two-step activation process during central nervous system autoimmune inflammation. J Immunol. 2006;176:1402–1410. doi: 10.4049/jimmunol.176.3.1402. [DOI] [PubMed] [Google Scholar]
- Rock RB, Gekker G, Hu S, Sheng WS, Cheeran M, Lokensgard JR, Peterson PK. Role of microglia in central nervous system infections. Clin Microbiol Rev. 2004;17:942–964. doi: 10.1128/CMR.17.4.942-964.2004. table of contents. [DOI] [PMC free article] [PubMed] [Google Scholar]
- Saulnier-Blache JS, Girard A, Simon MF, Lafontan M, Valet P. A simple and highly sensitive radioenzymatic assay for lysophosphatidic acid quantification. J Lipid Res. 2000;41:1947–1951. [PMC free article] [PubMed] [Google Scholar]
- Savaskan NE, Rocha L, Kotter MR, Baer A, Lubec G, van Meeteren LA, Kishi Y, Aoki J, Moolenaar WH, Nitsch R, Brauer AU. Autotaxin (NPP-2) in the brain: cell type-specific expression and regulation during development and after neurotrauma. Cell Mol Life Sci. 2007;64:230–243. doi: 10.1007/s00018-006-6412-0. [DOI] [PMC free article] [PubMed] [Google Scholar]
- Smith PK, Krohn RI, Hermanson GT, Mallia AK, Gartner FH, Provenzano MD, Fujimoto EK, Goeke NM, Olson BJ, Klenk DC. Measurement of protein using bicinchoninic acid. Anal Biochem. 1985;150:76–85. doi: 10.1016/0003-2697(85)90442-7. [DOI] [PubMed] [Google Scholar]
- Stracke ML, Krutzsch HC, Unsworth EJ, Arestad A, Cioce V, Schiffmann E, Liotta LA. Identification, purification, and partial sequence analysis of autotaxin, a novel motility-stimulating protein. J Biol Chem. 1992;267:2524–2529. [PubMed] [Google Scholar]
- Taylor RA, Sansing LH. Microglial Responses after Ischemic Stroke and Intracerebral Hemorrhage. Clin Dev Immunol. 2013;2013:746068. doi: 10.1155/2013/746068. [DOI] [PMC free article] [PubMed] [Google Scholar]
- Tokumura A, Majima E, Kariya Y, Tominaga K, Kogure K, Yasuda K, Fukuzawa K. Identification of human plasma lysophospholipase D, a lysophosphatidic acid-producing enzyme, as autotaxin, a multifunctional phosphodiesterase. J Biol Chem. 2002;277:39436–39442. doi: 10.1074/jbc.M205623200. [DOI] [PubMed] [Google Scholar]
- Umezu-Goto M, Kishi Y, Taira A, Hama K, Dohmae N, Takio K, Yamori T, Mills GB, Inoue K, Aoki J, Arai H. Autotaxin has lysophospholipase D activity leading to tumor cell growth and motility by lysophosphatidic acid production. J Cell Biol. 2002;158:227–233. doi: 10.1083/jcb.200204026. [DOI] [PMC free article] [PubMed] [Google Scholar]
- van Meeteren LA, Moolenaar WH. Regulation and biological activities of the autotaxin-LPA axis. Prog Lipid Res. 2007;46:145–160. doi: 10.1016/j.plipres.2007.02.001. [DOI] [PubMed] [Google Scholar]
- van Meeteren LA, Ruurs P, Stortelers C, Bouwman P, van Rooijen MA, Pradere JP, Pettit TR, Wakelam MJ, Saulnier-Blache JS, Mummery CL, Moolenaar WH, Jonkers J. Autotaxin, a secreted lysophospholipase D, is essential for blood vessel formation during development. Mol Cell Biol. 2006;26:5015–5022. doi: 10.1128/MCB.02419-05. [DOI] [PMC free article] [PubMed] [Google Scholar]
- Vijitruth R, Liu M, Choi DY, Nguyen XV, Hunter RL, Bing G. Cyclooxygenase-2 mediates microglial activation and secondary dopaminergic cell death in the mouse MPTP model of Parkinson's disease. J Neuroinflammation. 2006;3:6. doi: 10.1186/1742-2094-3-6. [DOI] [PMC free article] [PubMed] [Google Scholar]
- Yuelling LM, Fuss B. Autotaxin (ATX): a multi-functional and multi-modular protein possessing enzymatic lysoPLD activity and matricellular properties. Biochim Biophys Acta. 2008;1781:525–530. doi: 10.1016/j.bbalip.2008.04.009. [DOI] [PMC free article] [PubMed] [Google Scholar]
- Zhao Y, Natarajan V. Lysophosphatidic acid (LPA) and its receptors: Role in airway inflammation and remodeling. Biochim Biophys Acta. 1831;1831:86–92. doi: 10.1016/j.bbalip.2012.06.014. [DOI] [PMC free article] [PubMed] [Google Scholar]