

Abstract
Purpose
To demonstrate the feasibility of using a variable flip angle 3D fast spin-echo (3D VFA-FSE) sequence combined with outer volume suppression for imaging of trabecular bone structure at the proximal femur in vivo at 3T.
Materials and Methods
The 3D VFA-FSE acquisition was optimized to minimize blurring and to provide high signal-to-noise ratio (SNR) from bone marrow. Outer volume suppression was achieved by applying three quadratic-phase radio-frequency pulses. The SNR and trabecular bone structures from 3D VFA-FSE was compared with those from previously demonstrated multiple-acquisition 3D balanced steady-state free precision (bSSFP) using theoretical simulations, ex vivo experiments, and in vivo experiments.
Results
Our simulation demonstrated that 3D VFA-FSE can provide at least 35% higher SNR than 3D bSSFP, which was confirmed by the ex vivo and in vivo experiments. The ex vivo experiments demonstrated a good correlation and agreement between bone structural paramters obtained with the two sequences. The proposed sequence depicted trabecular bone structure at the proxiaml femur in vivo well without visible suppression artifacts and provided a mean SNR of 11.0.
Conclusion
The reduced-FOV 3D VFA-FSE sequence can depict the trabecular bone structure of the proximal femur in vivo with minimal blurring and high SNR efficiency.
Keywords: Trabecular Bone Structure, 3D Fast Spin Echo, Variable Flip Angle, Proximal Femur, Outer Volume Suppression
Introduction
Osteoporosis is a skeletal disease characterized by low bone mass and microarchitectural deterioration of bone tissue, leading to an increased risk of fracture (1). In particular, osteoporotic hip fractures are the most devastating, causing serious disability and excessive mortality (2). Conventionally, the skeletal status in osteoporosis has been assessed by measuring bone mineral density using dual X-ray absorptiometry (DXA); however, it has been recognized that trabecular bone structure might be a more important factor for bone strength rather than bone mineral density (3). Normal trabecular elements are 80 – 200 μm thick having 400 – 700 μm spacing between them; the structure further deteriorates with age and osteoporosis (4). Thus very high spatial resolution is necessary to assess trabecular bone structure.
MRI has evolved over the past decades as a non-invasive technique that can depict trabecular bone microstructure. The use of zero echo time imaging for direct depiction of trabecular bone, of which T2* relaxation time is on the order of a few hundred microseconds, has been demonstrated in vitro (5). However, general methods usually use negative-contrast approaches, exploiting bright signal from surrounding bone marrow to depict microstructure of trabecular bone having no signal. Currently, the spatial resolution achieved for in vivo MRI can be up to 100 – 200 μm in-plane resolution and 300 – 500 μm slice thickness at the peripheral skeletal sites such as the wrist and ankle. Although partial volume effects can occur with this spatial resolution, the relatively large trabecular spacing compared to the trabecular thickness makes it possible to resolve trabecular elements. Previous work has demonstrated that the structural measurement from MR images is significantly correlated with the true structure (6, 7) and can be used to differentiate between subjects with and without osteoporotic fractures (8, 9).
In order to achieve high spatial resolution to resolve trabecular elements, it is critical to use a pulse sequence that provides high signal-to-noise ratio (SNR) efficiency from bone marrow. Traditionally, both 3D gradient-echo type sequences and 3D spin-echo type sequences have been used due to their respective advantages (10, 11). Gradient-echo type sequences are sensitive to off-resonance effects caused by susceptibility differences between bone and bone marrow, and significant signal loss can arise from spectrally heterogenous bone marrow regions. However, they have been frequently used for trabecular bone imaging because of their faster scan due to a shorter repetition time (TR). Recently, multiple-acquisition 3D balanced steady-state free precession (bSSFP) (12) with two phase-cycling angles has been employed for trabecular bone imaging and its feasibility to delineate trabecular structure has been demonstrated in various skeletal sites including the proximal femur (13, 14). In contrast, spin-echo type sequences are less sensitive to off-resonance effects and can provide a more accurate depiction of the trabecular thickness. A 3D fast large-angle spin-echo (FLASE) sequence was developed as a rapid, SNR-efficient, spin-echo sequence tailored to trabecular bone imaging (15). It uses a large excitation flip angle (over 90°) in order to maximize signal recovery during TR on the order of 80 ms. However, 3D FLASE has been of limited use at deeply-located sites such as the proximal femur and vertebral body because its relatively long TR and a large FOV can result in a long scan time. A 3D fast spin-echo (FSE) sequence is generally a time-efficient spin-echo type sequence, but its T2 blurring can be of concern (16). Lately, Magland et al. (17) used a 3D FSE sequence to depict trabecular bone structure at the distal tibia by correcting echo modulation through calibration and demonstrated that their 3D FSE approach can provide comparable delineation of bone structure and SNR efficiency to 3D FLASE while reducing the specific absorption rate.
In this work, we designed a 3D FSE sequence for trabecular bone imaging of the proximal femur in a clinically feasible scan time and investigated the performace in comparison to a previously used bSSFP sequence. For 3D FSE, a variable flip angle (VFA) scheme was incorporated to reduce blurring (18, 19), and outer volume suppression was combined to limit the phase-encode field of view (FOV) (20, 21). The presence of red, hematopoietic marrow (fat: 40%, water: 40%, protein: 20%) as well as yellow marrow (fat: 80%, water: 15%, protein: 5%) at the proximal femur (22, 23) was considered to optimize the sequence in terms of increasing SNR and reducing blurring. An ex vivo study was performed to compare SNR and trabecular bone structure quantification between 3D VFA-FSE and 3D bSSFP, and an in vivo study was conducted to demonstrate the feasibility of depicting in vivo trabecular bone structure with the proposed sequence.
Materials and Methods
Imaging Pulse Sequence
The reduced-FOV 3D VFA-FSE squence (Figure 1) was implemented on a GE discovery MR750 3T scanner (GE Healthcare, Waukesha, WI) equipped with gradient systems having a maximum strength of 50 mT/m and a maximum slew rate of 200 mT/m/ms. A 90° excitation pulse used a Shinnar-Le Roux linear-phase pulse with a 2.6 ms duration and time-bandwidth product of 6 and provided a slab selection along the z direction; a refocusing pulse, a 0.6 ms hard pulse, provided a broad spectral profile to refocus both fat and water components and to minimize the echo spacing. The number of echoes and the refocusing flip angles were determined to provide high SNR as well as to limit blurring. Centric view ordering was used without discarding initial echoes to maximize SNR, and only ten echoes were acquired in order to reduce blurring. After acquiring the ten echoes, an additional refocusing pulse and a -90° pulse were applied to flip remaining transverse magnetization back to the longitudinal axis in order to accelerate the relaxation of the longitudinal magnetization (24).
Figure 1.

3D VFA-FSE combined with outer volume suppression. Ten echoes were acquired with centric ordering, using refocusing flip angles optimized to reduce blurring from bone marrow. Phase-encode gradients along the z axis were combined with the crusher gradients. A fast recovery technique was incorporated to accelerate the recovery of the longitudinal magnetization. Outer volume suppression was performed by applying three quadratic-phase RF pulses and y spoiler gradients prior to FSE acquisition.
Crusher gradients surrounding the refocusing pulses eliminated the free induction decay signal from the imaging slab as well as the excited signal from outside the imaging slab generated by the nonselective refocusing pulses. Because large gradient areas can result in an increased echo spacing as well as signal decay due to diffusion effects (25), the gradient areas were determined carefully. The area of each crusher gradient along the z axis was set to provide one cycle of phase twist in each voxel. The crusher gradients along the x axis were bridged to the readout gradient at the start and the end, and the combination of one crusher gradient and half of the readout gradient provided 0.6 cycle of phase twist in each voxel.
The minimum echo spacing was 8.3 ms with a prescription of 512 readout points, ±62.5 kHz readout bandwidth, and 234 × 234 × 700 μm3 spatial resolution. The TR was set to 500 ms, which provided the highest SNR efficiency from bone marrow fat given using the proposed flip angle scheme (next subsection). The corners of ky – kz plane were not acquired (elliptical k-space coverage), requiring 21.5% fewer views than rectangular coverage. Skipping the corners of k-space does not reduce spatial resolution as far as additional zero filling reconstruction is not applied (26). For centric view ordering, the views were sorted to ten groups based on the distance to the k-space origin, and one view from each group was acquired for each echo train.
Outer volume suppression was achieved by playing three quadratic-phase radio-frequency (RF) pulses (27) on one saturation slab prior to acquisition. The quadratic-phase pulse can provide a wider bandwidth than the linear-phase pulse for a given peak RF amplitude limit. The three saturation pulses had flip angles of 90°, 90°, and 116°, and were applied at optimized time points for the suppression to be minimally sensitive to RF field (B1) inhomogeneities and T1 variations (21). The 90° pulse had a duration of 10 ms with a 8 kHz bandwidth and the 116° pulse had a duration of 12 ms with a 6.8 kHz bandwidth; both had a peak RF amplitude of 11 μT. The spoilers were played after each saturation pulse along the y axis in order to avoid unwanted echo generation due to the x and z crushers during FSE acquisition (20). The areas of the three y spoilers were geometrically increased, providing one, two, and four cycles of phase twist within a voxel, to avoid refocusing of dephased magnetization (28).
Variable Refocusing Flip Angle Design
Variable refocusing flip angles were designed in a scheme of decreasing the flip angles rapidly until a static pseudo steady state is established (29) and then gradually increasing the flip angles to counter relaxation effects (18, 19). In particular, they were determined by calculating the target signal from the prescribed first, minimum, and maximum flip angles and then using the prospective extended phase graph algorithm (19). The first and maximum flip angles were set to 120°, and the minimum flip angle was determined based on simulations by trading off an increase in spatial resolution and a decrease in Gibbs ringing artifacts. Figure 2a shows five different flip angle trains used in the simulations: a constant 120° flip angle train and variable flip angle trains determined by setting the minimum flip angles as 90°, 70°, 50°, and 30°.
Figure 2.

Variable flip angle optimization. (a) Constant 120° flip angles and variable flip angles of ten refocusing pulses determined by setting the first and maximum flip angles to 120° and the minimum flip angle to 90, 70, 50, and 30°. (b-c) Signal modulations over the echo trains using the flip angles depicted in (a) for bone marrow fat and bone marrow water, respectively. The signal profiles were normalized to the transverse magnetization induced by the 90° excitation pulse. Initial signal oscillation does not occur with the variable flip angle schemes. (d-e) The cross sections of the 2D PSFs due to signal modulations from bone marrow fat and water. A decrease in the minimum flip angle results in a decrease in the FWHM and an increase in the side lobe amplitudes. In our optimization, we chose the minimum flip angle as 70° to balance between the spatial resolution and the amount of Gibbs ringing artifacts.
The simulated echo amplitudes considering nutation due to RF pulses, precession due to gradients, and T1 and T2 relaxation are shown in Figure 2b-c for bone marrow fat and bone marrow water respectively. T1/T2 of 360/80 ms were used for bone marrow fat and those of 1800/50 ms were used bone marrow water (30). Initial oscillation occurred with the constant flip angle train but did not with the variable flip angle trains. For each flip angle train, the 2D point spread function (PSF) due to signal modulation was computed by mapping the simulated echo amplitudes into k-space, performing zero-filling, and then applying 2D Fourier transform. The cross sections of the 2D PSFs along the y direction and that of an optimal 2D PSF (no signal modulation) were plotted in the bottom (Figure 2d-e). These plots indicated that a decrease in the minimum flip angle resulted in a decrease in the full width at half maximum (FWHM) and an increase in the side lobe amplitudes. We chose the minimum flip angle as 70° to balance between increase in spatial resolution (determined by FWHM) and decrease in Gibbs ringing artifacts (affected by side lobe amplitudes). By choosing this minimum flip angle, the PSF from bone marrow fat (water) provided a FWHM of 1.49 (1.53) pixels, which was a 5.4% (8.9%) increase compared to that of the optimal PSF.
bSSFP Optimization
To reduce banding artifacts, bSSFP images with phase-cycling angles of 0° and 180° were acquired and combined using maximum intensity projection (12). An echo time (TE) of 4.2 ms was used to provide water/fat in-phase, and partial kx acquisition was used to achieve this TE. The readout bandwidth was ±62.5 kHz, which minimized the TR under the constraints of gradient heating. The resultant TR was in a range of 9 – 9.2 ms. A flip angle of 50° was used to provide high signal as well as uniform signal over off-resonance frequencies after combining two sets of the bSSFP images (13).
Simulation
The theoretical signal amplitudes from bone marrow with the proposed 3D VFA-FSE and 3D bSSFP sequences were calculated using the Bloch equations. For 3D VFA-FSE, the first echo signal was used as a signal amplitude. Because yellow marrow and red marrow have different fractions of fat and water, the signal amplitudes were calculated by varying the bone marrow water fraction from 0 to 50% assuming the remaining was bone marrow fat (not accounting for the presence of protein). In this simulation, we ignored signal dephasing due to off-resonances assuming no trabecular elements were located in the voxel or nearby. SNR efficiency, which is normally defined as the SNR divided by the square root of acquisition time (31), was used as a metric to compare SNR performance between the two sequences. In our simulation, we calculated SNR efficiency using the equation of
| (1) |
where Mxy (T1, T2, TR, TE) is the theoretical signal amplitude over each and TR, and Tacq is the total acquisition time during each TR. For bSSFP, was used instead of because two sets of bSSFP images with different phase-cycling angles were combined.
Ex Vivo Study
Ex vivo experiments were performed, comparing 3D bSSFP and 3D VFA-FSE in terms of SNR and depiction of trabecualr bone structures. We used six proximal femoral head specimens, which had been obtained from female donors (age: 81.54 ± 9.27 years) having osteoporotic fractures in the femoral neck and stored in a freezer. After thawing the specimens gradually to room temperature, MRI exams were performed using an eight-channel phased-array knee coil (In-Vivo Corporation, Gainesville, FL) on a GE discovery MR750 3T scanner. Outer volume suppression was not needed for the specimen study. VFA-FSE imaging was performed at two different spatial resolutions, 156 × 156 × 400 μm3 and 234 × 234 × 700 μm3. The first VFA-FSE images were acquired with a 8 × 8 cm2 in-plane FOV, 512 × 512 matrix size, 128 sections, 9.6 ms echo spacing, 500 ms TR, and 43 min scan time. The second VFA-FSE images were acquired with parameters more similar to in vivo conditions, using a 12 × 12 cm2 FOV with 512 × 512 matrix size, 64 sections, 8.3 ms echo spacing, 500 ms TR, and 21.5 min scan time. For one of the specimens, the amplitudes of the ten echoes were also measured by turning off the phase encode gradients. Imaging with the bSSFP sequence was performed by using the optimized sequence parameters (TR/TE = 9/4.2 ms, flip angle = 50°) described above and spatial resolution and in-plane FOV equivalent to those of the second VFA-FSE acquisition. k-Space coverage was rectangular and the scan time was matched to the second 3D VFA-FSE imaging by prescribing 70 sections and two repetitions (number of signal averaging).
Trabecular bone structure analysis was performed on both the VFA-FSE and bSSFP images with 234 × 234 × 700 μm3 resolution. On each of the central 30 slices for the six specimens, an ROI was placed over the bone marrow region not to include air bubbles. Identical ROIs were used for both VFA-FSE and bSSFP. Bone segementation in the defined ROIs was performed by applying coil intensity correction, followed by bone enhancement fuzzy C-means clustering (32). The fuzzy C-means clustering produced a partial membership segmentation based on the signal intensity and local structure information, assigning each voxel a value between 0 and 1 representing the amount of bone. Bone structure parameters such as apparent bone volume over total volume fraction (app. BV/TV) and apparent trabecular number (app. Tb.N) (1/mm) were quantified after binarization of the bone segmentations. App. BV/TV was calculated by voxel counting and app. Tb.N was determined using the mean intercept length (MIL) technique based on the plate model (33). Pearson correlation coefficients were calculated between extracted bone structure parameters from 3D VFA-FSE and 3D bSSFP and Bland-Altman plots were generated to qualitatively assess the agreement between them.
SNR was also compared between the VFA-FSE images and bSSFP images of the equivalent resolution. A total of 138 ROIs were placed carefully over the images from the six specimens not to include visible trabecular bone. The areas of the ROIs were 0.9 mm2 to 2.2 mm2, corresponding to the areas of 17 to 40 pixels. The SNR for each ROI was determined as the mean signal from this ROI divided by the standard deviation from an ROI in the background, multiplied by a scaling factor 0.7 (34).
In Vivo Study
In vivo hip imaging was performed using an eight-channel phased-array cardiac coil (In-Vivo Corporation, Gainesville, FL) at 3T. Four healthy subjects (2 males and 2 females, age: 40.5 ± 13.5 years, body weight: 65.5 ± 10.2 kg) and six human immunodeficiency virus (HIV)-infected patients (6 males, age: 55.7 ± 5.7 years, body weights: 69.0 ± 9.6 kg), who might be at higher risk for bone fracture incidents (35), were scanned after obtaining informed consent. The study was approved by the Institutional Review Board, and one of the hips was imaged for each subject. For two of the healthy subjects, the ability of applying outer volume suppression was assessed and both high-resolution coronal 3D VFA-FSE and bSSFP images were acquired. For the other eight subjects, only high-resolution 3D VFA-FSE images were acquired.
For high-resolution 3D VFA-FSE imaging, an image FOV was prescribed to include one hip of interest in the coronal plane and the frequency direction was set as the superior-inferior direction. Then, one sagittal saturation slab was located on the other side of the body, exterior to the imaging slab. Imaging parameters included 12 × 12 cm2 FOV, 512 × 512 matrix size, and 0.7 mm section thickness (234 × 234 × 700 μm3 resolution), and 60 sections, and the scan time was 20 min. The ability of suppressing signal was assessed by comparing large-FOV images with and without applying outer volume suppression, using a FOV over 40 × 40 cm2, 256 × 256 in-plane matrix size, 3 mm section thickness, and 28 sections.
High resolution 3D bSSFP imaging performed on the two subjects had the same in-plane FOV and spatial resolution with those of 3D VFA-FSE. To avoid phase wrapping artifacts, the frequency-encoding direction was set as the right-left direction and the phase-encode direction (superior-inferior direction) was oversampled by a factor of two. Prescribing oversampling resulted in an elliptical k-space coverage in the ky – kz plane, with a 13% smaller k-space radius by our built-in scanner protocol. Scan time was matched with that of 3D VFA-FSE by acquiring 64 sections with a repetition of two.
SNR of bone marrow was measured on the high-resolution 3D VFA-FSE and 3D bSSFP images. For each subject, 30 ROIs were located, 15 ROIs on yellow marrow regions and 15 ROIs on red marrow regions, not to include visible trabecular bone elements. Because there was no background region in the images, the noise standard deviation was measured from an ROI in cortical bone where signal was almost zero.
Results
Simulation
Figure 3 compares the SNR efficiency of the optimized 3D VFA-FSE and 3D bSSFP sequences over varying the bone marrow water fraction from 0 to 50%, assuming an equivalent spatial resolution and readout bandwidth were used. When the percentage of bone marrow water increased from 0% to 50%, the SNR efficiency was reduced by 34.5% for VFA-FSE and 41.0% for bSSFP. Overall, VFA-FSE provided 35.8 – 52.4% higher SNR efficiency than bSSFP when the bone marrow water percentage was 0 – 50%.
Figure 3.
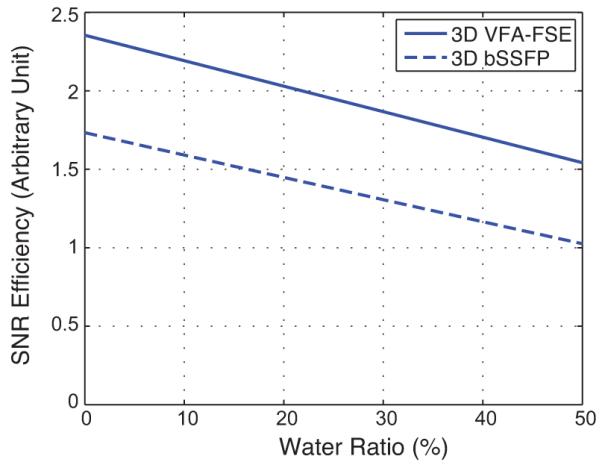
SNR efficiency comparison between optimized 3D VFA-FSE and 3D bSSFP over a range of bone marrow water fractions between 0 – 50%. VFA-FSE provides higher SNR efficiency than bSSFP.
Ex Vivo Study
Figure 4 shows the amplitudes of the ten echoes for 3D VFA-FSE, measured from one femoral head specimen. For comparison, the simulated echo amplitudes for a voxel consisting of 84% bone marrow fat and 16% bone marrow water, the fractions of bone marrow fat and water in yellow marrow (prevalent in the proximal femoral head (22)) when ignoring the protein fraction, were shown. The deviation of the signal profile from the simulation was most probably due to actual T1 and T2 differences, suppression of J-coupling modulation (36), and diffusion weighting introduced by the crusher gradients (25). J-modulation and diffusion effects with FSE are discussed further in the Discussion section. The PSF from this actual signal modulation provided a FWHM of 1.52 pixel (7.4% higher than that of the optimal PSF).
Figure 4.
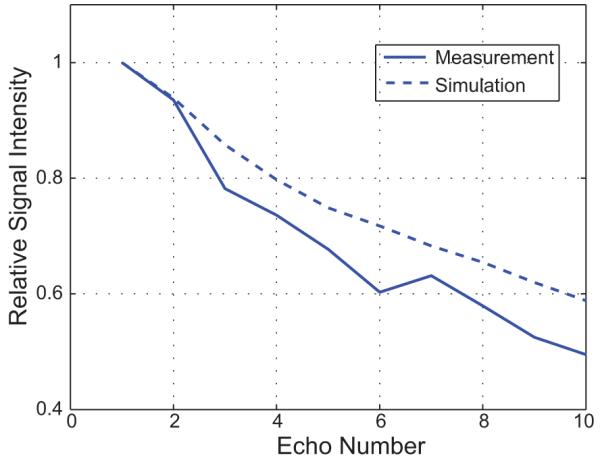
Echo amplitudes measured from one specimen. The phase encoding gradients were turned off to measure the signal amplitudes of the ten echoes, and the amplitudes were normalized by the first echo amplitude. For comparison, the simulated echo amplitudes from the voxel containing 84% bone marrow fat and 16% bone marrow water are plotted as well. The PSF from this measured signal modulation has a FWHM of 1.52 pixel, 7.4% higher than that of the optimal PSF.
When comparing between the VFA-FSE images with two different spatial resolutions (Figure 5a-b), a resolution of 156 × 156 × 400 μm3 (Figure 5a) provided a sharper depiction of trabecular bone structure as a result of reduced partial volume effects. In particular, dense bone structure close to the cortical shell was better depicted with this resolution. However, trabecular elements were still well delineated with a 234 × 234 × 700 μm3 resolution overall. Figure 5d-f shows the partial membership segmentations of trabecular bone for the ROIs denoted in the images on the top.
Figure 5.

Ex vivo images of the proximal femoral head from a female donor who had an osteoporotic fracture. Note the air bubbles at the periphery due to freezing/thawing cycles. (a) A slice from VFA-FSE with a spatial resolution of 156 × 156 × 400 μm3. (b-c) Slices from VFA-FSE and bSSFP with a spatial resolution of 234 × 234 × 700 μm3 for the location close to (a). It can be seen that the higher spatial resolution provides a better depiction of trabecular structure, particularly in the area of dense bone close to the cortical shell. (d-f) Bone segmentation maps using fuzzy C-means clustering are presented for the ROIs shown in (a-c), where gray scale represents a fraction of bone in each voxel (0: marrow voxel, 1: bone voxel).
The structural paramters determined from the bone segementation maps showed good correlations between 3D VFA-FSE and 3D bSSFP. The Pearson correleation coefficients for app. BV/TV and app. Tb.N were 0.7068 (p < 0.0001) and 0.8587 (p < 0.0001), respectively. The plots of the Bland-Altman method corresponding to the two structural parameters are shown in Figure 6, respectively. The Bland-Altman plot for app. BV/TV demonstrated an excellent agreement between the two methods having 97% of the points within the band of 1.96 times of standard deviation (95% limit of agreement). For app. Tb.N, the Bland-Altman plot exhibited a small systematic bias, but still there was a good agreement having 93% of the points within the band.
Figure 6.
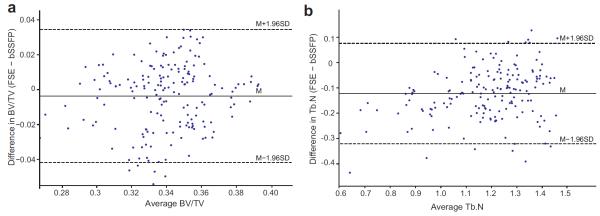
Bland-Altman plots of structural parameters determined from the ex vivo 3D FSE images and 3D bSSFP images. (a-b) The plots for app. BV/TV and app. Tb.N. The mean difference and 95% limits of agreement are denoted in solid and dashed lines, respectively.
The average SNR measured from the 138 ROIs was 66.6 ± 11.1 for VFA-FSE and 29.5 ± 4.5 for bSSFP. Even considering that the corners of ky – kz plane were not acquired for VFA-FSE (providing 11.4% higher SNR than acquiring the corners (26)) and partial kx acquisition was performed with bSSFP (13% SNR decrease), the SNR difference was higher than that from the simulation. It might result from signal reduction due to intravoxel dephasing with bSSFP.
In Vivo Study
Figure 7 demonstrates the performance of outer volume suppression for in vivo imaging. The residual signal was evaluated by placing ROIs in the saturation slab. For the muscle regions the residual signal was under the noise level, while for the proximal femur region the residual signal was 2 – 4% of the non-suppressed signal. The residual signal from the subcutaneous fat was higher probably due to B1 inhomogeneities near the edge of the body, but it was less than 7% of the original signal in most regions.
Figure 7.
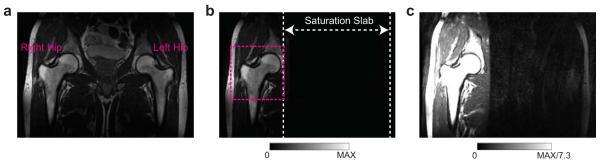
To demonstrate the efficiency of outer volume suppression for in vivo imaging of the proximal femur. (a) Large-FOV image without outer volume suppression. (b) Large-FOV image with outer volume suppression on the left side of the body. (c) The same image with (b), with a window level and width set to display noise level. In most regions within the saturation slab, signal is suppressed well. Some residual signals occurs in the subcutaneous fat at the edge of the body, probably due to significant B1 inhomogeneities at that region. A possible FOV to image the right hip is shown as a dashed box in (b).
In vivo high-resolution images from one healthy subject (weight: 51 kg) are illustrated in Figure 8. Suppression artifacts from the saturation slab were not visible in the VFA-FSE image. Both VFA-FSE and bSSFP delineated trabecular bone structure well. Red marrow in the intertrochanteric region generated lower bone marrow signal, but still the trabecular bone structure was visible. Some trabecular elements, which were not apparent with VFA-FSE, were visualized with bSSFP due to increased intravoxel dephasing at the interfaces of bone and bone marrow. The average SNR over the 30 ROIs (including both yellow marrow and red marrow regions) was 13.20 ± 3.41 with VFA-FSE and 8.7 ± 2.88 with bSSFP.
Figure 8.

In vivo images of the left hip from one healthy subject. (a) One slice from 3D VFA-FSE combined with outer volume suppression. No visible artifacts from outer volume suppression are observed. (b) The corresponding slice from 3D bSSFP. Trabecular bone structure is well delineated with both sequences; VFA-FSE provides higher SNR overall.
Figure 9 shows both VFA-FSE and bSSFP images from another healthy subject (weight: 78 kg). The average SNR was lower than that from the images on Figure 8, 10.32 ± 2.11 with VFA-FSE and 6.59 ± 0.93 with bSSFP, because of a higher body weight, which caused increased body noise and decreased signal reception due to an increased distance between the proximal femur and receive-array coil. SNR was too low on the bSSFP image to depict trabecular bone structure but the VFA-FSE image still provided a good delineation of trabecular bone structure.
Figure 9.

In vivo images from another healthy subject with a higher body weight. (a) One slice from 3D VFA-FSE combined with outer volume suppression. The subcutaneous fat at the left end of the body was aliased into the FOV as denoted by an arrow. (b) The corresponding slice from 3D bSSFP. SNR is not sufficient to depict fine structures with bSSFP, but higher SNR on the VFA-FSE image allows for a better visualization of structures.
The VFA-FSE images from two HIV-infected patients are shown in Figure 10. On both images, trabecular structures were well delineated but a lack of trabecular elements in the neck and intertrochanteric regions were observed as denoted by arrows.
Figure 10.

3D VFA-FSE images from two HIV-infected patients. (a-b) Trabecular structures are well delineated in the two slices, and a lack of trabecular elements in the neck or intertrochanteric region can be seen as denoted by arrows.
The average SNR from a total of 150 ROIs on yellow marrow regions (15 ROIs for each subject) was 13.29 ± 3.32 and that on red marrow regions was 8.76 ± 2.82. SNR from red marrow regions was 34% lower than that from yellow marrow regions, but was still close to 10, which has been considered as an SNR at which reproducible quantification of structural parameters is possible (37).
Discussion
In this work, we have developed a reduced-FOV 3D VFA-FSE technique to image high-resolution trabecular bone structure of the proximal femur in a feasible scan time. As a spin-echo type sequence, 3D VFA-FSE is less sensitive to off-resonance effects and can be more SNR-efficient than 3D bSSFP. During one TR, which is typically much longer than that of other steady-state sequences such as 3D bSSFP or 3D FLASE, outer volume suppression can be easily incorporated. Applying outer volume suppression allows for prescribing a smaller FOV and depicting high-resolution structures from a deeply-seated body region efficiently. By prescribing the superior-to-inferior direction as the frequency-encoding direction, breathing motion artifacts can be also reduced. One major concern of using 3D FSE for high-resolution imaging is blurring; however, blurring can be reduced by properly modulating the refocusing flip angles. In our application, we limited the number of echoes to ten because the echo spacing was considerably long and minimizing blurring effects would be crucial in delineating trabecular bone structure.
Our simulation, ex vivo experiments, and in vivo experiments all validated that 3D VFA-FSE can provide higher SNR efficiency than 3D bSSFP. The 3D VFA-FSE images from ten subjects provided sufficient SNR in quantifying trabecular bone structures at the proximal femur overall. For trabecular bone imaging at the proxiaml femur, the presense of significant amount of red marrow in the neck and intertrochanteric regions needs to be taken into consideration unlike peripheral skeletal sites where conversion of red to yellow marrow is normally completed by the age of 25 years (22, 23). Red marrow normally generates lower signal than yellow marrow due to its higher fraction of bone marrow water, which has a longer T1 and shorter T2 than bone marrow fat. The 3D VFA-FSE sequence can provide less signal loss in red marrow than 3D bSSFP because of increased magnetization recovery during a longer TR and minimal signal cancellation between fat and water having different resonant frequencies. The ability of 3D VFA-FSE to improve red marrow signal is of high importance especially in the proximal femur where red bone marrow exacerbates an accurate analysis of bone structure.
The reduced-FOV 3D VFA-FSE sequence allows for depcting trabecular bone structure at the proxiaml femur in a clinically feasible scan time. We compared two bone structural parameters measured from 3D VFA-FSE and 3D bSSFP images on six specimens, which had a visually equivalent spatial resolution. The structural parameters of app. BV/TV and app. Tb.N from 3D VFA-FSE had a good correlation and agreement with those from 3D bSSFP; a previous study already demonstrated that structural parameters from 3D bSSFP had good correlations with those from high-resolution peripheral quantitative computed tomography (38), which can better discriminate bone and bone marrow due to higher spatial resolution. Our in vivo images also depicted the structural degeneration of the trabecular bone structures in HIV-infected patients. Quantification of bone structural parameters from in-vivo images might allow for evaluation of bone structure degeneration for patients with osteoporosis or HIV infection.
When we simulated the echo amplitudes by using the extended phase graph algorithm, we assumed that only nutation due to RF pulses, precession due to gradients, and T1 and T2 relaxation effects affect the spin system. However, practically, several other factors also affect the spin system. First, the repetitive use of refocusing pulses would suppress J-coupling modulation from fat and actually would increase the amplitude of each echo (36). Second, diffusion effects due to crusher gradients would reduce the echo amplitudes overall (25). From our pulse sequence, the effective b-factor on the first echo due to the x crusher gradients with a combination of the readout gradient was 0.97 s/mm2 and that due to the z crusher gradients was 0.16 s/mm2. Both values are negligible; however, a repetitive use of the crusher gradients will increase the effective b-factor toward later echoes. Since signal changes due to the suppression of J-coupling modulation and diffusion effects depend on the refocusing flip angles (25, 39), determining the flip angles by considering these effects can improve the actual signal profile.
Outer volume suppression performed well for our in vivo study by playing three quadratic-phase RF pulses with high bandwidths at optimized time points. Even with outer volume suppression, the specific absorption rate was much lower than the limit and similar to that of 3D bSSFP. For our work, we located one sagittal saturation slab on the contralateral side of the body adjacent to the FOV, allowing for a phase-encode FOV of 12 cm. However, for a big subject who might have thicker subcutaneous fat bands at the body ends, the phase-encode FOV might need to be increased to prevent phase-wrap artifacts (from non-suppresed regions) onto the proximal femur. Alternatively, two saturation slabs can be applied on both right and left sides exterior to the image FOV as used in (21), which can provide more flexibility in determing the FOV.
There are several limitations in our work. We used a spatial resolution of 234 × 234 × 700 μm3 for in vivo study, which might not be sufficient to depict very thin trabecular elements or to resolve very dense bone structures. These problems might be solved if an advanced coil array can be used, which can further improve SNR. SNR improvement can be exploited to increase the spatial resolution or decrease the scan time. Recently, it was shown that a 26-element coil setup can provide much higher SNR and more favorable geometry for parallel imaging compared to a 12-element coil setup for trabecular bone imaging at the proximal femur (40). Another limitation of our study is that only two subjects were scanned with both 3D VFA-FSE and bSSFP for in vivo comparison, and actual spatial resolutions from the two sequences were not equivalent, making direct comparison of trabecular bone structures not suitable. Neverthelss, we think that in vivo feasiblity of depicting trabecular bone structure in the proximal femur using our proposed sequence was validated well with a total of ten subject scans.
In conclusion, we have presented a reduced-FOV 3D VFA-FSE pulse sequence for high-resolution trabecular bone imaging of the proximal femur and demonstrated its in vivo feasibility. After careful optimization of the acquisition parameters such as echo train length, refocusing flip angles, and TR, 3D VFA-FSE revealed high SNR efficiency without generating significant blurring. Outer volume suppression did not generate visible artifacts and allowed for efficient imaging with a small FOV for the deeply-seated proximal femur.
Acknowledgements
The authors are greatly thankful for Dr. Dimitrios Karampinos, Dr. Peder Larson, and Dr. Brian Hargreaves for helpful discussions of pulse sequence development, Dr. Sharmila Majumdar and Dr. Thomas link for useful feedback on image quality.
Grant Sponsors: This work was supported by NIH R01AR057336, NIH P30AR058899, and the Center for AIDS Research (CFAR), UCSF-Gladstone Institute for Virology and Immunology.
References
- 1.NIH Consensus Development Panel on Osteoporosis Prevention Diagnosis, and Therapy. Osteoporosis prevention, diagnosis, and therapy. Jama. 2001;285:785–795. [Google Scholar]
- 2.Keene GS, Parker MJ, Pryor GA. Mortality and morbidity after hip fractures. BMJ. 1993;307:1248–1250. doi: 10.1136/bmj.307.6914.1248. [DOI] [PMC free article] [PubMed] [Google Scholar]
- 3.Kleerekoper M, Villanueva AR, Stanciu J, Rao DS, Parfitt AM. The role of three-dimensional trabecular microstructure in the pathogenesis of vertebral compression fractures. Calcif Tissue Int. 1985;37:594–597. doi: 10.1007/BF02554913. [DOI] [PubMed] [Google Scholar]
- 4.Parfitt AM, Mathews CH, Villanueva AR, Kleerekoper M, Frame B, Rao DS. Relationships between surface, volume, and thickness of iliac trabecular bone in aging and in osteoporosis. Implications for the microanatomic and cellular mechanisms of bone loss. J Clin Invest. 1983;72:1396–1409. doi: 10.1172/JCI111096. [DOI] [PMC free article] [PubMed] [Google Scholar]
- 5.Weiger M, Stampanoni M, Pruessmann KP. Direct depiction of bone microstructure using MRI with zero echo time. Bone. 2013;54:44–47. doi: 10.1016/j.bone.2013.01.027. [DOI] [PubMed] [Google Scholar]
- 6.Hipp JA, Jansujwicz AS, Craig A, Snyder BD. Trabecular bone morphology from micro-magnetic resonance imaging. J Bone Miner Res. 1996;11:286–292. doi: 10.1002/jbmr.5650110218. [DOI] [PubMed] [Google Scholar]
- 7.Majumdar S, Newitt D, Mathur A, et al. Magnetic resonance imaging of trabecular bone structure in the distal radius: relationship with X-ray tomographic microscopy and biomechanics. Osteoporos Int. 1996;6:376–385. doi: 10.1007/BF01623011. [DOI] [PubMed] [Google Scholar]
- 8.Majumdar S, Genant HK, Grampp S, et al. Correlation of trabecular bone structure with age, bone mineral density, and osteoporotic status: in vivo studies in the distal radius using high resolution magnetic resonance imaging. J Bone Miner Res. 1997;12:111–118. doi: 10.1359/jbmr.1997.12.1.111. [DOI] [PubMed] [Google Scholar]
- 9.Wehrli F, Hwang S, Ma J, Song H, Ford J, Haddad J. Cancellous bone volume and structure in the forearm: noninvasive assessment with mr microimaging and image processing. Radiology. 1998;206:347–357. doi: 10.1148/radiology.206.2.9457185. [DOI] [PubMed] [Google Scholar]
- 10.Majumdar S. Magnetic resonance imaging of trabecular bone structure. Top Magn Reson Imaging. 2002;13:323–334. doi: 10.1097/00002142-200210000-00004. [DOI] [PubMed] [Google Scholar]
- 11.Wehrli FW, Saha PK, Gomberg BR, et al. Role of magnetic resonance for assessing structure and function of trabecular bone. Top Magn Reson Imaging. 2002;13:335–355. doi: 10.1097/00002142-200210000-00005. [DOI] [PubMed] [Google Scholar]
- 12.Bangerter N, Hargreaves B, Vasanawala S, Pauly J, Gold G, Nishimura D. Analysis of multiple-acquisition SSFP. Magn Reson Med. 2004;51:1038–1047. doi: 10.1002/mrm.20052. [DOI] [PubMed] [Google Scholar]
- 13.Banerjee S, Han ET, Krug R, Newitt DC, Majumdar S. Application of refocused steady-state free-precession methods at 1.5 and 3 T to in vivo high-resolution MRI of trabecular bone: Simulations and experiments. J Magn Reson Imaging. 2005;21:818–825. doi: 10.1002/jmri.20348. [DOI] [PubMed] [Google Scholar]
- 14.Krug R, Banerjee S, Han ET, Newitt DC, Link TM, Majumdar S. Feasibility of in vivo structural analysis of high-resolution magnetic resonance images of the proximal femur. Osteoporos Int. 2005;16:1307–1314. doi: 10.1007/s00198-005-1907-3. [DOI] [PubMed] [Google Scholar]
- 15.Ma J, Wehrli FW, Song HK. Fast 3D large-angle spin-echo imaging (3D FLASE) Magn Reson Med. 1996;35:903–910. doi: 10.1002/mrm.1910350619. [DOI] [PubMed] [Google Scholar]
- 16.Hennig J, Nauerth A, Friedburg H. RARE imaging: a fast imaging method for clinical MR. Magn Reson Med. 1986;3:823–833. doi: 10.1002/mrm.1910030602. [DOI] [PubMed] [Google Scholar]
- 17.Magland JF, Rajapakse CS, Wright AC, Acciavatti R, Wehrli FW. 3D fast spin echo with out-of-slab cancellation: A technique for high-resolution structural imaging of trabecular bone at 7 Tesla. Magn Reson Med. 2010;63:719–727. doi: 10.1002/mrm.22213. [DOI] [PMC free article] [PubMed] [Google Scholar]
- 18.Busse RF, Hariharan H, Vu A, Brittain JH. Fast spin echo sequences with very long echo trains: design of variable refocusing flip angle schedules and generation of clinical T2 contrast. Magn Reson Med. 2006;55:1030–1037. doi: 10.1002/mrm.20863. [DOI] [PubMed] [Google Scholar]
- 19.Busse RF, Brau A, Vu A, et al. Effects of refocusing flip angle modulation and view ordering in 3D fast spin echo. Magn Reson Med. 2008;60:640–649. doi: 10.1002/mrm.21680. [DOI] [PMC free article] [PubMed] [Google Scholar]
- 20.Le Roux P, Gilles RJ, McKinnon GC, Carlier PG. Optimized outer volume suppression for single-shot fast spin-echo cardiac imaging. J Magn Reson Imaging. 1998;8:1022–1032. doi: 10.1002/jmri.1880080505. [DOI] [PubMed] [Google Scholar]
- 21.Wilm BJ, Svensson J, Henning A, Pruessmann KP, Boesiger P, Kollias SS. Reduced field-of-view MRI using outer volume suppression for spinal cord diffusion imaging. Magn Reson Med. 2007;57:625–630. doi: 10.1002/mrm.21167. [DOI] [PubMed] [Google Scholar]
- 22.Vogler JB, III, Murphy WA. Bone marrow imaging. Radiology. 1988;168:679–693. doi: 10.1148/radiology.168.3.3043546. [DOI] [PubMed] [Google Scholar]
- 23.Vande Berg BC, Lecouvet FE, Moysan P, Maldague B, Jamart J, Malghem J. MR assessment of red marrow distribution and composition in the proximal femur: correlation with clinical and laboratory parameters. Skeletal Radiol. 1997;26:589–596. doi: 10.1007/s002560050291. [DOI] [PubMed] [Google Scholar]
- 24.Oshio K, Williamson DS, Winalski CS, Miyamoto S, Kosugi S, Suzuki K. Fast recovery RARE for knee imaging. Proceedings of the 6th Annual Meeting of ISMRM; Sydney, Australia. 1998. (abstract 1090) [Google Scholar]
- 25.Weigel M, Hennig J. Diffusion sensitivity of turbo spin echo sequences. Magn Reson Med. 2012;67:1528–1537. doi: 10.1002/mrm.24286. [DOI] [PubMed] [Google Scholar]
- 26.Bernstein MA, Fain SB, Riederer SJ. Effect of windowing and zero-filled reconstruction of MRI data on spatial resolution and acquisition strategy. J Magn Reson Imaging. 2001;14:270–280. doi: 10.1002/jmri.1183. [DOI] [PubMed] [Google Scholar]
- 27.Schulte RF, Tsao J, Boesiger P. Pruessmann KP. Equi-ripple design of quadratic-phase RF pulses. J Magn Reson. 2004;166:111–122. doi: 10.1016/j.jmr.2003.10.009. [DOI] [PubMed] [Google Scholar]
- 28.Mani S, Pauly J, Conolly S, Meyer C, Nishimura D. Background suppression with multiple inversion recovery nulling: applications to projective angiography. Magn Reson Med. 1997;37:898–905. doi: 10.1002/mrm.1910370615. [DOI] [PubMed] [Google Scholar]
- 29.Alsop DC. The sensitivity of low flip angle RARE imaging. Magn Reson Med. 1997;37:176–184. doi: 10.1002/mrm.1910370206. [DOI] [PubMed] [Google Scholar]
- 30.Schick F, Bongers H, Jung WI, et al. Proton relaxation times in human red bone marrow by volume selective magnetic resonance spectroscopy. Appl Magn Reson. 1992;3:947–963. [Google Scholar]
- 31.Parker DL, Gullberg GT. Signal-to-noise efficiency in magnetic resonance imaging. Med Phys. 1990;17:250–257. doi: 10.1118/1.596503. [DOI] [PubMed] [Google Scholar]
- 32.Folkesson J, Carballido-Gamio J, Eckstein F, Link T, Majumdar S. Local bone enhancement fuzzy clustering for segmentation of MR trabecular bone images. Med Phys. 2010;37:295–302. doi: 10.1118/1.3264615. [DOI] [PMC free article] [PubMed] [Google Scholar]
- 33.Parfitt A, Drezner M, Glorieux F, et al. Bone histomorphometry: standardization of nomenclature, symbols, and units. J Bone Miner Res. 1987;2:595–610. doi: 10.1002/jbmr.5650020617. [DOI] [PubMed] [Google Scholar]
- 34.Constantinides CD, Atalar E, McVeigh ER. Signal-to-noise measurements in magnitude images from NMR phased arrays. Magn Reson Med. 1997;38:852–857. doi: 10.1002/mrm.1910380524. [DOI] [PMC free article] [PubMed] [Google Scholar]
- 35.McComsey GA, Tebas P, Shane E, et al. Bone disease in HIV infection: a practical review and recommendations for HIV care providers. Clinical infectious diseases. 2010;51:937–946. doi: 10.1086/656412. [DOI] [PMC free article] [PubMed] [Google Scholar]
- 36.Constable RT, Anderson AW, Zhong J, Gore JC. Factors influencing contrast in fast spin-echo MR imaging. Magn Reson Imaging. 1992;10:497–511. doi: 10.1016/0730-725x(92)90001-g. [DOI] [PubMed] [Google Scholar]
- 37.Wehrli FW, Saha PK, Gomberg BR, Song HK. Noninvasive assessment of bone architecture by magnetic resonance micro-imaging-based virtual bone biopsy. Proceedings of the IEEE. 2003;91:1520–1542. [Google Scholar]
- 38.Kazakia GJ, Hyun B, Burghardt AJ, et al. In Vivo Determination of Bone Structure in Postmenopausal Women: A Comparison of HR-pQCT and High-Field MR Imaging. J Bone Miner Res. 2008;23:463–474. doi: 10.1359/jbmr.071116. [DOI] [PubMed] [Google Scholar]
- 39.Weigel M, Schwenk S, Kiselev VG, Scheffler K, Hennig J. Extended phase graphs with anisotropic diffusion. J Magn Reson. 2010;205:276–285. doi: 10.1016/j.jmr.2010.05.011. [DOI] [PubMed] [Google Scholar]
- 40.Chang G, Deniz CM, Honig S, et al. Feasibility of three-dimensional MRI of proximal femur microarchitecture at 3 tesla using 26 receive elements without and with parallel imaging. J Magn Reson Imaging. 2013 doi: 10.1002/jmri.24345. doi: 10.1002/jmri.24345. [DOI] [PMC free article] [PubMed] [Google Scholar]