. 2014 Nov 19;3:e03635. doi: 10.7554/eLife.03635

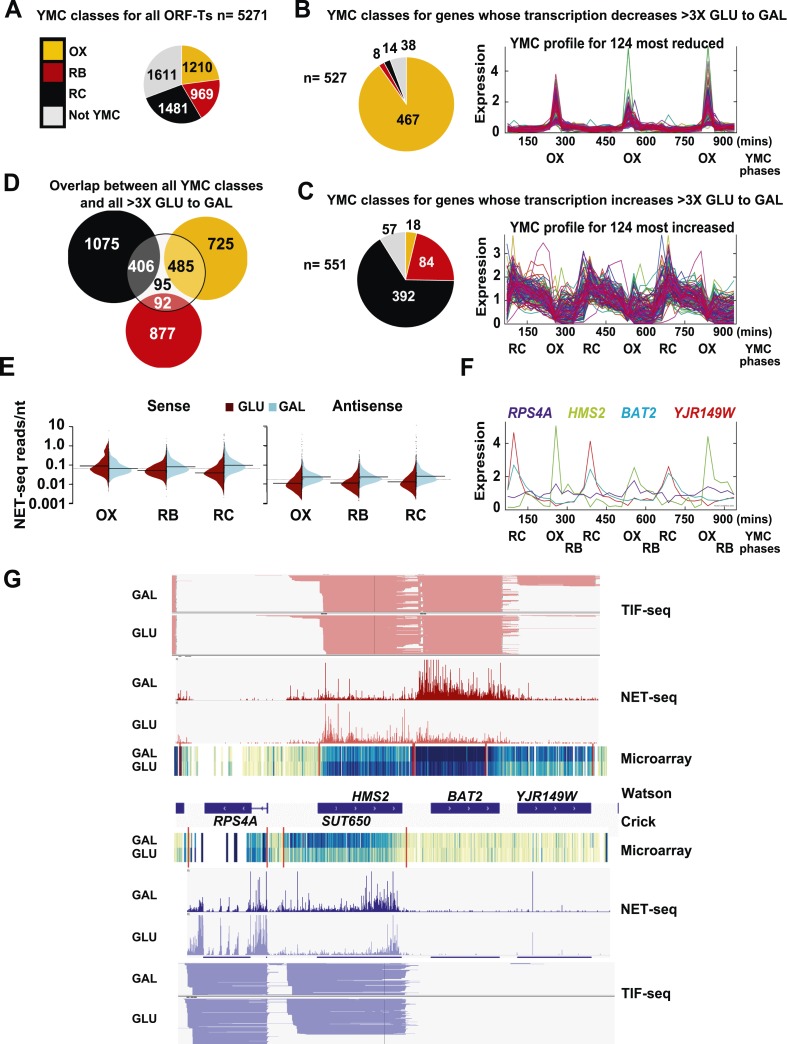
Figure 1. Reciprocal switching of expression by carbon source reveals links to the YMC.

(A) The distribution of all ORF-Ts into different YMC phases. OX, oxidative phase; RB, reductive building phase; RC, reductive charging phase of the YMC. (B, C, F) YMC profiles (SCEPTRANS; http://moment.utmb.edu/cgi-bin/main_cc.cgi) (Kudlicki et al., 2007) showing cycling expression at 124 genes with the (B) most reduced and (C) most increased transcription (NET-seq) after a switch from glucose (GLU) to galactose (GAL) for 3 h and (F) at the HMS2:BAT2 locus. (D) Overlap between all YMC classes and all ORF-Ts showing >threefold change in transcription on the GLU to GAL shift. (E) NET-seq reads on sense or antisense strands genome-wide in GLU (red) or GAL (blue) for ORF-Ts with peak expression in phases of the YMC indicated. (G) Strand-specific TIF-seq (Pelechano et al., 2013), microarray and NET-seq data at the HMS2:BAT2 locus. Profiles from cells cultured in GLU or GAL on the Watson strand (top) or Crick strand (bottom) are shown. The TIF-seq data indicate each different transcript isoform, microarray data indicate levels of steady-state poly(A)+ RNA (blue—darker colour for more RNA) and the NET-seq data (normalized, unique, and clipped to 3′OH) display transcript reads (scale 0–30) associated with elongating RNAPII. Screen shots are displayed using IGV (Robinson et al., 2011; Thorvaldsdottir et al., 2013).

DOI: http://dx.doi.org/10.7554/eLife.03635.003

Figure 1.

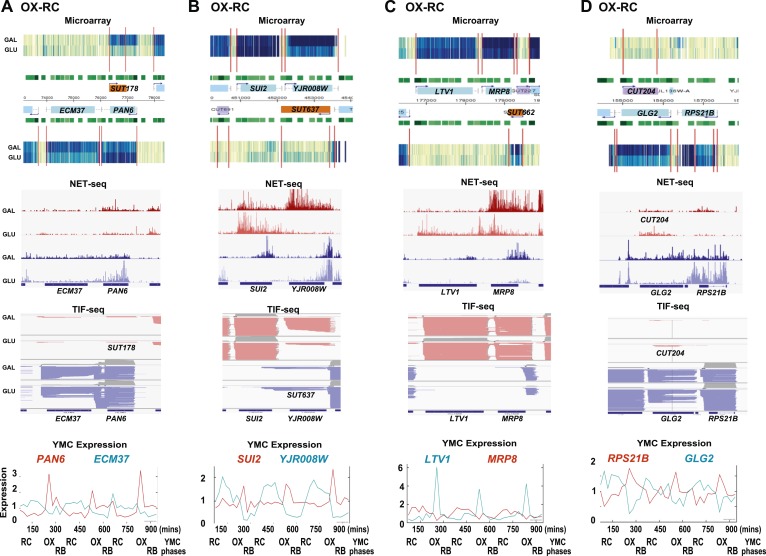
Figure 1—figure supplement 1. Exemplary tandem gene clusters and their regulation by carbon source and the YMC.

Figure 1—figure supplement 1.

Supplements 1A–D, 2A–D, 3A–C show examples of tandem gene clusters with reciprocal switching of transcription by carbon source, di-cistrons, and antisense transcripts. Supplements 3D and 4A–D show examples of tandem gene clusters that do not show reciprocal switching of transcription by carbon source. Gene clusters were selected from the analyses in Supplementary files 1F–J. Each panel shows the poly(A)+ RNA profile by microarray, NET-seq, TIF-seq, and YMC profile screenshots for the Watson strand (top) or the Crick strand (bottom). Transcription over intergenic regions and di-cistonic transcripts is common to both groups of clusters.
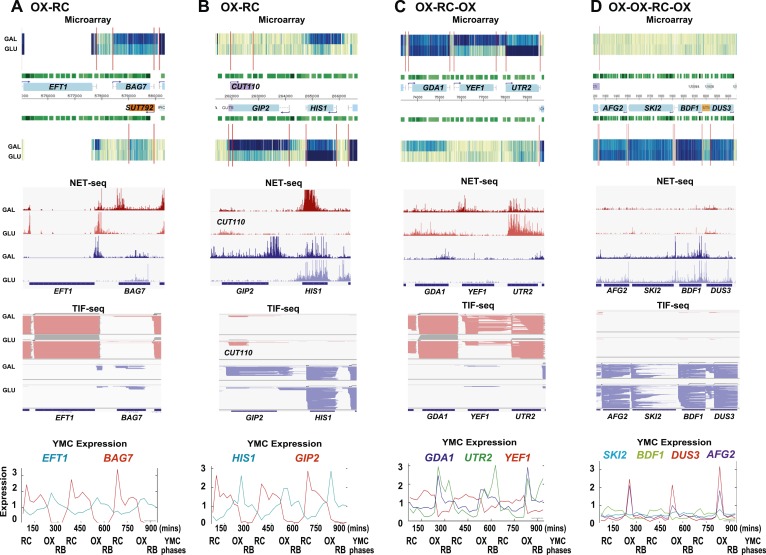
Figure 1—figure supplement 2. Exemplary tandem gene clusters and their regulation by carbon source and the YMC.

Figure 1—figure supplement 2.

Supplements 1A–D, 2A–D, 3A–C show examples of tandem gene clusters with reciprocal switching of transcription by carbon source, di-cistrons, and antisense transcripts. Supplements 3D and 4A–D show examples of tandem gene clusters that do not show reciprocal switching of transcription by carbon source. Gene clusters were selected from the analyses in Supplementary files 1F–J. Each panel shows the poly(A)+ RNA profile by microarray, NET-seq, TIF-seq, and YMC profile screenshots for the Watson strand (top) or the Crick strand (bottom). Transcription over intergenic regions and di-cistonic transcripts is common to both groups of clusters.
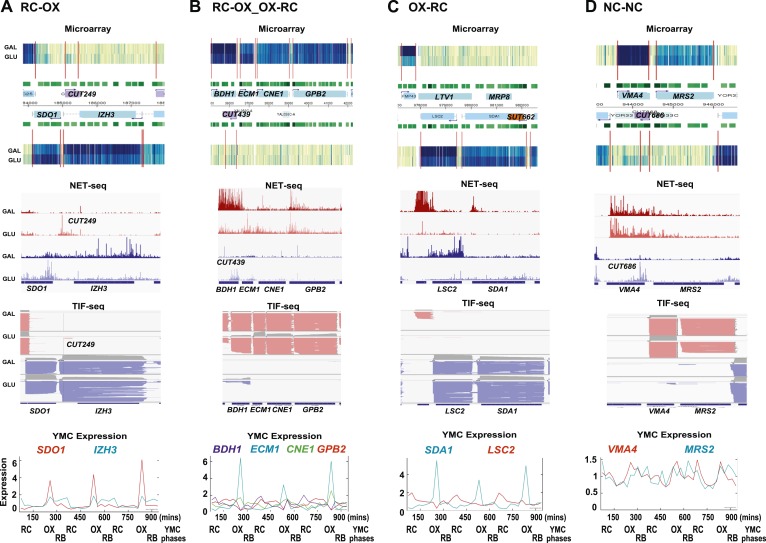
Figure 1—figure supplement 3. Exemplary tandem gene clusters and their regulation by carbon source and the YMC.

Figure 1—figure supplement 3.

Supplements 1A–D, 2A–D, 3A–C show examples of tandem gene clusters with reciprocal switching of transcription by carbon source, di-cistrons, and antisense transcripts. Supplements 3D and 4A–D show examples of tandem gene clusters that do not show reciprocal switching of transcription by carbon source. Gene clusters were selected from the analyses in Supplementary files 1F–J. Each panel shows the poly(A)+ RNA profile by microarray, NET-seq, TIF-seq, and YMC profile screenshots for the Watson strand (top) or the Crick strand (bottom). Transcription over intergenic regions and di-cistonic transcripts is common to both groups of clusters.
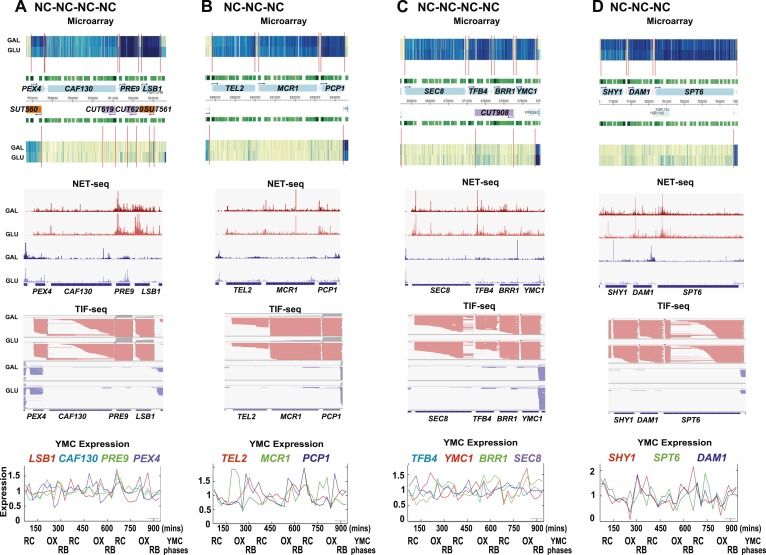
Figure 1—figure supplement 4. Exemplary tandem gene clusters and their regulation by carbon source and the YMC.

Figure 1—figure supplement 4.

Supplements 1A–D, 2A–D, 3A–C show examples of tandem gene clusters with reciprocal switching of transcription by carbon source, di-cistrons, and antisense transcripts. Supplements 3D and 4A–D show examples of tandem gene clusters that do not show reciprocal switching of transcription by carbon source. Gene clusters were selected from the analyses in Supplementary files 1F–J. Each panel shows the poly(A)+ RNA profile by microarray, NET-seq, TIF-seq, and YMC profile screenshots for the Watson strand (top) or the Crick strand (bottom). Transcription over intergenic regions and di-cistonic transcripts is common to both groups of clusters.