Abstract
Background and Objectives:
Breast cancer is a major threat to women's health. Evaluation of the changes in trend of the incidence rate provides valuable information for the assessment and planning of development indicators of each country. The aim of the present study was to apply the JoinPoint regression model for determining changes in the trend of the breast cancer incidence rate in Isfahan.
Materials and Methods:
In this cross-sectional study, 3640 women with breast cancer referring to oncology and radiotherapy departments of Seyed-al-Shohada and Milad cancer treatment centers of Isfahan during 2001–2010 were studied and sampling was not done. Joinpoint regression model was used to investigate the pattern of breast cancer incidence rate. Response and independent variables were the natural logarithm of the age-standardized incidence rates and year of diagnosis of breast cancer, respectively, in which various levels of cancer tumor characteristics (P < 0.05) were analyzed.
Results:
The incidence rates increased annually in the age groups of 40–44 years (6.2%), 45–49 years (5.3%), and 55–59 years (5.3%). The trend of incidence rates in women with tumor size ≤2 cm (18.2%), well (moderately) differentiated tumor grade [8% (10.2%)], positive estrogen (progesterone) hormone receptor status [10.5% (6.9%)], and the proportion of positive lymph node to surgery node ≤25% (nonsignificant) was upward.
Conclusion:
The trend of incidence rates with tumor size ≤2 cm, well-differentiated tumor grade, moderately differentiated tumor grade, and positive estrogen and progesterone hormone receptors was upward. The pattern of breast cancer can help in cancer prevention and prognosis, and in selecting the best type of surgery.
Keywords: Age, breast cancer, incidence, joinpoint regression, tumor characteristics
INTRODUCTION
Breast cancer is a chronic disease arising from a cell. Cancer cells grow too quickly and this growth continues to cause damage to healthy cells. The growth and abnormal proliferation are a result of the changes or mutations in the genetic material inside the cells.[1] Reproductive factors that increase the risk of breast cancer include: Having a long menstrual history, not having children, having one's first child after age 30, not having breastfed, being overweight or obese after menopause, use of postmenopausal hormone therapy, physical inactivity, and consumption of one or more alcoholic beverages per day.[2]
The incidence of breast cancer is the highest in the more developed regions of the world, in urban populations, and among White women. The Globocan database for 2002 indicates that the age-standardized rate of breast cancer incidence is 67.8 per 100,000 in more developed regions (Europe, Australia, New Zealand, North America, and Japan) compared to 23.8 per 100,000 in less developed regions (Africa, Central America, South America, all regions of Asia except Japan, the Caribbean, Melanesia, Micronesia, and Polynesia).[3] The highest incidence is reported to occur in North America (99.4 per 100,000) and the lowest in Asia (22.1) and Africa (23.4).[4] The worldwide age-standardized rate for mortality from breast cancer between 1993 and 2001 was 13.2 per 100,000, ranging from 8.8 in Asia to 19.7 in Europe.[3] The rate in more developed countries was 18.1 compared to 10.4 in less developed countries.[5]
The risk of developing breast cancer in women during their lifetime is 12.5% (1 case out of 8 cases) and the risk of death occurring from breast cancer is 3.6% (1 case out of 28 cases). About 10% of women in the United States suffer from breast cancer at some stage of their lives, and this type of cancer is the second leading cause of cancer-related deaths after lung cancer.[6] In Iran, breast cancer is highly prevalent. According to a latest report from the country, breast cancer is the third most common cancer in men and women. The highest incidence of breast cancer was reported to be among women of age between 40 and 49 years.[7] Breast cancer incidence in Iran is about 22 per 100,000 and its prevalence is 120 per 100,000 among women.[8] Isfahan ranks first in the country in cancer incidence, and breast cancer is the commonest cancer among women. Based on the statistics of 2004, about 10% of breast cancer cases in the country have been reported from Isfahan.[9]
Conducting research on the characteristics of cancer tumor is very important in order to prevent breast cancer and its recurrence and for prognosis at diagnosis. The overall risk of cancer is higher in old age because the person would have been exposed to more of carcinogens at that time.[10] The exact size of the tumor, spread of cancer cells to lymph nodes, and tumor grade at diagnosis play an important role for choosing the type of surgery and adjuvant therapy in patients.[8,11] Breast cells also contains estrogen and progesterone receptors. These receptors allow the breast tissue to change or grow against the hormone changes and, therefore, play an important role in the development and progression of breast cancer.[12] A study conducted in 2007 by Jemal et al. in which breast cancer trends were examined in 454,728 women of 45 years of age and above from the United States by age and tumor characteristics showed that there were two distinct patterns in breast cancer. The downturn in the incidence rates in all age groups above 45 years suggests a period effect that is consistent with saturation in screening mammography. This study also showed that the incidence rates decreased for small tumors (less than or equal to 2 cm).[13] A study conducted in 2007 by Hausauer et al. examining breast cancer trends in 161,800 Asian/Pacific Islander, Hispanic, and African-American women of age 20 years or older from the United States by hormone receptor status and tumor size showed that between 2001 and 2004, the incidence rates of invasive breast cancer in women of age 50 years or older declined appreciably in Asians/Pacific Islanders and Hispanics, but were stable in African-Americans. Rates of hormone receptor-negative tumors increased in African-Americans and Hispanics during 2001–2004. In Asian/Pacific Islander women, perceptible but statistically nonsignificant decreases were observed for hormone receptor-positive and small tumors only.[14] A study was conducted in 2007 by Kerlikowske et al. by examining breast cancer trends in a breast cancer screening mammography program for 603,411 screening mammography examinations performed on women aged 50–69 years. Of these women, 3238 were diagnosed with breast cancer within 12 months of a screening examination, and the rate of estrogen receptor (ER)-positive invasive cancer was stable until 2001 and then declined from 2001 to 2003. A small increase was observed in ER-negative disease in the first quarter of 2003.[15]
In 2008, Brinton et al. examined recent breast cancer trends among 387,231 women of all age groups from the United States by age and tumor characteristics and showed that the number of breast cancer cases was more among women who were younger than 39 years during 1992–2004. Also, despite the reduced use of hormone therapy, from 1999 to 2004, the age-standardized incidence rates in breast cancer were constant over the entire period - stratified by hormone receptors and the highest incidence rate was seen among 30–39 year old women. This study also showed that the highest incidence rate was for small tumors, high tumor grade, and negative lymph nodes.[16] A study conducted in 2010 by Marliac et al. who examined breast cancer trends in 192,39 French women showed that since 2003, the incidence of invasive breast cancer has decreased in women aged 50–74 years.[17] In 2010, Shin et al. examined breast cancer trends in 161,800 eastern and southeastern Asian women aged 20 years or older and showed that the incidence rates increased gradually in all countries. Incidence rates increased in Korea during the 10-year period in all age groups except the <70 year age group. The Philippines had the lowest APCs in most of the age groups. Women aged 50–69 years had higher APCs in most countries, but not in Japan, rural China, or the Philippines.[18]
A study conducted in 2011 by Renard et al. examining breast cancer trends in 82,508 women of age 35 years or older from Belgium by age groups showed that Belgium ranked first among all countries in Europe in the age-standardized incidence rate for all ages combined and in the 35–49 and 50–69 age groups. In Flemish Region, while quite a stable incidence rate was observed in the age group 35–49 years, two phases were distinguished in women aged 50–69 years: First, an increase from 1999 to 2003 and then, a sharp decrease from 2003 to 2006. In the oldest age group, a steady increase was observed over the whole period.[19] A study conducted in 2012 by Rusner et al. who examined age-adjusted breast cancer incidence rate in 63,250 women aged 50–69 years from Germany by age groups showed the age-standardized incidence rates in breast cancer were virtually constant over the entire period in all regions. No substantial changes occurred over time within the age-specific analyses.[20]
Determining disease incidence is an important component of any community's health plans. Being aware of the disease incidence pattern in each country could be important for national planning. Public health organizations believe that the process of reviewing or monitoring disease incidence, mortality, and social, behavioral, and health risk factors can impact on decrease of the incidence of adverse health events. Trend analysis of the observed incidence or prevalence rates provides valuable information for the assessment, planning, program evaluations, and development indicators for each country.[21]
The trend analysis of data can be performed by regression analysis, time series, and other statistical methods. To do this if the linear regression models or time-series model is used, (when the explanatory variable is the time), a model is obtained for all data. While many cases have a complex data, assuming a linear relationship between the independent variables and the dependent variable is unacceptable for them. In one of the modeling methods, the data are divided into several sections and a simple linear model is fitted for each section, so that the model is continuous over the entire data, while the simple linear regression model is often useful to describe general changes over time.[22]
In studying trend data such as the cancer incidence data, one is frequently concerned with detecting a change in the recent trend. The joinpoint regression model, which is composed of a few continuous linear phases, is often useful to describe changes in trend data. Thus, an appropriate statistical method is necessary to evaluate cancer incidence trends, so that we can estimate the joinpoints in different years and determine the speed and type of changes. In this model, in addition to evaluate the behavior of the response variable (breast cancer incidence rate) at different periods of explanatory variable (time), the behavior of response variable can be separately reviewed in characteristics of subjects in the different periods of explanatory variable.[23]
Joinpoint models have been used in many fields of statistical research such as generalized linear models, risk function, time series, nonparametric methods, and longitudinal studies. In 1961, Sprent used the least square method for estimating segmented regression parameters when the change points are assumed to be known;[24] in 1964, Robison applied maximum likelihood and conditional maximum likelihood methods for estimating the connected location two regression functions when there are N1 observations in the first segment and N2 observations in the second segment, assuming that the change points are known or unknown;[25] in 1996, Berman used nonlinear least squares method;[26] in 1980, Lerman proposed a grid search method to fit segmented regression curves;[27] in 1966, Hudson fitted segmented curves whose join points have to be estimated;[28] and in 2004, Kim and Fay proposed a procedure to compare two breast cancer incidence rates in two different genders and geographic regions using joinpoint linear regression model and least square method.[29]
This regression model is also used for the analysis of other diseases, in addition to using joinpoint regression model in breast cancer analysis. In several studies, joinpoint regression has been used, for example, to examine the trends in the incidence of treatment for diabetes-related end-stage renal disease in the United States from 1990 to 1996,[30] to examine the trends in hip fracture rates in Canada from 1985 to 2005,[31] to assess the effect of hepatitis B vaccine in decreasing the incidence of hepatitis B disease in Italy from 1985 to 2006,[32] to examine hepatitis C virus infection trends in Italy from 1996 to 2006,[33] to examine whether the low birth weight paradox existed in Brazil between 1995 and 2007,[34] to examine the trend of reduction in young male suicide cases in Scotland between 1980 and 2004,[35] and applying segmented regression model to analyze the trend of tuberculosis incidence rate in Iran between 1964 and 2008.[21]
The goals of trend analysis in cancer surveillance are to determine whether cancer incidence has increased or decreased over time and to assess the speed with which the increase or decrease has occurred. Changes in exposure to risk factors, the introduction of screening programs, and other interventions are effective in the rate or frequency of some cancers. In this regard, cancer registries have been established to collect data on cancer from different countries.[22] It is, therefore, important to evaluate time trends in breast cancer incidence by age and tumor characteristics. Women are an important part of society, and their health and the health of the population are connected. Due to the high prevalence of breast cancer in Iran and also among Iranian women compared to women in the developing countries and as they are affected by the disease for at least a decade earlier, determining the trend of breast cancer incidence rate by age and tumor characteristics in women aged 30–69 years and in Isfahan city from 2001 to 2010 by using joinpoint regression is very important.
MATERIALS AND METHODS
Study design, subjects, sampling strategy
This study was a cross-sectional one in which the subjects were patients with breast cancer and information from 2001 to 2010 was obtained from the records of patients in the radiotherapy and oncology departments of Isfahan University of Medical Sciences and the ultra specialized Milad Hospital. There were 3640 cases and sampling was not done. The information of these patients was entered in special forms that were designed by the Breast Cancer Research Centre and then were recorded in the medical records of patients.
Criteria for selection of subjects were age, gender (women of age from 30 to 69 years due to the high incidence of breast cancer in this group), and location (the city of Isfahan and its population were selected in the calculation of incidence rates). It is worth noting that the confidentiality of information in patients’ files was maintained and the information was just collected and analyzed for this study.
The main purpose of the study was to analyze the breast cancer incidence and the trend analysis of breast cancer data was described by the annual incidence. Direct standardization method was used to calculate the age-standardized incidence rates.[36] Statistical Yearbook of Isfahan province was used to estimate the population of women in the city of Isfahan. Population of Isfahan province using census of 2006 (also stratified by age in the 5-year groups) was selected as the standard population.
Study variables
Statistical variables included age, tumor size (less than or equal to 2 cm, 2.1–5 cm, and greater than 5 cm), tumor grade (well differentiated, poorly differentiated, and moderately differentiated), estrogen and progesterone hormone receptors (positive or negative), and the proportion of positive lymph nodes to lymph node surgery (less than or equal 25% vs. greater than to 25%).
Statistical analysis
Joinpoint regression model was used to investigate the pattern of breast cancer incidence rates. The response variable for the analysis of incidence was the natural logarithm of the age-standardized breast cancer incidence rates, and the independent variable was the diagnosis year of breast cancer from 2001 to 2010, stratified by confounding variables including age, tumor grade, tumor size, ER, PR, and proportion of positive lymph nodes to lymph node surgery which were analyzed. Joinpoint Regression Program (3.5.2)[37] and SPSS 18 were used to analyze the data. A statistically significant joinpoint was P < 0.05.
Theoretical joinpoint regression model
The joinpoint regression model, which is composed of a few continuous linear phases, is often useful to describe changes in trend data. Line segments are joined at points called change points or joinpoints.[38]
The joinpoint regression model for the observations {(x1, y1),···(Xn, yn)}, where X1≤ X2 ≤ ··· ≤ Xn represents the time variable and yi, i = 1, …, n are the response variables, can be written as:

where  In this model, the regression coefficients are represented by β, jth joinpoint is represented by τj, and jth segment of data is represented by Sj, where nj observed data points are into and defined as Sj={xi: τj-1 < xi ≤ τj}={xij-1+1,…,xij}, j = 1, 2, …, k + 1, and τk+1 = max (x), τ0= min (x), ik+1= n, i0=0.
  nj=n, and ij−ij-1 = nj. The numbers of estimated parameter are 2k + 1.[38] There are three major decisions in any joinpoint analysis: The form of the mean function, the location of the joinpoints given the number of joinpoints, and the optimal joinpoint model.[22] In this study, the response variable was age-standardized rate and not a count; therefore, normal distribution was employed noting the homogeneous and heteroscedastic variances.
In this model, the change points are assumed to be known and constant. The default value for the maximum number of Joinpoints depends on the number of data points; also, a Joinpoint cannot occur within a user-specified number of data points from the beginning or end of a series and there must be at least a user-specified number of data points between two Joinpoints.[37,38]. According to the graphical plot to obtain the incidence rates, the initial analysis of the data, and the 10-year period of study, it was clear that there is maximum one joinpoint for the data of the breast cancer incidence rates; so, considering one joinpoint, the results were analyzed.
The least square method (Hudson tests and Permutation tests) for fitting the regression model and estimating segmented regression parameters was used. Using the Monte Carlo Permutation technique with the number of 4499 permutations, the number and locations of the joinpoints, and the best model in breast cancer trend was selected.
Also, permutation test was used for comparing two joinpoint linear regression functions specifically to determine the identity and parallelism of the two functions allowing different intercepts.[39]
Because in Hudson's method, the joinpoints take any value within the observed data range, it provides a better fit than the other methods. The Hudson's method is more sensitive and has more power to discover the new trends that are missed by the other methods. Furthermore, the Hudson's method always provides a smaller sum square error, hence gives more accurate estimates of the regression coefficients and annual percent changes (APCs).[38]
In the permutation test procedure, the tests of the null hypothesis are sequentially conducted, so that there are the minimum joinpoints against the alternative of the maximum joinpoints until we reach a conclusion wherein the optimal joinpoints have the minimum sum of squares of residuals. In this method, the distribution of test statistic is not known, and to assess the statistical significance of the observed value, the corresponding probability is estimated. Also, to perform the complete enumeration of the permutation test, we would create n! permuted data sets. Since this will, in general, be too large a number, we take Monte Carlo samples from these n! data sets P-value of the permutation test.[39]
The APC and average annual percent change (AAPC) were proposed to summarize and compare the rates of changes that are not constant over a given time period of breast cancer incidence. The rate of change increases on average over the selected time period if the lower confidence limit of the AAPC is positive, or the rate of change decreases if the upper confidence limit of the AAPC is negative. To compare the AAPC from two different groups, we may employ a ratio statistic (μ1 +1)/(μ2 +1) where the subscripts μ1 and μ2 indicate APC of group 1 and group 2, respectively. So, the annual rate of change for group 1 is more rapid than for group 2 over the selected time period if μL>1 or, alternatively, the rate of annual change for group 1 is slower than for group 2 if μU<1.[40]
RESULTS
The information in the medical records of 3640 women aged 30–69 years with breast cancer was studied. The mean (standard deviation) of patients’ age was 47.9 (9.4) years. Tumor size in 11.1% of women was less than or equal to 2 cm; in 60% patients, it was 2.1–5 cm; and in 28.9% patients, it was greater than 5 cm. 18.7% of patients had well-differentiated tumor grade and 50.8% (30.4%) of tumors were moderately (poorly) differentiated.
Overall, 40.5% (41.1%) of patients had estrogen (progesterone) receptor negative and 59.5 (58.9) women had estrogen (progesterone) receptor positive cancer. Proportion of positive lymph nodes to lymph node surgery in 58.8% of patients was less than or equal than 25%, and in 41.2% patients, it was greater than 25% [Table 1].
Table 1.
Descriptive statistics of the studied variables
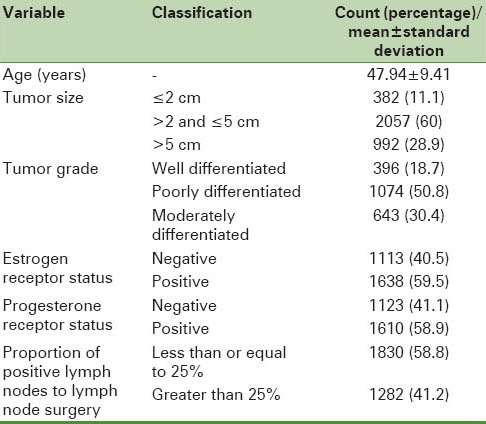
Table 2 shows the results of joinpoint trend analysis by age and tumor characteristics. The breast cancer incidence during the studied years increased annually by 4.1% [Figure 1]. The breast cancer incidence increased in the age groups of 40–44, 45–49, and 55–59 years. The AAPC in this time period for the above categories was 6.2%, 3.5%, and 5.3%, respectively. The highest increase in breast cancer incidence rate by tumor size was in the group with tumor size less than or equal to 2 cm (18.2%). Also, in 2006.7 [with Confidence Interval (CI) (2004, 2008)], a significant change in breast cancer incidence trend with tumor size greater than 5 cm was seen and joinpoint analysis in these two time periods indicated a significant annual increase rate during the first period and a significant annual decrease rate during the second period. The joinpoint analysis by tumor grade showed an increase in breast cancer incidence rates in the well-differentiated (8%) and moderately differentiated tumor grades (10.2%) than in poorly differentiated tumor grade (7.3%). In this trend, there was a significant change of moderately differentiated tumor grade in 2007.7 [with CI (2004, 2008)] and of well-differentiated tumor grade in 2007.8 [with CI (2005, 2008)]. The APC of age-standardized incidence rates in breast cancer in women with well-differentiated and moderately differentiated tumor grades increased by 14.7% for the first time period (2001–2008), while this rates declined by −11.5% for the second time period (2008–2010). The AAPC for the 5 recent years was calculated to be 0.8%. The APC of age-standardized incidence rates in breast cancer in women with well-differentiated and poorly differentiated tumor grades increased by 14.5% for the first time period (2001–2008), while this rate declined by −23.2% for the second time period (2008–2010). The AAPC for the 5 recent years was calculated to be −6.2%. The APC of age-standardized incidence rates in breast cancer in women with moderately differentiated and poorly differentiated tumor grades increased by 15.6% for the first time period (2001–2008), while this rate declined by −16.6% for the second time period (2008–2010). The AAPC for the 5 recent years was calculated as −7%. The estrogen-positive group had the highest breast cancer incidence rates (10.5%). Also, the progesterone-positive group had the highest breast cancer incidence rates (8.8%), and in 2003 [with CI (2003, 2007)], a significant change was seen. The AAPCs for the 5 and 10 recent years were calculated and found to be 6.9% and 11%, respectively. The less than or equal to 25% group of proportion of positive lymph nodes to lymph node surgery had the highest breast cancer incidence rates, although this increase was not statistically significant. The APC rates in female breast cancer incidence by positive lymph nodes to lymph node surgery were not different in the two groups.
Table 2.
Breast cancer incidence rates per 100,000 people and joinpoint regression analysis by age and tumor characteristics
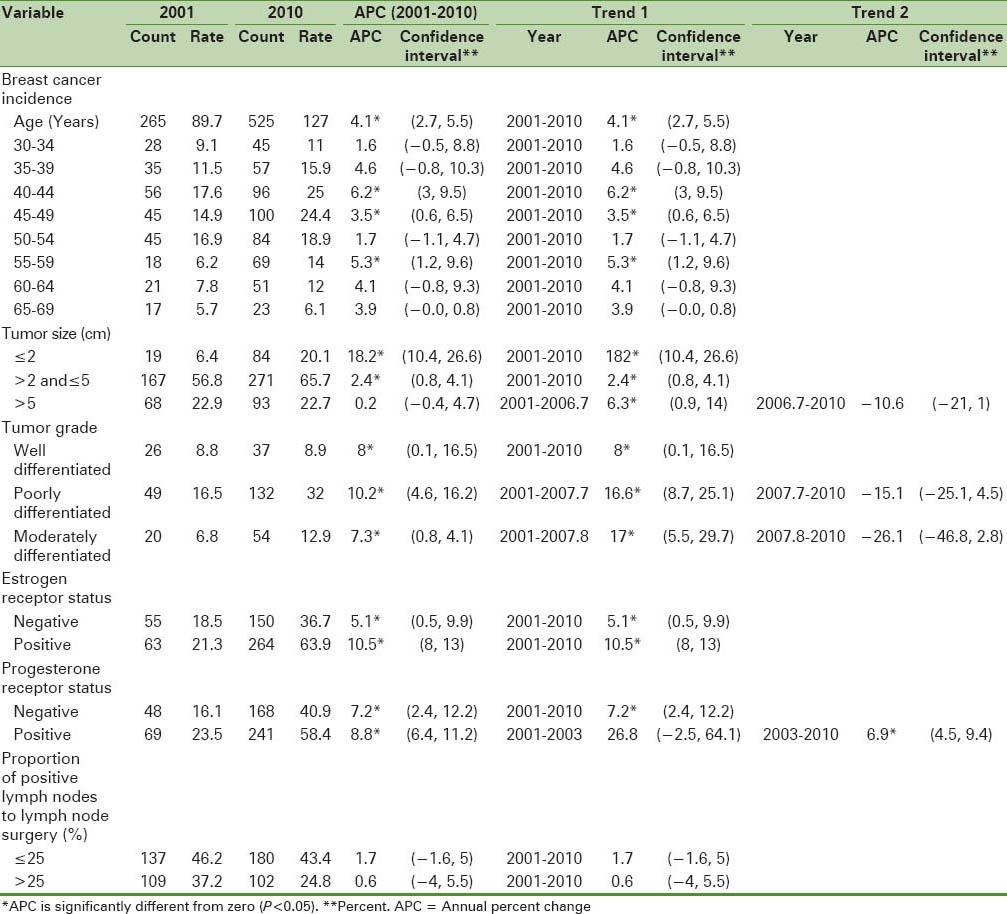
Figure 1.
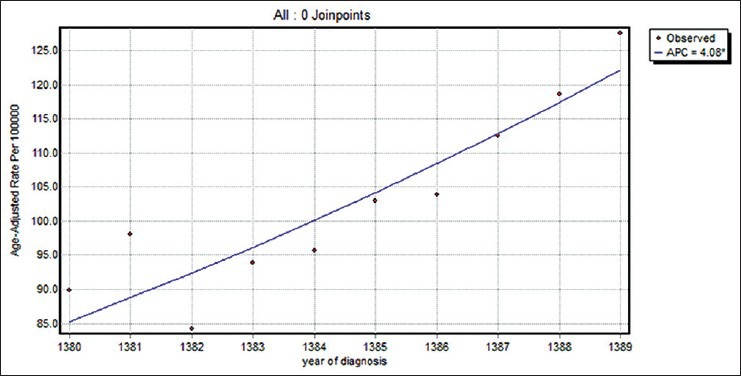
The changes in trend of breast cancer incidence rates in Isfahan city (2001–2010)
Table 3 shows the results of joinpoint trend analysis and comparability of AAPCs by age and tumor characteristics. In Table 3, by running the permutation comparability test for the breast cancer incidence rates in women aged 30–49 and 50–69 years, we observe that the APC rates were not different in the two groups. The APC rates between women with different tumor sizes were not different. Therefore, on average, the difference between APCs of breast cancer incidence rates in women with breast cancer with the tumor of size less than or equal to 2 cm in the last five years was faster than women with breast cancer with tumor of size the 2.1–5 cm (28%) and greater than 5 cm (39.7%). in addition, in recent 5 years difference between APCs of breast cancer incidence rates in the women with breast cancer with tumor size 2.1–5 cm was more quickly than women with breast cancer with the tumor of size 5 cm (11.7%). The APC rates in females with well-differentiated and moderately differentiated tumor grades were not different in the two groups and joinpoint regression mean response functions of the breast cancer age-standardized incidence rate in the two groups of women were [Figure 2]  respectively. The difference between these two functions of the average response was only in the intercepts. Table 4 shows that all the regression coefficients were significant. Also, there were no differences between the rates of AAPC in women with well-differentiated and poorly differentiated tumor grades and joinpoint regression mean response functions for the breast cancer age-standardized incidence rate in these two groups of women were [Figure 3]
  respectively. The difference between these two functions of the average response was only in the intercepts. Table 4 shows that all the regression coefficients were significant. Also, there was no difference between the rate of AAPC in women with well-differentiated and moderately differentiated tumor grade and joinpoint regression mean response functions for the breast cancer age-standardized incidence rate in these two groups of women were [Figure 4]
  respectively. It is seen from Table 3 that the APC rates between women with positive and negative ERs were not different. Also, the APC rates between women with positive and negative progesterone receptors were not different.
Table 3.
Joinpoint regression analysis and comparability of average annual percent changes by tumor characteristics
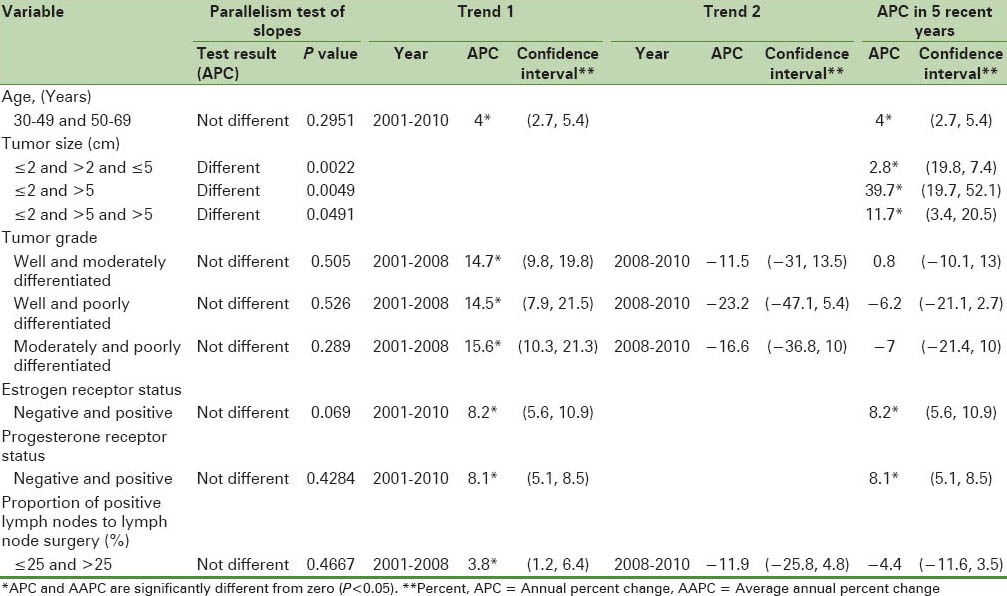
Figure 2.
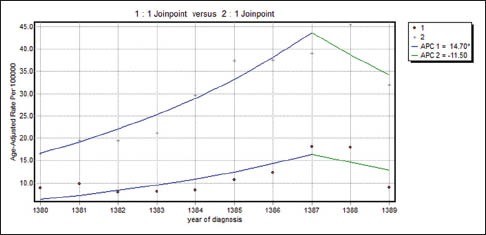
The changes in trend of breast cancer incidence rates in Isfahan city by well-differentiated and moderately differentiated tumor grade (2001–2010) (•: Well differentiated, +: Moderately differentiated
Table 4.
Estimated regression coefficients of comparability of average annual percent changes by age and tumor characteristics
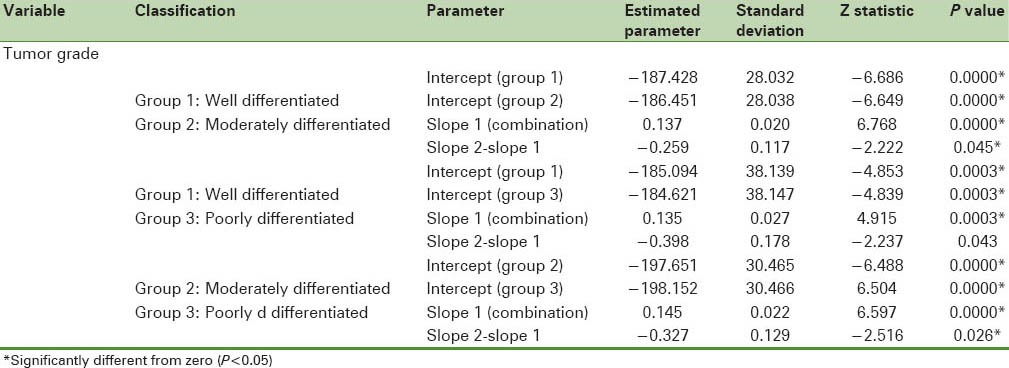
Figure 3.
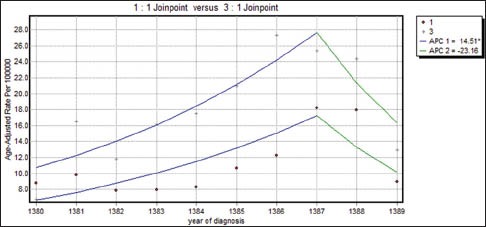
The changes in trend of breast cancer incidence rates in Isfahan city by well-differentiated and poorly differentiated tumor grade (2001–2010) (•: Well differentiated, +: Poorly differentiated
Figure 4.
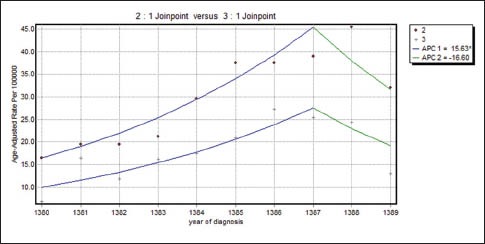
The changes in trend of breast cancer incidence rates in Isfahan city by moderately differentiated and poorly differentiated tumor grade (2001–2010) (•: Moderately differentiated, +: Poorly differentiated
DISCUSSION
Recent reports have documented sudden, unprecedented decline in the incidence of breast cancer, particularly for ER-positive tumors diagnosed in women 50 years and older. Substantial drop has been observed in the US, New Zealand, and Canada, but not in the Netherlands, Norway, and Sweden. In the populations reporting a decrease, gradual decline in the incidence began as early as 1999, but accelerated in 2002 after the early and widely publicized termination of the Women's Health Initiative.[41]
The study conducted by Jemal et al. in the United States showed that the largest percentage decrease occurred from 2002 to 2003 in women of age groups 55–59 years (11.3%), 60–64 years (10.6%), and 65–69 years (14.3%).[13] The study conducted by Marliac et al. in France showed an increase in the incidence rates in the 20–49 and ≥ 75 year age groups, with a mean annual increase of 1.6% and 0.9%, respectively. In the age group of 50–74 years, the incidence increased by 1.5% per year from 1990 to 1999 and by 6% per year from 1999 to 2003. From 2003, there was a 3.4% annual drop in incidence.[17] The study conducted by Renard et al. in Belgium showed a stable incidence rate in the age group of 35–49 years in Flemish Region, an increase from 1999 to 2003 (5.4%), and then a sharp decrease from 2003 to 2006 (−4%). In the oldest age group, a steady increase was observed over the whole period (1.5%).[19] The study conducted by Rusner et al. in Germany showed that the age-standardized incidence rates in breast cancer were virtually constant over the entire period in all regions. No substantial changes over time occurred within the age-specific analyses.[20] The study conducted by Brinton et al. in the United States showed that the highest incidence rate was found for small tumors, high tumor grade, and negative lymph nodes.[16] The study conducted by Shin et al. in eastern and southeastern Asian women above 20 years of age showed that the incidence rates increased gradually in all countries. Incidence rates increased in Korea during the 10-year period in all age groups except the <70 year age group. The Philippines had the lowest APCs in most age groups. Women aged 50–69 years had higher APCs in most countries, but not in Japan, rural China, or the Philippines.[18] Unfortunately, the incidence of breast cancer among the Iranian women occurs 10–15 years lower than in western countries and the highest incidence of breast cancer is in the age group of 40–49 years.[8]
Since the incidence rate of cancer in women 55 years or older is high and given the power of the immune system at this age is reducing, thus, the diagnosis of cancer in the lower age is of considerable importance. The results of this study showed that the breast cancer incidence rates increased in all age groups. The increase in incidence rates was found in the 40–44, 45–49, and 55–59 year age groups, with a mean annual increase of 6.2%, 3.5%, and 5.3%, respectively. The APC rates stratified by the two groups of 30–49 and 50–69 years were not different. The results of this study were consistent with the incidence in East Asia.
The study of Jemal et al. on the breast cancer incidence rates by progesterone receptor-positive status showed that the incidence rates significantly increased by approximately 2.9% per year from 1990 to 2000 and then dropped sharply by 9.1% between 2002 and 2003. In contrast, the incidence rates for ER-negative tumors significantly decreased by 1.2% per year from 1990 to 2003; however, from 2002 to 2003, the incidence rate for ER − tumors decreased by 6.9%.[13] The study of Kerlikowske et al. in the United States showed that between 2001 and 2003, the annual rates of ER-positive invasive breast cancer declined by 13% while these rates were stable until 2001. In the first quarter of 2003, a slight increase (not significant) was observed in patients with ER-negative tumors.[15]
The study of Hausauer et al. in the United States showed that between 2001 and 2004, the incidence rates of invasive breast cancer in women of age 50 years or older declined appreciably among Asians/Pacific Islanders (−8.5%) and Hispanics (−2.9%) and were stable in African-Americans. Rates of hormone receptor-negative tumors increased among African-Americans (26.1%) and Hispanics (26.9%) during 2001–2004.[14] Also, the study of Brinton et al. showed that despite the declining use of hormone therapy, from 1999 to 2004, the age-standardized incidence of breast cancer was stable in all the time intervals by hormone receptors and the highest incidence (21.7%) was observed at the age group of 30–39 years.[16]
Since about 60% breast cancer cases are ER positive and the roles of estrogen and progesterone cannot be separated in breast carcinogenesis, the prognosis of patients is very important in this regard. The results showed that the highest increase in the breast cancer incidence according to the estrogen and progesterone receptors status was in the positive receptor group; furthermore, a significant change was seen in 2003 in the breast cancer incidence with progesterone receptor positive status. The AAPC for 5 recent years (6.9%) and for 10 years (11%) was estimated. Comparison of the present results with the results of other similar studies on different groups (age, race, etc.) showed that from 2002 to 2003, this rate had a decreasing trend in the United States and had increased in the city of Isfahan.
Jamal et al.'s study on the trend analysis of breast cancer incidence rates by the tumor size confirmed a reduction in the cancer incidence for small tumors (≤2 cm).[13] Also, the study of Brinton et al. showed that the highest incidence rate by tumor size (21.2%) occurred in small tumors (≤2 cm).[16] The study of Hausauer et al. showed that in Asian/Pacific women, perceptible but statistically nonsignificant decreases were observed for hormone receptor-positive and small tumors only.[14]
Results of this study showed that the largest increase of breast cancer incidence was found in tumor size of less than or equal to 2 cm. on average, the difference between APCs of breast cancer incidence rates in women with breast cancer with the tumor of size less than or equal to 2 cm in the last five years was faster than women with breast cancer with tumor of size the 2.1–5 cm and greater than 5 cm, in addition, in recent 5 years difference between APCs of breast cancer incidence rates in the women with breast cancer with tumor size 2.1–5 cm was more quickly than women with breast cancer with the tumor of size 5 cm. This rate obtained in the city of Isfahan was similar to the results reported in other studies.
The study of Brinton et al. showed that the highest incidence rate by grade occurred in high-grade tumors (24.8 per 100,000).[16] The results of this study show increase in breast cancer incidence rates in well-differentiated and moderately differentiated tumor grades, indicating the role of exact size and differentiation of tumor cells in the diagnosis of breast cancer.
The study of Brinton et al. showed that the highest incidence rate by lymph node status occurred in negative lymph node (21.6).[16] Since the probability of relapse in patients with lymph nodes is 75% more than in others, the results of this study show that the highest increase in the incidence of breast cancer by the proportion of positive lymph nodes to lymph node surgery was in less than 25% group, although this increase was not significant.
Advantages and limitations of the study
The main strength of this study was that it aimed to introduce and implement an efficient and flexible statistical method called joinpoint regression that was used to determine the change points and trend pattern of the breast cancer incidence rates in different periods. In this model, in addition to assessment of the behavior of the response variable (the breast cancer incidence rate) in the different periods of explanatory variable (time), the behavior of the response variable also in terms of the characteristics of subjects in the different periods of explanatory variable can be surveyed separately.
The study had some limitations also. Due to lack of research analyzing the breast cancer incidence rates by some tumor characteristics (tumor grade and proportion of positive lymph nodes to lymph node surgery) using joinpoint regression in Iran and in other countries, we could not compare the results.
CONCLUSION
Evaluating the breast cancer incidence rates by age and tumor characteristics showed that the trend of incidence rates increased in women with less than or equal to 2 cm tumor size, well-differentiated or moderately differentiated tumor grades, and hormone receptor-positive tumors. Determination of the pattern of breast cancer trend by these characteristics can help to improve the patient's quality of life and long-term survival, prevent relapse of cancer, and in prognosis and choosing the best type of surgery and adjuvant therapy on diagnosis.
Footnotes
Source of Support: Article was drawn from the thesis of Ms. Zahra Fazeli dehkordi project number 391242 and has been passed on 14-06-2012.
Conflict of Interest: None declared
REFERENCES
- 1.Kaviani A, Ebrahimi M, Najafi M, Haghighat S, Majidzadeh K. 1th ed. Tehran: Ebtekar Danesh; 2010. Safari ba saratan be souye omid. [Google Scholar]
- 2.Key TJ, Verkasalo PK, Banks E. Epidemiology of breast cancer. Lancet Oncol. 2001;2:133–40. doi: 10.1016/S1470-2045(00)00254-0. [DOI] [PubMed] [Google Scholar]
- 3.Kamangar F, Dores GM, Anderson WF. Patterns of cancer incidence, mortality, and prevalence across five continents: Defining priorities to reduce cancer disparities in different geographic regions of the world. J Clin Oncol. 2006;24:2137–50. doi: 10.1200/JCO.2005.05.2308. [DOI] [PubMed] [Google Scholar]
- 4.Igene H. Global health inequalities and breast cancer: An impending public health problem for developing countries. Breast J. 2008;14:428–34. doi: 10.1111/j.1524-4741.2008.00618.x. [DOI] [PubMed] [Google Scholar]
- 5.Fregene A, Newman LA. Breast cancer in sub-Saharan Africa: How does it relate to breast cancer in African-American women? Cancer. 2005;103:1540–50. doi: 10.1002/cncr.20978. [DOI] [PubMed] [Google Scholar]
- 6.Saki A, Hajizadeh H, Tehranian N. Evaluating the risk factors of breast cancer using the analysis of tree models. Journal of Gonabad University of Medical Sciences. 2011;17:60–8. [Google Scholar]
- 7.Keihanian S, Ghaffari F, Fotokian Z, Shoorming R, Savari M. Risk factors of breast cancer in Ramsar and Tonekabon. Journal of Qazvin University of Medical Sciences. 2010;14:12–9. [Google Scholar]
- 8.Mousavi SM, Montazeri A, Mohagheghi MA, Jarrahi AM, Harirchi I, Najafi M, et al. Breast cancer in Iran: An epidemiological review. Breast J. 2007;13:383–91. doi: 10.1111/j.1524-4741.2007.00446.x. [DOI] [PubMed] [Google Scholar]
- 9.Faghani M, Nasiri E, Bahadori M, Mohammad Ghasemi F. Genetic predisposing of P53 codon 72 on developing of breast cancer in postmenopausal women in Isfahan. Journal of Guilan University of Medical Sciences. 2008;67:94–100. [Google Scholar]
- 10.Balducci L, Aapro M. Epidemiology of cancer and aging. Biological basis of geriatric oncology. Cancer Treatment and Research Boston: Springer. 2005:1–15. doi: 10.1007/0-387-23962-6_1. [DOI] [PubMed] [Google Scholar]
- 11.Schwartz S. Philadelphia: McGraw Hill; 2005. Principles of surgery. [Google Scholar]
- 12.Mylonas I, Makovitzky J, Jeschke U, Briese V, Friese K, Gerber B. Expression of Her2/neu, steroid receptors (ER and PR), Ki67 and p53 in invasive mammary ductal carcinoma associated with ductal carcinoma in situ (DCIS) versus invasive breast cancer alone. Anticancer Res. 2005;25:1719–23. [PubMed] [Google Scholar]
- 13.Jemal A, Ward E, Thun M. Recent trends in breast cancer incidence rates by age and tumor characteristics among US women. Breast Cancer Res. 2007;9:R28. doi: 10.1186/bcr1672. [DOI] [PMC free article] [PubMed] [Google Scholar]
- 14.Hausauer AK, Keegan T, Chang ET, Clarke CA. Recent breast cancer trends among Asian/Pacific Islander, Hispanic, and African-American women in the US: Changes by tumor subtype. Breast Cancer Res. 2007;9:R90. doi: 10.1186/bcr1839. [DOI] [PMC free article] [PubMed] [Google Scholar]
- 15.Kerlikowske K, Miglioretti DL, Buist DS, Walker R, Carney PA. Declines in invasive breast cancer and use of postmenopausal hormone therapy in a screening mammography population. J Natl Cancer Inst. 2007;99:1335–9. doi: 10.1093/jnci/djm111. [DOI] [PubMed] [Google Scholar]
- 16.Brinton LA, Sherman ME, Carreon JD, Anderson WF. Recent trends in breast cancer among younger women in the United States. J Natl Cancer Inst. 2008;100:1643–8. doi: 10.1093/jnci/djn344. [DOI] [PMC free article] [PubMed] [Google Scholar]
- 17.Daubisse-Marliac L, Delafosse P, Boitard J, Poncet F, Grosclaude P, Colonna M. Breast cancer incidence and time trend in France from 1990 to 2007: A population-based study from two French cancer registries. Ann Oncol. 2011;22:329–34. doi: 10.1093/annonc/mdq396. [DOI] [PubMed] [Google Scholar]
- 18.Shin HR, Joubert C, Boniol M, Hery C, Ahn SH, Won YJ, et al. Recent trends and patterns in breast cancer incidence among Eastern and Southeastern Asian women. Cancer Causes Control. 2010;21:1777–85. doi: 10.1007/s10552-010-9604-8. [DOI] [PubMed] [Google Scholar]
- 19.Renard F, Van Eycken L, Arbyn M. High Burden of Breast Cancer in Belgium: Recent trends in incidence (1999-2006) and historical trends in mortality (1954-2006) Arch Public Health. 2011;69:2. doi: 10.1186/0778-7367-69-2. [DOI] [PMC free article] [PubMed] [Google Scholar]
- 20.Rusner C, Bandemer-Greulich U, Engel J, Stegmaier C, Zawinell A, Holleczek B, et al. Population-based hormone receptor-specific incidence trends of breast cancer in Germany. Maturitas. 2012;73:152–7. doi: 10.1016/j.maturitas.2012.06.008. [DOI] [PubMed] [Google Scholar]
- 21.Arsang SH, Kazemnejad A, Amani F. Applying segmented regression model to analysis the trend of tuberculosis incidence rate in Iran between 1964 -2008. Iran J Epidemiology. 2011;7:6–12. [Google Scholar]
- 22.Jiang Z, Qiu Z, Hatcher J. Joinpoint Trend Analysis of Cancer Incidence and Mortality using Alberta Data. Canadian Partnership Against Cancer. Cancer. 2007:5–50. [Google Scholar]
- 23.Kim HJ, Yu B, Feuer EJ. Selecting the number of change-points in segmented line regression. Stat Sin. 2009;19:597–609. [PMC free article] [PubMed] [Google Scholar]
- 24.Sprent P. Some hypothesis concerning two phase regression lines. Int Biom Soc. 1961;17:634–45. [Google Scholar]
- 25.Robison DE. Estimates for the points of intersection of two polynomial regressions. J Am Stat Assoc. 1964;59:214–24. [Google Scholar]
- 26.Berman NG. Applications of segmented regression models for biomedical studies. Am J Physiol. 1996;270:723–73. doi: 10.1152/ajpendo.1996.270.4.E723. [DOI] [PubMed] [Google Scholar]
- 27.Lerman P. Fitting segmented regression models by grid search. Appl Stat. 1980;29:77–84. [Google Scholar]
- 28.Hudson DJ. Fitting segmented curves whose join points have to be estimated. J Am Stat Assoc. 1966;61:1097–129. [Google Scholar]
- 29.Kim HJ, Fay MP, Yu B, Barrett MJ, Feuer EJ. Comparability of segmented line regression models. Biometrics. 2004;60:1005–14. doi: 10.1111/j.0006-341X.2004.00256.x. [DOI] [PubMed] [Google Scholar]
- 30.Burrows NR, Li Y, Geiss LS. Incidence of treatment for end-stage renal disease among individuals with diabetes in the US continues to decline. Diabetes Care. 2010;33:73–7. doi: 10.2337/dc09-0343. [DOI] [PMC free article] [PubMed] [Google Scholar]
- 31.Leslie WD, O’Donnell S, Jean S, Lagacé C, Walsh P, Bancej C, et al. Trends in hip fracture rates in Canada. JAMA. 2009;302:883–9. doi: 10.1001/jama.2009.1231. [DOI] [PubMed] [Google Scholar]
- 32.La Torre G, Nicolotti N, De Waure C, Chiaradia G, Specchia ML, Mannocci A, et al. An assessment of the effect of hepatitis B vaccine in decreasing the amount of hepatitis B disease in Italy. Virol J. 2008;5:84. doi: 10.1186/1743-422X-5-84. [DOI] [PMC free article] [PubMed] [Google Scholar]
- 33.Torre GL, Gualano MR, Semyonov L, Nicolotti N, Ricciardi W, Boccia A. Hepatits C Virus infectin trends in Italy, 1996-2006. Hepat Mon. 2011;11:895–900. doi: 10.5812/kowsar.1735143X.767. [DOI] [PMC free article] [PubMed] [Google Scholar]
- 34.Silva AA, Silva LM, Barbieri MA, Bettiol H, Carvalho LM, Ribeiro VS, et al. The epidemiologic paradox of low birth weight in Brazil. Rev Saude Publica. 2010;44:767–75. doi: 10.1590/s0034-89102010005000033. [DOI] [PubMed] [Google Scholar]
- 35.Stark C, Stockton D, Henderson R. Reduction in young male suicide in Scotland. BMC Public Health. 2008;8:80. doi: 10.1186/1471-2458-8-80. [DOI] [PMC free article] [PubMed] [Google Scholar]
- 36.Moosavi M, Goya MM, Ramazani R, Davanlou M. Tehran, Iran: Ministry of Health, Deputy for Health Directory, CDC Cancer Office; 2006. Iran cancer report in 2005. [Google Scholar]
- 37.JoinPoint User's Guide. Surveillance Research. [Last accessed on 2011 Aug 3]. Available from: http://www.surveillance.cancer.gov/joinpoint/Joinpoint_UsersGuide_3.5.1.pdf .
- 38.Yu B, Barrett MJ, Kim HJ, Feuer EJ. Estimating joinpoints in continuous time scale for multiple change-point models. Comput Stat Data Anal. 2007;51:2420–7. [Google Scholar]
- 39.Kim HJ, Fay MP, Feuer EJ, Midthune DN. Permutation tests for joinpoint regression with applications to cancer rates. Stat Med. 2000;19:335–51. doi: 10.1002/(sici)1097-0258(20000215)19:3<335::aid-sim336>3.0.co;2-z. [DOI] [PubMed] [Google Scholar]
- 40.Clegg LX, Hankey BF, Tiwari R, Feuer EJ, Edwards BK. Estimating average annual per cent change in trend analysis. Stat Med. 2009;28:3670–82. doi: 10.1002/sim.3733. [DOI] [PMC free article] [PubMed] [Google Scholar]
- 41.Rossouw JE, Anderson GL, Prentice RL, LaCroix AZ, Kooperberg C, Stefanick ML, et al. Risks and benefits of estrogen plus progestin in healthy postmenopausal women: Principal results from the Women's Health Initiative randomized controlled trial. JAMA. 2002;288:321. doi: 10.1001/jama.288.3.321. [DOI] [PubMed] [Google Scholar]


