

Abstract
The European Neolithization process started around 12 000 years ago in the Near East. The introduction of agriculture spread north and west throughout Europe and a key question has been if this was brought about by migrating individuals, by an exchange of ideas or a by a mixture of these. The earliest farming evidence in Scandinavia is found within the Funnel Beaker Culture complex (Trichterbecherkultur, TRB) which represents the northernmost extension of Neolithic farmers in Europe. The TRB coexisted for almost a millennium with hunter–gatherers of the Pitted Ware Cultural complex (PWC). If migration was a substantial part of the Neolithization, even the northerly TRB community would display a closer genetic affinity to other farmer populations than to hunter–gatherer populations. We deep-sequenced the mitochondrial hypervariable region 1 from seven farmers (six TRB and one Battle Axe complex, BAC) and 13 hunter–gatherers (PWC) and authenticated the sequences using postmortem DNA damage patterns. A comparison with 124 previously published sequences from prehistoric Europe shows that the TRB individuals share a close affinity to Central European farmer populations, and that they are distinct from hunter–gatherer groups, including the geographically close and partially contemporary PWC that show a close affinity to the European Mesolithic hunter–gatherers.
Keywords: Neolithic, Funnel Beaker Culture, Pitted Ware Culture, Battle Axe Culture, ancient DNA, mtDNA
1. Introduction
The introduction of agriculture to human society brought major changes, as animal husbandry and cultivation of plants led to a more sedentary way of life [1] associated with increasing population sizes and density [2], and increasing social complexity [3]. This process, the Neolithization, started some 12 000 years ago in the Near East [4,5], after which it spread north and west throughout Europe. A long-standing question in European archaeology has been how these new practices spread. Did migrating people bring the new knowledge replacing the hunter–gatherer populations [6,7], or was the new lifestyle adopted by the Mesolithic hunter–gatherer communities through contacts with early farmers [8–10], or did the process vary in different regions [11]? According to the theoretical and ideological frameworks of the early-twentieth century, where changes in the material culture often were explained by demographic changes, the transition to the Neolithic lifestyle was first described as a revolution including a major migration wave [4]. However, further studies have shown that this process occurred along several different routes into and across Europe, at multiple time points [5,12,13].
The spread of Neolithic (farming) communities in the Northern parts of Europe seems to have taken place in phases, with one of the last being in Scandinavia. In Scandinavia, Northern Germany and Poland, archaeological evidence indicates that early farmers even lived side by side to hunter–gatherer groups [14,15]. These hunting groups appear to have adopted pottery, although not farming and animal husbandry practices. Furthermore, some of the hunter–gatherers (such as the Pitted Ware communities, PWCs) coexisted with farming communities for up to a millennium [16], indeed, sufficiently long that the PWC partly overlaps with two distinct agricultural complexes, the Funnel Beaker Culture (Trichterbecherkultur, TRB), and the Battle Axe complex (BAC) a variant of the Corded Ware Culture [17].
The earliest evidence of farming communities in southern Scandinavia is associated with the TRB culture, and dates to around 6000 BP [17]. In line with the different hypotheses regarding the spread of agriculture, some Scandinavian archaeologists have favoured the notion of Mesolithic populations as active adopters of new cultural elements, and that the different contemporary farming and hunting groups were the same people expressing different material culture at different sites [15,17–19]. However, the within Sweden geographically distinct TRB and PWC had different economies and different diets as indicated by stable isotope analyses [16,20]. Furthermore, recent genetic analyses have shed new light on the matter. Mitochondrial DNA (mtDNA) datasets generated on Mesolithic hunter–gatherers in Europe [21] and Neolithic PWC hunter–gatherers in Scandinavia [22] have high frequencies of haplogroups that are uncommon in many Neolithic farmer populations. Comparisons with modern populations also point to a population discontinuity between the Mesolithic/Neolithic hunter–gatherers and the modern populations [21–23]. The genetic background of Neolithic farmers in Europe shows a more complex picture [24], where haplogroup compositions in some regions are similar to extant European population frequencies [25,26], but in other cases, there is less support for direct continuity between early farmers and extant populations [27,28].
With the advent of high-throughput sequencing approaches, complete mitochondrial genomes have begun to appear for archaeological human remains. From Europe, data are available from nine Neolithic farmers [23,29,30], six Neolithic PWC hunter–gatherers [23,30], four Mesolithic hunter–gatherers [29–31] and the Tyrolean Iceman, a mummified body dated to the transition from the Neolithic to the Copper Age [32]. These techniques have also rendered possible the recovery of nuclear DNA data, from a range of archaeological materials [33–35]. However, nuclear data are still limited to small sample sizes, and mtDNA provides the opportunity to generate data from a larger number of individuals. The mtDNA variation of Mesolithic hunter–gatherers from central Europe and the last hunter–gatherers in Neolithic Scandinavia differ genetically from farmers across Europe (Linear Pottery Culture (Linearbandkeramik, LBK) and TRB) [22,23,29,36–38], and this is also evident in genome-wide analyses of the two distinct Scandinavian groups [23,30].
Taken together, these genetic data show that the farmer communities represent a different population that in many areas dramatically impacted local resident groups, possibly even replacing them. To what extent this holds for Scandinavia is still unclear as only a limited number of early farmers have been genetically analysed [22,23,30]. As Scandinavia is a region at the geographical margin of early farming communities, and contained coexisting farmers and late hunter–gatherer communities [17,20,39], it holds a unique position to further highlight this question. We can hypothesis that if the introduction of farming practices was mitigated by migration, then the TRB may be expected to share a closer genetic affinity to other farming populations in Europe than to the contemporaneous PWC hunter–gatherers.
Here, we investigate the dispersal of the farming communities into Europe during the Neolithic, with particular focus on northern areas, by analysing population data from one of the northernmost remote farming communities, the Scandinavian TRB. We deep-sequenced the mtDNA d-loop from Neolithic samples using a genome sequencer (GS) FLX platform, and used postmortem DNA damage patterns to authenticate clone sequences from 13 PWC hunter–gatherers and from seven farmers (six associated with TRB and one with BAC). This data were merged with 124 previously published mtDNA sequences from Neolithic farmers and Mesolithic and Neolithic hunter–gatherers, from three geographical locations (Scandinavia: [22], Central Europe: [21,27] and Iberia: [24–26,31]), and we investigated the genetic diversity between and within groups, as well as possible continuity between either of the Neolithic Scandinavian groups and extant Scandinavians [40].
2. Material and methods
(a). Material
The study presents genetic analyses of 49 Neolithic individuals recovered in different archaeological contexts in present-day Sweden. Ten samples originate from Megalithic passage graves; Gökhem (Frälsegården; n = 7) located in Västergötland, dated to 5500–4500 years cal BP, and Resmo (n = 3) located on the Baltic Sea Island of Öland, dated to 5600–4600 cal BP [16]. The burials are associated with the TRB culture and a Neolithic way of life that included farming and husbandry. However, on Öland, some of the people buried at the passage grave Resmo included a substantial amount of marine proteins in their diet [16].
The 37 hunter–gatherer individuals analysed originate from PWC contexts on two of the large islands in the Baltic Sea; Köpingsvik (n = 7) on Öland dated to 5200–4850 cal BP, and Ajvide (n = 4), Fridtorp (n = 5), Ire (n = 9) and Visby (n = 10) on Gotland, all dating to approximately 5000–4400 cal BP [41,42]. Two samples were from the mainland site Korsnäs (n = 2) in Sweden and they were dated to 5300–4590 cal BP [43].
The two samples representing the BAC burial, a Scandinavian variant of the Corded Ware complex, are from Linköping, Östergötland (Bergsgraven, grave 185). Bergsgraven is a well-preserved flat earth triple grave containing a male, a female and an infant [44]. The grave was radiocarbon dated to cal 4800–4100 BP. The association between the BAC and TRB and PWC remains not fully understood. The BAC is chronologically younger (4900–4200 BP) than the TRB, but it is contemporaneous with the late phase of the PWC. The BAC group has been viewed by some archaeologists as a continuation and/or a transformation of the TRB or more closely associated with the PWC [17,19,45]. Recent studies of stable isotopes indicate that the diet of BAC individuals was based on terrestrial proteins, thus, more closely resembling that of individuals in TRB context than individuals found in PWC contexts [46].
(b). DNA extraction, amplification, deep-sequencing and sorting
Bones and teeth from the 10 Neolithic samples from Öland (three TRB and seven PWC) were decontaminated, and DNA was extracted from duplicate samples at independent occasions under stringent clean conditions as in Malmström et al. [22]. The samples were extracted together with 48 non-Neolithic samples that are not included in this study and a total of 52 extraction blanks and 97 PCR blanks. Five short overlapping fragments and two nested fragments (between 85 and 127 bp including primers with unique 4 bp tags) of the mtDNA hypervariable region 1 (HVS1) were amplified, visualized on a gel, quantified, pooled at equimolar concentrations and deep-sequenced on a Roche genome sequencer FLX platform as in [22]. The samples were sequenced together with the non-Neolithic samples and with the sporadic negative controls that yielded bands on the gel. The FLX-generated ‘clone’ sequences were computationally sorted into one alignment file for each of the 14 amplicons based on their unique tags and the primer sequences as in Malmström et al. [47].
The data from the samples from Gotland, Västergötland and Östergötland were taken from a previous study in which the DNA had been extracted at two independent occasions, together with 109 extraction blanks (both non-human archaeological samples and mock extractions) and 16 PCR blanks, quantified with real-time PCR, amplified for the seven HVS1 fragments and deep-sequenced on a Roche genome sequencher FLX sequencer and bioinformatically sorted based on tags and primer sequences as in Malmström et al. [22,47]. In the earlier study, a conservative strategy was adopted to authenticate the sequence reads (all samples were required to contain at least 1000 template molecules, have support from two independent extractions, yield at least 20 ‘clone’ sequences from the independent DNA extracts and exhibit an inverse relationship between fragment length and DNA yield in qPCR analysis), and 22 of the samples were used for further analyses. Here, we reanalyse the raw sequence data from 39 of the samples (seven TRB, two BAC and 30 PWC) from which no sequence data were previously reported and, if possible, we improve the haplogroup resolution for the samples with unresolved haplogroup affiliation from the previously published sequences.
(c). Identification of ancient templates and consensus sequences
We used a statistical approach to identify authentic ancient sequence motifs in each amplicon in a similar way as in [47]. In short, the program Phylonet (Agnar Helgason 2010, unpublished data) uses the c-statistic [48] to investigate postmortem nucleotide damage pattern (cytosine deamination) in clone sequences to identify the original sequence that gave rise to a damaged template. The sequence motif among the GS FLX clones from each amplicon that was most probably authentic (with best Cmax-value and p < 0.05) was selected. The amplicon sequences (up to 14 per sample) were aligned in BioEdit to create 341 bp HVS1 consensus sequences. Possible discrepancies between replicate amplicons were manually checked using PhyloNet. All negative controls that yielded amplicon data were also investigated using PhyloNet.
(d). Analyses of sequence data
The haplogroup affinity of each consensus sequence was assessed with HaploGrep (http://haplogrep.uibk.ac.at [49]) and with PhyloTree Build 10 or 15 (http://www.phylotree.org [50]).
To investigate whether the Neolithic Scandinavian farmers are more likely to share ancestry with continental farmer populations or with resident hunter–gatherer populations, we merged our consensus sequences with previously published Mesolithic and Neolithic sequences from three different geographical areas. Thus, our data were analysed together with a set of previously published clone-based mtDNA sequences from Scandinavian Neolithic farmers (n = 3) and hunter–gatherers (n = 19) [22], Central European Neolithic farmers (n = 22) [27] and Mesolithic hunter–gatherers (n = 18) [21], and Iberian Neolithic farmers (n = 57) [24–26] and Mesolithic hunter–gatherers (n = 5) [24,31]. The sequences were aligned in BioEdit and after removing regions that were not present in all sequences 304 bp of HVS1 could be used for further analyses.
To investigate genetic differentiation between the six groups (farmers and hunter–gatherers from Scandinavia, Central Europe and Iberia, respectively), we computed FST between each pair of populations [51]. As the time differences between sequences also can give rise to a genetic differentiation, we used a temporal correction to the estimators which adjusts the differences between two sequences by the expected number of differences from the temporal separation [52]. In the case of FST, the mutation rate used for adjusting the number of differences does not affect the inferences. Because FST captures not only between population differentiation, but also within-group variation, and is thus highly sensitive to within-group genetic diversity, we also estimated the average between-group genetic differentiation by calculating pairwise mismatches. Here, each pairwise combination of sequences from the two groups was compared, and the average number of mismatches computed. Temporal correction and confidence intervals (CIs) were computed as above, assuming a mutation rate of 7.71 × 10⁻⁸ mutations per year and base pair in the 304 bp region we focused the analyses on. This mutation rate was obtained using the observed average divergence of 0.0688992 substitutions per base pair between 613 modern-day Scandinavians to a Neanderthal sequence from Vindija Cave and an assumed Neanderthal–modern human mtDNA divergence of 466 000 years [53]. The latter corresponds to 466 000 × 2 – 38 310 = 893 690 years of evolution taking the age of 38 310 years of the Neanderthal individual into account. We constructed neighbour joining trees using the ape R library [54] based on the average number of between-group mismatches both with and without temporal correction. To evaluate the within-group genetic diversity, we computed the average number of mismatches between two randomly chosen sequences within each population using the same temporal correction as above. For all these analyses, CIs were estimated using 1000 bootstrap replicates over samples.
To assess a maximum possible contribution from an ancient population (TRB or PWC) to a younger population (extant Scandinavians), we used a method that investigates whether a null model incorporating genetic drift and different levels of contribution is consistent with the data [55]. More specifically, the observed frequency differences of the monophyletic mitochondrial U and K clade were used to quantify the maximum level of contribution from TRB farmers as well as from PWC hunter–gatherers to extant Scandinavians (represented by extant Swedes in this case). This assessment is performed in a model-based framework that evaluates the maximum contribution that is consistent with the observed allele frequency change and different amounts of historical genetic drift. The model includes possible gene flow from an unknown ‘ghost’ population, see [55]. The ‘ghost’ population is unspecified in order to set up a conservative null-model as other groups than TRB and PWC probably contributed to the modern-day Scandinavian gene pool. We used an observed frequency of 60 haplogroup U and K in a sample of size 286 from extant Swedes [40]. One of nine TRB/BAC individuals and 25 of 32 PWC individuals carried the U or K mitochondrial type in the Neolithic samples. We used the age of the samples (in years BP; table 1) divided by 25 (the assumed generation time) to estimate the number of generations that separates the ancient groups and extant Scandinavians. An effective population size of between 2000 and 5000 was assumed for both ancient groups.
Table 1.
MtDNA haplogroup affiliation of new and previously published HVS1 sequences from Neolithic Scandinavian samples.
| sample | grave | site | locality calibrated | calibrated BP | culture | mtDNA aplogroup | polymorphisms | reference |
|---|---|---|---|---|---|---|---|---|
| Res1 | Ind 1, Mysinge | Resmo | Öland | 5300–4900 cal PB | TRB | n.dd | 16274A 16311C 16362C | this study |
| Res15 | Ind 15, Mysinge | Resmo | Öland | 4800–4400 cal BP | TRB | J1d5 | 16069T 16126C 16274A | This study |
| Res20 | Ind 20, Mysinge | Resmo | Öland | 4400–4150 cal BP | TRB | H/R | 16311C | This study |
| Ber2 | grave 185, the female | Linköping | Östergötland | 4800–4100 cal BP | BAC | N1a1a1a | 16147A 16172C 16223 T 16248T 16320T 16355T | this studya |
| Gok5 | Ind ID 124273 | Gökhem | Västergötland | c. 4900 | TRB | K1a5c | 16224C 16311C 16362C | this studya |
| Gok7 | Ind ID 130273 | Gökhem | Västergötland | 4800–4600 cal BP | TRB | H24c | 16293G | this studya |
| Gok2 | Ind ID 118449 | Gökhem | Västergötland | 5300–4850 cal BP | TRB | Hc | CRS | this studya |
| Ste9 | shattered | Gökhem | Västergötland | c. 4900 | TRB | J2b1a | 16069T 16126C 16193 T 16278T | [22] |
| Gok4 | Ind ID 122402 | Gökhem | Västergötland | 5100–4900 cal BP | TRB | Hc | CRS | [22] |
| Ste7 | shattered | Gökhem | Västergötland | c. 4900 | TRB | T2b | 16126C 16294 T 16304C | [22] |
| GE33 (KOP29) | Ind 1, tripple grave, | Köpingsvik | Öland | 5200–4850 cal BP | PWC | T2b | 16126C 16294 T 16296T 16304C | this study |
| GE44 (KOP32) | grave A5, Klinta | Köpingsvik | Öland | 5200–4850 cal BP | PWC | H1f | 16093C | this study |
| GE76 (KOP27) | Ind P, stray find | Köpingsvik | Öland | 5200–4850 cal BP | PWC | K1a1 | 16093C 16224C 16311C | this study |
| GE83 (KOP002) | grave A11, Solberga | Köpingsvik | Öland | 5200–4850 cal BP | PWC | U4a1 | 16134T | this study |
| Ajv4 | grave 4 | Ajvide | Gotland | 5000–4400 cal BP | PWC | U4 | 16093C 16356C | this studya |
| Fri24 | grave 24 | Fridtorp | Gotland | 5000–4400 cal BP | PWC | U4 | 16093C 16356C | this studya |
| Ire5 | grave 5 | Ire | Gotland | 5000–4400 cal BP | PWC | U4 | 16356C | this studya |
| Ire4 | grave 4 | Ire | Gotland | 5000–4400 cal BP | PWC | U4 | 16356C | this studya |
| Ajv29B | grave 29B | Ajvide | Gotland | 5000–4400 cal BP | PWC | HV0 | 16298C | this studya |
| Vis30B | grave 30B | Visby | Gotland | 5000–4400 cal BP | PWC | U5b1 | 16189C 16192 T 16270T 16362C | this studya |
| Fri28 | grave 28 | Fridtorp | Gotland | 5000–4400 cal BP | PWC | K1a1 | 16093C 16224C 16311C | this studya |
| Vis32 | grave 32 | Visby | Gotland | 5000–4400 cal BP | PWC | U5a | 16192T 16256 T 16270T | this studya |
| Vis7B | grave 7B | Visby | Gotland | 5000–4400 cal BP | PWC | K1a1 | 16093C 16224C 16311C | this studya |
| Ajv70 | grave 70 | Ajvide | Gotland | 5000–4400 cal BP | PWC | U4bc | 16093C 16356C | [22] |
| Ajv66 | grave 66 | Ajvide | Gotland | 5000–4400 cal BP | PWC | U4b | 16093C 16356C | [22] |
| Ajv52B | grave 52B | Ajvide | Gotland | 5000–4400 cal BP | PWC | U4b | 16093C 16356C | [22] |
| Ire8 | grave 8 | Ire | Gotland | 5000–4400 cal BP | PWC | U4b | 16093C 16356C | [22] |
| Ire9 | grave 9 | Ire | Gotland | 5000–4400 cal BP | PWC | K1a1 | 16093C 16224C 16242 T 16311C | [22] |
| Ire6B | grave 6B | Ire | Gotland | 5000–4400 cal BP | PWC | T2b | 16126C 16294 T 16296T 16304C | [22] |
| Ajv19 | grave 19 | Ajvide | Gotland | 5000–4400 cal BP | PWC | H/R | 16311C | [22] |
| Ajv14 | grave 14 | Ajvide | Gotland | 5000–4400 cal BP | PWC | H/R | 16311C | [22] |
| Ajv52A | grave 52A | Ajvide | Gotland | 5000–4400 cal BP | PWC | HV0c | 16298C | [22] |
| Fri15 | grave 15 | Fridtorp | Gotland | 5000–4400 cal BP | PWC | U4b | 16356C | [22] |
| Ajv13 | grave 13 | Ajvide | Gotland | 5000–4400 cal BP | PWC | U4b | 16260T 16356C | [22] |
| Ire3 | grave 3 | Ire | Gotland | 5000–4400 cal BP | PWC | U4b | 16356C | [22] |
| Fri22 | grave 22 | Fridtorp | Gotland | 5000–4400 cal BP | PWC | U4b | 16356C | [22] |
| Ajv54 | grave 54 | Ajvide | Gotland | 5000–4400 cal BP | PWC | U5 | 16270T | [22] |
| Ajv36 | grave 36 | Ajvide | Gotland | 5000–4400 cal BP | PWC | U5 | 16270T 16362C | [22] |
| Fri4 | grave 4 | Fridtorp | Gotland | 5000–4400 cal BP | PWC | U5 | 16270T | [22] |
| Ajv29A | grave 29A | Ajvide | Gotland | 5000–4400 cal BP | PWC | U5a | 16256T 16270T | [22] |
| Fri27 | grave 27 | Fridtorp | Gotland | 5000–4400 cal BP | PWC | U5a | 16256T 16270T | [22] |
| Ajv5 | grave 5 | Ajvide | Gotland | 5000–4400 cal BP | PWC | U5a | 16256T 16270T | [22] |
aExtracted, amplified and deep-sequenced in [22] although no sequence results was reported at that point. Here we reanalysed the raw sequence data using c-statistics and report sequence results for the first time.
bIncreased haplogroup resolution compared to previous determinations in [22].
dn.d., not determined.
3. Results
We retrieved HVS1 sequences for 20 of the 49 Neolithic individuals (six TRB, one BAC and 13 PWC; table 1 and figure 1) and we were also able to improve the haplogroup resolution for 10 PWC samples from a previous study [22]. Using the c-statistic to identify authentic sequence motifs among the FLX-generated clones within each amplicon, 204 of the 280 amplicons yielded significant c-scores (electronic supplementary material, table S1). A total of 45 polymorphisms were found within these samples, and 32 of these were supported by significant c-scores from at least two amplicons that were generated from independent DNA extracts. The majority of the polymorphisms that were only supported by one significant amplicon (11 of 13) were consistent with other well-supported polymorphisms and created consistent haplotypes (in Res15, Ajv4, Vis 30, Fri28, Vis7 and Ber2). In some cases, these motifs were also seen in the replicate amplicon with the best Cmax-value, although not reaching significance (electronic supplementary material, table S1). The one sample with significant sequence support from only one amplicon did not have any other polymorphisms in the sequence to help support the haplotype. The average number of amplicon sequences that yielded significant c-scores per individual sample was 10.4 of 14. We also used the c-statistic to investigate for possible contamination in the negative controls (electronic supplementary material, text). No full HVS1 sequence could be retrieved, because results in the controls were highly sporadic. In the rare cases when two or more sequences could be assigned to one control, they consisted of polymorphisms that were contradictory in terms of known haplogroups.
Figure 1.
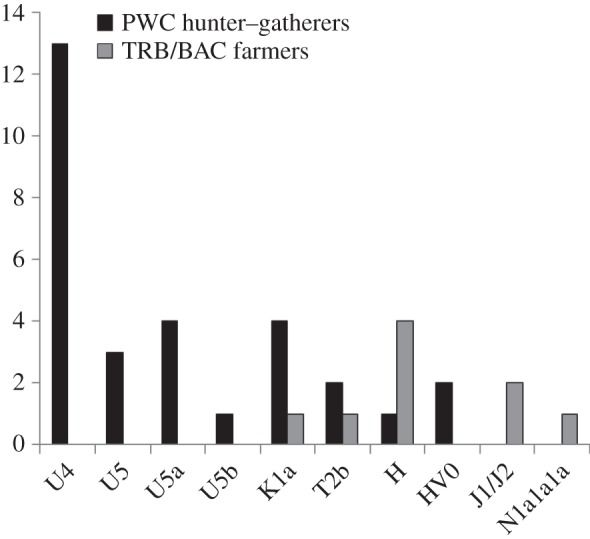
Number of observed HVS1 haplogroups in the Neolithic Scandinavian hunter–gatherers and farmers.
When investigating the haplogroup composition of the HVS1 consensus sequences, the only haplogroup found in more than one of the new TRB individuals was H (table 1 and figure 1). One individual displayed zero polymorphisms and two individuals displayed one polymorphism (either at np 16 293 or at np 16 311) relative to the reference sequence [56]. For the samples that only had the 16311C polymorphism, it is not possible to discriminate between the H- and the R-haplogroup. One TRB individuals carry haplogroup J1d5 and one K1a5. The BAC individual displayed the N1a1a1a haplogroup. It was not possible to assign the Res1 individual to a specific haplogroup based on the three polymorphisms in the sequence. The three previously published TRB individuals also displayed H and J haplogroups in addition to T2b (table 1 and figure 1). Seven of the 13 new PWC individuals carry a haplogroup not found in any of the TRB/BAC samples, haplogroup U (mainly subhaplogroup U4, U5a and U5b; table 1 and figure 1). Another haplogroup unique to PWC was HV0 which was found in one individual. Three PWC individuals shared the K1a1 haplogroup. One individual had the T2b haplogroup and differed from the TRB T2b that had a back mutation at np 16 296. The last of the new PWC individuals displayed a T-to-C transition at np 16 093 which could place the haplogroup within several subhaplogroups of H and R. The 19 previously published PWC individuals largely share the same haplogroups as the 13 new individuals and different subgroups of U are common (table 1 and figure 1). As the c-stretch between np 16 184–16 193 was removed in the previous study to avoid length heteroplasmy difficulties and pyrosequencing misreads, eight individuals could not be resolved between U4 and H1b. After analysing the sequence reads again with the help of the c-statistics, we now conclude that all eight samples belong to U4 (as they do not display the C back mutation at np 16 189 that would be required for H1b). In a similar fashion, the haplogroup of two individuals that were previously assigned to the haplogroup denoted ‘other’ in [22], can now be assigned to haplogroups H/R based on the 16311C polymorphism.
Pairwise FST-estimates show that Scandinavian farmers were most similar to Central European farmers (FST = −0.141 (95% CI: −0.280, −0.002); the negative FST-estimates suggest that there is no differentiation between these groups; figure 2). Both these groups were significantly differentiated from the third group of farmers analysed, the Iberian farmers (FST = 0.292 (95% CI: 0.083, 0.500) and FST = 0.306 (95% CI: 0.181, 0.431) for Scandinavian and Central European farmers, respectively). Note, however, that in the neighbour joining tree based on pairwise genetic divergence between groups, all three farmer groups form a joint cluster compared with all hunter–gatherers (figure 3). The Scandinavian farmers were also distinct from both Neolithic Scandinavian and Mesolithic Central European hunter–gatherers (FST = 0.206 (95% CI: 0.026, 0.385) and FST = 0.222 (95% CI: 0.0586, 0.386)). The small sample size for the Iberian hunter–gatherers hindered direct comparisons with this group. The Scandinavian as well as the Central European farmers display high within-group nucleotide diversity (π = 0.014 (95% CI: 0.008–0.019) and π = 0.016 (95% CI: 0.013–0.020); figure 4). In the neighbour joining tree (figure 3), we further show that the Neolithic PWC hunter–gatherers group with the Mesolithic hunter–gatherers of Central Europe and Iberia. Further, all hunter–gatherers show within-group homogeneity relative to the farmers of Scandinavia and Central Europe (π between 0.007 and 0.010; figure 4). Interestingly, the Iberian farmers show a similar within-group homogeneity as the hunter–gatherer groups, in contrast to the other farmers tested (figure 4).
Figure 2.

Pairwise FST estimates with temporal correction and confidence intervals. Black point is value between hunter–gatherer groups (excluding Iberian hunter–gatherers as there were only five samples), grey points are values between farmer groups and white points are values between groups with different subsistence patterns (hunter–gatherers and farmers). HG, hunter-gatherer.
Figure 3.
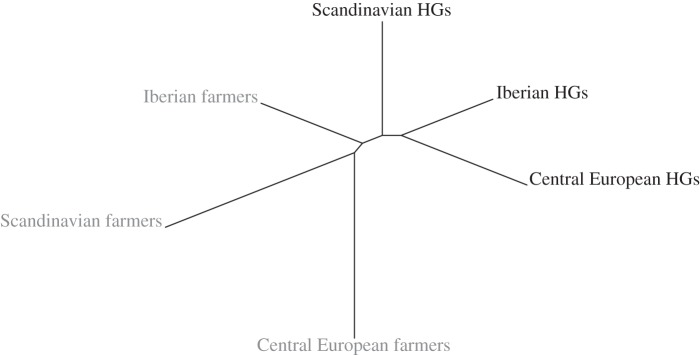
Neighbour joining tree of pairwise genetic differences (with temporal correction) between farmer and hunter–gatherer groups in Neolithic and Mesolithic Europe.
Figure 4.
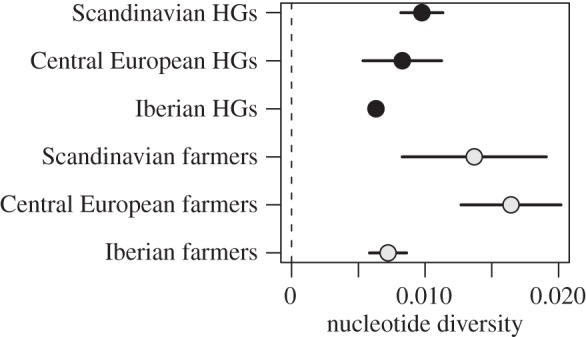
Nucleotide diversity (with temporal correction and confidence intervals (CI)) within each group (hunter–gatherers and farmers from Scandinavia, Central Europe and Iberia, respectively). Note that no CI could be determined for the Iberian hunter–gatherers owing to the small sample size.
We further compared extant Scandinavians to the Neolithic Scandinavian populations to investigate for possible continuity. To assess the maximum demographic contribution from Scandinavian Neolithic populations to extant Scandinavians, we used the following frequencies for the monophyletic U and K clade in our ancient samples: for PWC hunter–gatherers, 25 out of 32 individuals carry a U or K haplogroup, and for TRB/BAC farmers 1 out of 9 carry a U or K haplogroup (table 1). For the extreme upper bound (T = 0.096 units of time, i.e. the maximum number of generations divided by the minimum effective population size assuming 4800 years between the groups, a generation time of 25 years and a maximum effective population size of 2000 in the time between the sampled PWC population and present-day Scandinavians), we can reject a contribution greater than 60% from the PWC to the extant Scandinavian population (figure 5a). We could not reject any level of contribution from the ancient farmers to the extant Scandinavian population (figure 5b), suggesting that ancient farmers could have contributed substantially to extant Scandinavians.
Figure 5.

Continuity plots displaying the probability of the observed change in sample frequency of haplogroup U/K (p_con) under the null models of demographic contribution for the observed frequency difference between (a) PWC and modern Swedes, and (b) for TRB and modern Swedes, over time 0.032 ≤ T ≤ 0.096. The solid red lines represent the demographic contribution (from 0% to 100%) from the ancient population to modern Swedes. The dashed lines represent the rejection level (p_con = 0.05). (Online version in colour.)
4. Discussion
The understanding of postmortem damage in DNA, and how it applies to ancient DNA [57–59], has enabled the development of methods that statistically identifies ancient DNA sequences [48]. Using this methodology, we assessed the damage distribution within large amounts of ‘clone’ sequences generated by GS FLX-sequencing, in order to compile the sequences that have high probabilities of being ancient into mitochondrial HVS1 consensus sequences. We generated HVS1 sequences from 20 Neolithic farmers and hunter–gatherers from present-day Sweden (six from TRB, one from BAC and 13 from PWC contexts). The human remains came from two sample sets. The first set (the samples from Öland, n = 7) was generated for this study. The second set comprised ‘clones’ generated previously (the samples from Västergötland, Östergötland and Gotland, n = 13 [22]). Here, we analyse this second dataset in detail using the c-statistic framework and present the sequence data from these samples for the first time. With this method, we also improved the haplogroup resolution for 10 previously published PWC individuals [22]. We identified authentic sequence motifs in ‘clones’ from up to 14 amplicons per individual that derived from independent DNA extracts and retrieved coherent haplotypes. We also investigated sporadic human DNA contamination in negative controls. These typically displayed contradictory results and could not be used to generate complete HVS1 sequences (electronic supplementary material, text). These sequence data were analysed together with 124 mtDNA sequences from farmers (Neolithic), and hunter–gatherers (Neolithic and Mesolithic) from three geographical regions (Scandinavia, Central Europe and Iberia) [21,22,24–27,31].
Even though there was some overlap in haplogroup distribution between TRB and PWC (for haplogroups K, T and H), other haplogroups were unique to either TRB (J1d5 and J2b1a), BAC (N1a1a1a) or to PWC (U4, U4a1, U5, U5a and U5b1; table 1 and figure 1). The high frequency of U and K haplotypes in PWC individuals from both Gotland and Öland is in accordance with previous observations from human remains associated with PWC [22,23,30] and similar to a wide range of Mesolithic hunter–gatherers from Scandinavia, Central Europe, Iberia and Russia [21,29–31,60]. The U and K haplogroups are rare in Scandinavian TRB and Central European LBK farmers, but more common among individuals from the late Neolithic Treilles culture excavated in France, in Neolithic Iberian farmers and in Neolithic individuals from the Blätterhöhle cave in Germany [24–26,29,61]. The haplogroups seen in TRB (H, T, J and K) are also found in other farmer communities [27,29,38,61]. It has been hypothesized that communal Megalithic burials may represent specific individuals that are related to, or belong to, a certain strata of the community [12]. As eight distinct haplotypes were found among nine individuals from two different Megalithic burial structures, a close maternal kinship among several of the individuals can be ruled out. That these individuals represent more than a close family is further supported by isotopic studies (strontium, Sr) of migration patterns which have shown that as many as 25% of the buried in the megalithic burial structures were of non-local birth [62]. Interestingly, the BAC individual (N1a1a1a) did not share haplogroup affiliation with previously published Corded Ware associated individuals from Central Europe [63] but rather with individuals associated with LBK [64].
The Neolithic farmers analysed in this study differ significantly from the contemporaneous PWC hunter–gatherers, but show a close affinity to LBK individuals (figures 2 and 3). It has recently been shown not only that the TRB individuals investigated in this study, but also other Early and Middle Neolithic cultures in Central Europe, are genetically similar to the LBK [38]. Interestingly, both Scandinavian and Central European farmers are differentiated from the Iberian farmers (figure 2), however, mtDNA indicates that the population history in Iberia is complex during the Neolithic and that the haplogroup composition differ from that found in North/Central Europe as well as between different areas in Iberia [24]. It has further been suggested that the mode of the Neolithic expansion may have been different in geographically distinct regions [65], although alternative explanations could relate to continuity from Mesolithic populations or admixture with North African groups. However, even though the Iberian individuals span from the early to the late Neolithic, they are much more homogeneous than the other investigated farmer groups, which would contradict admixture (figure 4).
We show that the PWC hunter–gatherers of Neolithic Scandinavia do group with Mesolithic hunter–gatherers (figure 3). Our data further support genetic homogeneity of the hunter–gatherer complexes of Scandinavia and Central Europe (figure 4) which has been previously indicated [21,29–31]. However, the genetic picture of Mesolithic Europe is still incomplete, and open questions specifically related to Scandinavia include the relationship between PWC and the Ertebølle communities. In addition to their apparent mtDNA affinity to each other, the hunter–gatherer groups in both Scandinavia and Central Europe show significantly lower within-group mtDNA diversity than farmer groups in the same regions (figure 4). This could be a consequence of a number of previously hypothesized historical processes, such as reduction in the size of the ancestral hunter–gatherer population in the Late Pleistocene, long-term small effective population sizes in the small and probably dispersed hunter–gatherer bands, or a greater degree of admixture in migrating farming groups [66,67]. To what extent this reduced genetic diversity is also seen in the autosomal genome and the Y-chromosome is an interesting topic that will require further studies.
In a previous mitochondrial study, we found that the observed genetic differentiation between PWC and extant Scandinavians was inconsistent with complete population continuity [22]. To give a more precise upper bound of possible PWC ancestry in extant Scandinavians, we modelled extant Scandinavians as the result of gene flow between the PWC group and an unknown population. We found that the maximum direct demographic contribution consistent with the data is 60% (figure 5a,b). This is consistent with previous modelling of admixture proportions in Scandinavians using low-coverage genome-wide data [23,30]. However, note that we could not reject any level of contribution from TRB to extant Scandinavians, suggesting that our data are compatible with a scenario spanning from a complete replacement of the PWC to a scenario of admixture up to 60% from PWC into the population that eventually lead to modern-day Scandinavians.
To conclude, the observations that: (i) mtDNA of the farmers of the TRB community at the northern fringe of the Neolithic expansion closely resemble that of early Central European farmers, (ii) do not resemble contemporaneous PWC hunter–gatherers, but (iii) the mtDNA of these PWC hunter–gatherers' resemble the Mesolithic groups of continental Europe, suggest a key role for migration in association with in the Neolithization process. A more detailed and nuanced picture will no doubt be achieved by analysis of nuclear DNA and for a greater number of individuals from a larger timespan in the region and in other parts of western Eurasia.
Supplementary Material
Acknowledgements
The authors thank the staff at the Danish National High-Throughput DNA Sequencing Centre for assisting in the data generation. We also thank Agnar Helgason at deCODE Genetics in Iceland for letting us use the unpublished program PhyloNet version 5 and Karl-Göran Sjögren, Per Persson, Marietta Douglas and Leena Drenzel for providing samples.
Data accessibility
The Neolithic sequences (including sequences with increased haplogroup resolution compared with Malmström et al. [22]) have been deposited to GenBank (https://www.ncbi.nlm.nih.gov/genbank/) under the accession numbers KJ873248–KJ873275.
References
- 1.Bar Yosef O, Belfer-Cohen A. 1989. The origins of Sedentism and farming communities in the Levant. J. World Prehistory 3, 447–498. ( 10.1007/BF00975111) [DOI] [Google Scholar]
- 2.Armelagos GJ, Goodman AH, Jacobs KH. 1991. The origins of agriculture: population growth during a period of declining health. Popul. Environ. 13, 9–22. ( 10.1007/BF01256568) [DOI] [Google Scholar]
- 3.Schurr MR, Schoeninger MJ. 1995. Associations between agricultural intensification and social complexity: an example from the prehistoric Ohio valley. J. Anthropol. Archaeol. 14, 315–399. ( 10.1006/jaar.1995.1016) [DOI] [Google Scholar]
- 4.Childe VG. 1925. The dawn of European civilization In The history of civilization pre-history and antiquity (eds Paul K, Trench, Knopf AA.), p. xvi London, UK: Kegan Paul, Trench, Trubner & Co. [Google Scholar]
- 5.Whittle AWR, Cummings V, British Academy. 2007. Going over: the Mesolithic-Neolithic transition in north-west Europe In Proc. British Academy, p. xv Published for the British Academy by Oxford University Press, Oxford, UK. [Google Scholar]
- 6.Renfrew C. 1987. Archaeology and language: the puzzle of Indo-European origins. London, UK: J. Cape. [Google Scholar]
- 7.Barbujani G, Bertorelle G, Chikhi L. 1998. Evidence for Paleolithic and Neolithic gene flow in Europe. Am. J. Hum. Genet. 62, 488–492. ( 10.1086/301719) [DOI] [PMC free article] [PubMed] [Google Scholar]
- 8.Dennell R. 1983. European economic prehistory: a new approach. London, UK: Academic Press. [Google Scholar]
- 9.Barker G. 1985. Prehistoric farming in Europe. Cambridge, UK: Cambridge University Press. [Google Scholar]
- 10.Whittle AWR, Whittle AWR. 1996. Europe in the Neolithic: the creation of new worlds Cambridge world archaeology. Cambridge, UK: Cambridge University Press. [Google Scholar]
- 11.Zvelebil M. 2006. Mobility, contact, and exchange in the Baltic Sea basin 6000–2000 BC. J. Anthropol. Archaeol. 25, 178–192. ( 10.1016/j.jaa.2005.11.003) [DOI] [Google Scholar]
- 12.Midgley M. 2008. The Megaliths of Northern Europe. New York, NY: Routledge. [Google Scholar]
- 13.Tresset A, Vigne JD. 2011. Last hunter–gatherers and first farmers of Europe. C.R. Biol. 334, 182–189. ( 10.1016/j.crvi.2010.12.010) [DOI] [PubMed] [Google Scholar]
- 14.Price TD. 1991. The Mesolithic of Northern Europe. Annu. Rev. Anthropol. 20, 211–233. ( 10.1146/annurev.an.20.100191.001235) [DOI] [Google Scholar]
- 15.Hallgren F. 2008. Identitet i praktik: lokala, regionala och överregionala sociala sammanhang inom nordlig trattbägarkultur. Coast to Coast Books, vol. 17. Uppsala, Sweden: Department of Archaeology and Ancient History, Uppsala University. [Google Scholar]
- 16.Eriksson G, Linderholm A, Fornander E, Kanstrup M, Schoultz P, Olofsson H, Lidén K. 2008. Same island, different diet: cultural evolution of food practice on Öland, Sweden, from the Mesolithic to the Roman Period. J. Anthropol. Archaeol. 27, 520–543. ( 10.1016/j.jaa.2008.08.004) [DOI] [Google Scholar]
- 17.Malmer M. 2002. The Neolithic of south Sweden: TRB, GRK, and STR. Royal Swedish Academy of Letters History and Antiquities. Stockholm, Sweden: Almquist & Wiksell International. [Google Scholar]
- 18.Jennbert K. 1985. Neolithisation: a Scanian perspective. J. Danish Archaeol. 4, 196–198. [Google Scholar]
- 19.Carlsson A. 1998. Tolkande arkeologi och svensk forntidshistoria. Stenåldern. Stockholm Studies in Archaeology, vol 17 Stockholm, Sweden: Stockholm University. [Google Scholar]
- 20.Eriksson G, Lidén K. 2013. Dietary life histories in Stone Age Northern Europe. J. Anthropol. Archaeol. 32, 288–302. ( 10.1016/j.jaa.2012.01.002) [DOI] [Google Scholar]
- 21.Bramanti B, et al. 2009. Genetic discontinuity between local hunter–gatherers and central Europe's first farmers. Science 326, 137–140. ( 10.1126/science.1176869) [DOI] [PubMed] [Google Scholar]
- 22.Malmström H, et al. 2009. Ancient DNA reveals lack of continuity between Neolithic hunter–gatherers and contemporary Scandinavians. Curr. Biol. 19, 1758–1762. ( 10.1016/j.cub.2009.09.017) [DOI] [PubMed] [Google Scholar]
- 23.Skoglund P, Malmström H, Raghavan M, Storå J, Hall P, Willerslev E, Gilbert MTP, Götherström A, Jakobsson M. 2012. Origins and genetic legacy of Neolithic farmers and hunter–gatherers in Europe. Science 336, 466–469. ( 10.1126/science.1216304) [DOI] [PubMed] [Google Scholar]
- 24.Hervella M, Izagirre N, Alonso S, Fregel R, Alonso A, Cabrera VM, de la Rúa C. 2012. Ancient DNA from hunter–gatherer and farmer groups from Northern Spain supports a random dispersion model for the Neolithic expansion into Europe. PLoS ONE 7, e34417 ( 10.1371/journal.pone.0034417) [DOI] [PMC free article] [PubMed] [Google Scholar]
- 25.Lacan M, Keyser C, Ricaut F-X, Brucato N, Tarrus J, Bosch A, Guilaine J, Crubezy E, Ludes B. 2011. Ancient DNA suggests the leading role played by men in the Neolithic dissemination. Proc. Natl Acad. Sci. USA 108, 18 255–18 259. ( 10.1073/pnas.1113061108) [DOI] [PMC free article] [PubMed] [Google Scholar]
- 26.Sampietro ML, Lao O, Caramelli D, Lari M, Pou R, Marti M, Bertranpetit J, Lalueza-Fox C. 2007. Palaeogenetic evidence supports a dual model of Neolithic spreading into Europe. Proc. R. Soc. B 274, 2161–2167. ( 10.1098/rspb.2007.0465) [DOI] [PMC free article] [PubMed] [Google Scholar]
- 27.Haak W, et al. 2010. Ancient DNA from European early neolithic farmers reveals their near eastern affinities. PLoS Biol. 8, e1000536 ( 10.1371/journal.pbio.1000536) [DOI] [PMC free article] [PubMed] [Google Scholar]
- 28.Gamba C, et al. 2012. Ancient DNA from an Early Neolithic Iberian population supports a pioneer colonization by first farmers. Mol. Ecol. 21, 45–56. ( 10.1111/j.1365-294X.2011.05361.x) [DOI] [PubMed] [Google Scholar]
- 29.Bollongino R, Nehlich O, Richards MP, Orschiedt J, Thomas MG, Sell C, Fajkosova Z, Powell A, Burger J. 2013. 2000 years of parallel societies in Stone Age Central Europe. Science 342, 479–481. ( 10.1126/science.1245049) [DOI] [PubMed] [Google Scholar]
- 30.Skoglund P, et al. 2014. Genomic diversity and admixture differs for Stone-Age Scandinavian foragers and farmers. Science 344, 747–750. ( 10.1126/science.1253448) [DOI] [PubMed] [Google Scholar]
- 31.Sanchez-Quinto F, et al. 2012. Genomic affinities of two 7000-year-old Iberian hunter–gatherers. Curr. Biol. 22, 1494–1499. ( 10.1016/j.cub.2012.06.005) [DOI] [PubMed] [Google Scholar]
- 32.Ermini L, et al. 2008. Complete mitochondrial genome sequence of the Tyrolean Iceman. Curr. Biol. 18, 1687–1693. ( 10.1016/j.cub.2008.09.028) [DOI] [PubMed] [Google Scholar]
- 33.Noonan JP, et al. 2005. Genomic sequencing of Pleistocene cave bears. Science 309, 597–599. ( 10.1126/science.1113485) [DOI] [PubMed] [Google Scholar]
- 34.Green RE, et al. 2010. A draft sequence of the Neanderthal genome. Science 328, 710–722. ( 10.1126/science.1188021) [DOI] [PMC free article] [PubMed] [Google Scholar]
- 35.Orlando L, et al. 2013. Recalibrating Equus evolution using the genome sequence of an early Middle Pleistocene horse. Nature 499, 74–78. ( 10.1038/nature12323) [DOI] [PubMed] [Google Scholar]
- 36.Pinhasi R, Thomas MG, Hofreiter M, Currat M, Burger J. 2012. The genetic history of Europeans. Trends Genet. 28, 496–505. ( 10.1016/j.tig.2012.06.006) [DOI] [PubMed] [Google Scholar]
- 37.Fu Q, Rudan P, Pääbo S, Krause J. 2012. Complete mitochondrial genomes reveal Neolithic expansion into Europe. PLoS ONE 7, e32473 ( 10.1371/journal.pone.0032473) [DOI] [PMC free article] [PubMed] [Google Scholar]
- 38.Brandt G, et al. 2013. Ancient DNA reveals key stages in the formation of central European mitochondrial genetic diversity. Science 342, 257–261. ( 10.1126/science.1241844) [DOI] [PMC free article] [PubMed] [Google Scholar]
- 39.Storå J. 2001. Reading bones: Stone Age hunters and seals in the Baltic. Stockholm studies in archaeology, vol. 21 Stockholm, Sweden: Stockholm University. [Google Scholar]
- 40.Tillmar AO, Coble MD, Wallerström T, Holmlund G. 2010. Homogeneity in mitochondrial DNA control region sequences in Swedish subpopulations. Int. J. Legal Med. 124, 91–98. ( 10.1007/s00414-009-0354-7) [DOI] [PubMed] [Google Scholar]
- 41.Janzon GO. 1974. Gotlands Mellanneolitiska Gravar. Stockholm, Sweden: Almqvist & Wiksell. [Google Scholar]
- 42.Norderäng J. 2008. 14C-dateringar från Ajvide. Gotland University Press Monograph, vol 3 Visby, Sweden: Gotland University. [Google Scholar]
- 43.Fornander E, Eriksson G, Lidén K. 2008. Wild at heart: approaching Pitted Ware identity, economy and cosmology through stable isotopes in skeletal material from the Neolithic site Korsnäs in eastern central Sweden J. Anthropol. Archaeol. 27, 281–297. [Google Scholar]
- 44.Lindahl A, Gejvall NG. 1957. Dubbelgraven från stenåldern vid Bergsvägen i Linköping. Meddelanden vol. 1954–1955 Linköping, Sweden: Östergötlands och Linköpings stads museum; 5–34. [Google Scholar]
- 45.Malmer MP. 1962. Jungneolitische Studien. Lund, Sweden: Gleerup. [Google Scholar]
- 46.Fornander E. 2013. Dietary diversity and moderate mobility: isotope evidence from Scanian Battle Axe culture burials. J. Nord. Archaeol. Sci. 18, 13–29. [Google Scholar]
- 47.Malmström H, Vretemark M, Tillmar A, Durling MB, Skoglund P, Gilbert MTP, Willerslev E, Holmlund G, Götherström A. 2012. Finding the founder of Stockholm: a kinship study based on Y-chromosomal, autosomal and mitochondrial DNA. Ann. Anat. 194, 138–145. ( 10.1016/j.aanat.2011.03.014) [DOI] [PubMed] [Google Scholar]
- 48.Helgason A, et al. 2007. A statistical approach to identify ancient template DNA. J. Mol. Evol. 65, 92–102. ( 10.1007/s00239-006-0259-8) [DOI] [PubMed] [Google Scholar]
- 49.Kloss-Brandstätter A, Pacher D, Schönherr S, Weissensteiner H, Binna R, Specht G, Kronenberg F. 2011. HaploGrep: a fast and reliable algorithm for automatic classification of mitochondrial DNA haplogroups. Hum. Mutat. 32, 25–32. ( 10.1002/humu.21382) [DOI] [PubMed] [Google Scholar]
- 50.van Oven M, Kayser M. 2009. Updated comprehensive phylogenetic tree of global human mitochondrial DNA variation. Hum. Mutat. 30, E386–E394. ( 10.1002/humu.20921) [DOI] [PubMed] [Google Scholar]
- 51.Hudson RR, Slatkin M, Maddison WP. 1992. Estimation of levels of gene flow from DNA sequence data. Genetics 132, 583–589. [DOI] [PMC free article] [PubMed] [Google Scholar]
- 52.Depaulis F, Orlando L, Hänni C. 2009. Using classical population genetics tools with heterochroneous data: time matters! PLoS ONE 4, e5541 ( 10.1371/journal.pone.0005541) [DOI] [PMC free article] [PubMed] [Google Scholar]
- 53.Krause J, Fu Q, Good JM, Viola B, Shunkov MV, Derevianko AP, Pääbo S. 2010. The complete mitochondrial DNA genome of an unknown hominin from southern Siberia. Nature 464, 894–897. ( 10.1038/nature08976) [DOI] [PMC free article] [PubMed] [Google Scholar]
- 54.Paradis E, Claude J, Strimmer K. 2004. APE: analyses of phylogenetics and evolution in R language. Bioinformatics 20, 289–290. ( 10.1093/bioinformatics/btg412) [DOI] [PubMed] [Google Scholar]
- 55.Sjödin P, Skoglund P, Jakobsson M. 2014. Assessing the maximum contribution from ancient populations. Mol. Biol. Evol. 31, 1248–1260. ( 10.1093/molbev/msu059) [DOI] [PubMed] [Google Scholar]
- 56.Andrews RM, Kubacka I, Chinnery PF, Lightowlers RN, Turnbull DM, Howell N. 1999. Reanalysis and revision of the Cambridge reference sequence for human mitochondrial DNA. Nat. Genet. 23, 147 ( 10.1038/13779) [DOI] [PubMed] [Google Scholar]
- 57.Pääbo S. 1989. Ancient DNA: extraction, characterization, molecular cloning, and enzymatic amplification. Proc. Natl Acad. Sci. USA 86, 1939–1943. ( 10.1073/pnas.86.6.1939) [DOI] [PMC free article] [PubMed] [Google Scholar]
- 58.Hansen A, Willerslev E, Wiuf C, Mourier T, Arctander P. 2001. Statistical evidence for miscoding lesions in ancient DNA templates. Mol. Biol. Evol. 18, 262–265. ( 10.1093/oxfordjournals.molbev.a003800) [DOI] [PubMed] [Google Scholar]
- 59.Hofreiter M, Jaenicke V, Serre D, von Haeseler A, Pääbo S. 2001. DNA sequences from multiple amplifications reveal artifacts induced by cytosine deamination in ancient DNA. Nucleic Acids Res. 29, 4793–4799. ( 10.1093/nar/29.23.4793) [DOI] [PMC free article] [PubMed] [Google Scholar]
- 60.Der Sarkissian C, et al. 2013. Ancient DNA reveals prehistoric gene-flow from Siberia in the complex human population history of North East Europe. PLoS Genet. 9, e1003296 ( 10.1371/journal.pgen.1003296) [DOI] [PMC free article] [PubMed] [Google Scholar]
- 61.Lacan M, Keyser C, Ricaut F-X, Brucato N, Duranthon F, Guilaine J, Crubezy E, Ludes B. 2011. Ancient DNA reveals male diffusion through the Neolithic Mediterranean route. Proc. Natl Acad. Sci. USA 108, 9788–9791. ( 10.1073/pnas.1100723108) [DOI] [PMC free article] [PubMed] [Google Scholar]
- 62.Sjögren K-G, Price T, Ahlström T. 2009. Megaliths and mobility in south-western Sweden. Investigating relationships between a local society and its neighbours using strontium isotopes. J. Anthropol. Archaeol. 28, 85–191. ( 10.1016/j.jaa.2008.10.001) [DOI] [Google Scholar]
- 63.Haak W, et al. 2008. Ancient DNA, Strontium isotopes, and osteological analyses shed light on social and kinship organization of the Later Stone Age. Proc. Natl Acad. Sci. USA 105, 18 226–18 231. ( 10.1073/pnas.0807592105) [DOI] [PMC free article] [PubMed] [Google Scholar]
- 64.Haak W, et al. 2005. Ancient DNA from the first European farmers in 7500-year-old Neolithic sites. Science 310, 1016–1018. [DOI] [PubMed] [Google Scholar]
- 65.Lacan M, Keyser C, Crubézy E, Ludes B. 2013. Ancestry of modern Europeans: contributions of ancient DNA. Cell Mol. Life Sci. 70, 2473–2487. ( 10.1007/s00018-012-1180-5) [DOI] [PMC free article] [PubMed] [Google Scholar]
- 66.Currat M, Excoffier L. 2004. Modern humans did not admix with Neanderthals during their range expansion into Europe. PLoS Biol. 2, e421 ( 10.1371/journal.pbio.0020421) [DOI] [PMC free article] [PubMed] [Google Scholar]
- 67.Gamble C, Davies W, Pettitt P, Hazelwood L, Richards M. 2005. The Archaeological and genetic foundations of the European population during the late glacial: implications for ‘agricultural thinking’. Camb. Archaeol. J. 15, 193–223. ( 10.1017/S0959774305000107) [DOI] [Google Scholar]
Associated Data
This section collects any data citations, data availability statements, or supplementary materials included in this article.
Supplementary Materials
Data Availability Statement
The Neolithic sequences (including sequences with increased haplogroup resolution compared with Malmström et al. [22]) have been deposited to GenBank (https://www.ncbi.nlm.nih.gov/genbank/) under the accession numbers KJ873248–KJ873275.