Abstract
Knowledge of how the structure of nanoparticles and the interactions with biological cell membranes is important not only for understanding nanotoxicological effects on human, animal health and the environment, but also for better understanding of nanoparticle fabrication for biomedical applications. In this work, we use molecular modelling techniques, namely molecular dynamics (MD) simulations, to explore how polymer nanoparticles interact with 1-palmitoyl-2-oleoyl-sn-glycero-3-phosphocholine (POPC) lipid cell membranes. Two different polymers have been considered: 100 monomer units of polyethylene (approx. 2.83 kDa) and polystyrene (approx. 10.4 kDa), both of which have wide industrial applications. We found that, despite the polar lipid head groups acting as an effective barrier to prevent the nanoparticles from interacting with the membrane surface, irreversible adhesion can be initiated by insertion of dangling chain ends from the polymer into the hydrophobic interior of the membrane. In addition, alignment of chain segments from the polymers with that of hydrocarbon chains in the interior of the membrane facilitates the complete immersion of the nanoparticles into the cell membrane. These findings highlight the importance of the surface and the topological structures of the polymer particles that dictate the absorption behaviour into the membrane and, subsequently, induce the possible translocation into the cell.
Keywords: molecular dynamics, surface adhesion, cell membrane, polymer nanoparticle, polystyrene, polyethylene
1. Introduction
Nanoparticles' physical and chemical behaviour is often very different from those of bulk materials. Nanoparticles are now widely used in areas such as food sciences, materials sciences and common household applications. The specificity and functionality of nanoparticles can be engineered and they can be used in pharmaceuticals and medical sciences as nanomedicines, drug delivery agents and genetic therapeutic applications [1], with potential benefits for healthcare.
As nanoparticles are produced on industrial scales, it is important to investigate their toxicological effects upon human health and the environment. In addition, degradation of bulk materials in the environment, such as polymeric packaging materials, can occur to generate micro fragments or even individual polymer chains. Indeed, it is known that nanoparticles can easily be ingested and adsorbed into living organisms [2] and yet studies regarding their biocompatibility and cytotoxicity effects are still quite limited. Whilst extracellular effects of nanoparticles are significant, their adhesion and entry into cells bring greater potential of both desired and toxic effects. This can take place by endocytosis, direct diffusion or membrane disruption. Clearly, there is a pressing need to understand how nanoparticles interact and adhere to cell membranes, and the underlying factors and mechanisms by which nanoparticles are transferred into cells. Such knowledge would be important in the design of nanoparticles with surface morphologies that do not bring deleterious effects to living organisms, while still achieving their intended functions.
Although numerous experimental works have been carried out in the area of nanotoxicology, assessing information at atomic levels in living organisms is quite difficult owing to the limitation of experimental techniques [3] and complexity of the biological environment. The range of methods employed depends upon the nature of nanoparticles, and includes spectrometry, spectroscopy and imaging techniques such as magnetic resonance imaging, atomic force microscopy and fluorescence.
It is known that there are several intertwining factors that can contribute to the behaviour of adhesion, and subsequently adsorption, into cell membranes, including particle size, surface structure, chemical composition, whether or not in protein receptor media. For instance, it has been shown that change in surface morphology of nanoparticles, in terms of different distribution of identical chemical moieties, is sufficient to induce different behaviour by which they can enter the cell [4]. Even then, the nanoparticles themselves also pose some challenges, whereby manufacturing processes often produce mixtures of varying compositions and structural sizes, making toxicology assessment difficult to carry out.
This paper demonstrates the use of molecular dynamics (MD) as a complementary tool to investigate the adsorption behaviour of nanoparticles on cell membranes. Molecular simulation is able to isolate and investigate systematically specific factors that contribute to the behaviour of particle interactions with cell membranes, and the underlying atomistic mechanisms. Only recently have reliable molecular potential or force fields [5] become available. In addition, the advances in computational capability are now making it possible to model complex, multicomponent biological models in realistic physiological conditions. For this reason, there are few computational works to date that focus upon nanoparticle interactions with cell membranes. Those available include studies of permeation [6], transportation [7] and nanoinjection [8] of carbon nanoparticles in membrane models.
In this work, we have carried out a series of molecular simulations of polymer nanoparticles (PNs) on cell membranes, namely, polyethylene and polystyrene nanoparticle interactions with the 1-palmitoyl-2-oleoyl-sn-glycero-3-phosphocholine (POPC) lipid cell membrane. These polymers are produced in huge quantities annually and are found in abundance in industry, as well as the environment [9]. The POPC lipid membrane is present in eukaryotic cells and used in biophysical experiments [10]. Previously, simulations based on coarse-grain models have been carried out to investigate the tendency for polystyrene nanoparticles to permeate cell membranes, revealing that polymer particles with a diameter less than the membrane thickness are more readily adsorbed into the hydrocarbon interior of the lipid bilayers [11]. Other works [12] have shown that subsequent uptake of polystyrene nanoparticles can alter structural and mechanical properties of the cell membrane. In this work, the simulations are based on fully atomistic models and the aim is to investigate the initial stages of polymer adsorption behaviour and their underlying mechanistic details, rather than to explore the whole process of subsequent particle uptake by membranes. By referencing to a series of simulations, it is found that irreversible adhesion can be initiated by insertion of dangling chain ends from the polymer into the hydrophobic interior of the membrane. In addition, the side groups, as well as the nature of chain entanglements, can also influence the interaction with the membrane and subsequent uptake of the nanoparticles.
2. Simulation models and methods
Two types of PN are considered: (i) a single linear, self-entangled chain consisting of 100 monomer units, and (ii) an aggregate of four linear chains, each with 25 monomer units, also giving a total of 100 monomer units. The PNs have relative molecular masses of approximately 2.83 kDa for polyethylene and approximately 10.4 kDa for polystyrene. Nanoparticles are designated PN-1 and PN-2, where PN refers to the type of polymer nanoparticle: for polyethylene, PN = PE; for polystyrene, PN = PS. Both PN-1 and PN-2 are of similar overall size but chain topologies are different. PN-1 contains two chain ends, whereas PN-2 contains eight chain ends. For both PN-1 and PN-2 models, PS and PE showed identical initial chain topologies upon simply changing the aromatic ring side groups to hydrogen atoms. MD simulations were initially carried out to collapse the PN under vacuum and the subsequent globular structure was solvated with water molecules; a further 2 ns simulation was carried out at 400 K to unlock any high-energy conformations before cooling to 300 K and equilibration for a further 3 ns. This produced particles with a radius of gyration, Rg, of 12.7 ± 0.1 Å for PS and 8.7 ± 0.1 Å for PE. These nanoparticle sizes are much smaller than the thickness of the membrane.
The cell membrane, which consists of 131 POPC molecules, was independently set up and centred at the zero origin with the surface plane oriented along the x–y direction and the surface normal parallel to the z-direction. The ‘top’ and the ‘bottom’ membrane surfaces are therefore located at +z and –z, respectively. The cell membrane was fully solvated with water molecules and equilibrated at 1 atmosphere and 300 K. This gives a size of about 74 Å in the x- and y-directions, with 130 Å in the z-direction, and these dimensions define the size of the simulation box. Periodic boundary conditions were applied to simulate periodic surface replication at x- and y-directions and a gap of about 90 Å between the image membrane layers in the z-direction. After that, the equilibrated PNs were placed on the ‘top’ membrane surface and an MD sample run was carried out, maintaining the same pressure and temperature: the simulation box allowed isotropic changes in the x–y plane and independent scaling from the z-direction. More details about model set-up and simulation runs are described in the electronic supplementary material.
All MD simulations were carried out using the DL_POLY_4 software package [13]. DL_FIELD software [14] was used to set up the molecular system, with the all-atom CHARMM36 [15] as the force field model to describe the molecular system. The force field is found to be reasonably suitable in this study (see the electronic supplementary material). All results analyses were carried out using DL_ANALYSER [16], a general software tool for carrying out post analysis on MD trajectories produced by the DL_POLY package. The visualization and graphical outputs were generated using VMD [17].
3. Results
In general, the PE nanoparticles are easily adsorbed onto the membrane surface and subsequently can become completely immersed in the inner part of the membrane. In the case of PS nanoparticles, only some parts of the polymer chains were able to penetrate the hydrophobic region of the membrane. However, in some cases, the PNs were found to sit on the membrane surface and, during the course of the simulations, gradually diffused back into bulk solvent. No attempt has been made to estimate quantitatively the probability or the rate of such an occurrence. Depending upon the initial conditions such as PN orientations and thermal fluctuations, the retention time varies from several hundred picoseconds to 1–2 ns from the start of a simulation and in about 40 out of every five attempts the PNs diffuse back into bulk water.
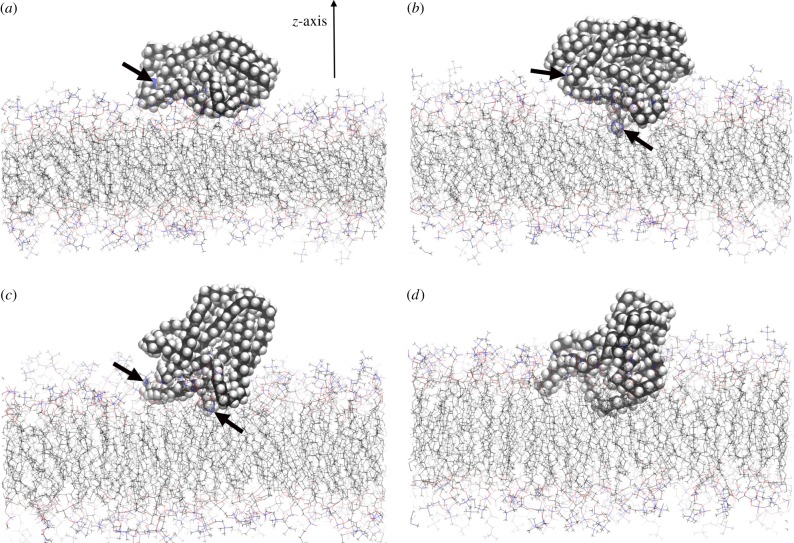
Figure 1a–d shows a typical sequence for the adsorption of PE nanoparticles, in this case, the PE-1 system. Initially, as shown in figure 1a, the PE-1 is adsorbed on the surface with the C–C chain segment orientations directed approximately along the x-axis. During the course of the simulation, the whole configuration remained unchanged apart from the motion resulting from thermal fluctuations. Depending upon the extent of the surface interactions, in this particular case, approximately 0.3 ns later, irreversible adsorption was initiated when one of the dangling chain ends from the PE-1 managed to penetrate the surface layer of the hydrophilic polar head groups and come into contact with the top portion of the hydrocarbon chains of the POPC membrane. This is illustrated in figure 1b. Note that the arrow indicates one of the terminal methyl carbons (also illustrated as a blue sphere) anchored in the hydrocarbon region of the membrane. Beyond this point, the PE-1 began to reorient as it entered the membrane, as shown in figure 1c at time 0.56 ns. Note that the terminal methyl group was still embedded in the membrane during this initial reorientation phase. At about 1.3 ns, almost a third of the PE-1 was immersed within the membrane (figure 1d). By 4.0 ns the nanoparticle was completely embedded and remained in the inner part of the membrane throughout the length of the simulation time. The PE-2 system also displayed similar adsorption behaviour.
Figure 1.
(a–d) Snapshots of the atomic configurations of PE-1 adsorped on the POPC membrane surface that subsequently lead to immersion of the nanoparticle within the membrane. Simulation time: (a) 0.0 ns, (b) 0.32 ns, (c) 0.56 ns and (d) 1.32 ns. All figures show the same orientation. The z-axis, which is normal to the membrane, is indicated in figure 1a, while thick arrows indicate the locations of the terminal methyl carbons (blue spheres). For figure 1d, the terminal carbon atoms were located behind the view. (Online version in colour.)
It was found that the PE nanoparticles in general had the tendency to reorient such that the chain segments were approximately aligned with those of the hydrocarbon chain segments from the POPC membrane, as shown in figure 1b. The chain segmental orientations are measured from the order parameter, Pz, which is the second order Legendre polynomial
| 3.1 |
The quantity θz is the angle between the z-axis (surface normal) and CH2–CH2 hydrocarbon chain segments. Figure 2 shows the order parameter difference, ΔP, with respect to time between the chain segment order parameter of POPC,  , and that of PN,
  , for both PE-1 and PE-2 systems
| 3.2 |
If it is an exact alignment, then ΔP = 0. It can be seen that the polymer segments reorientate while entering the membrane, with PE-1 being more aligned with the POPC hydrocarbon segments than PE-2. Interestingly, from around 4 ns onwards when the PNs are completely immersed, the graphs for Rg from figure 2 show a significant expansion of PE-2, while PE-1 remains essentially unchanged. Even then, the adsorbed PE-1 is still slightly more expanded when compared with the isolated PE-1 in water: Rg = 9.0 ± 0.2 Å for the former and 8.7 ± 0.1 Å for the latter. This indicates that different chain topology can result in different structural changes when PNs are embedded in the membrane.
Figure 2.
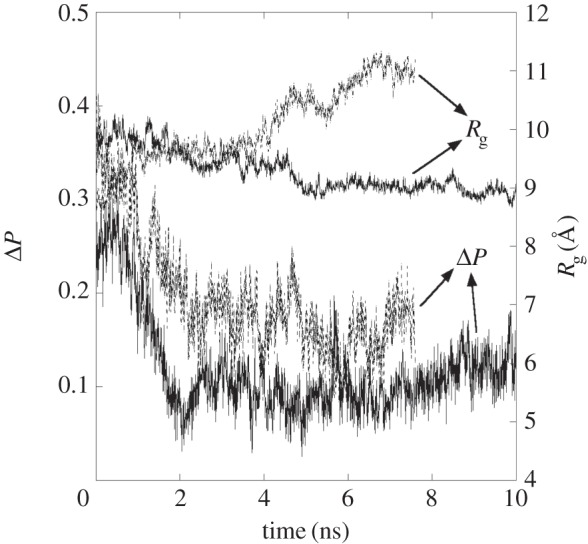
Double y-axis plot of the order parameter difference, ΔP (left scale) and radius of gyration (right scale) of polyethylene nanoparticles with respect to time. The solid lines represent the PE-1 system, while the dotted lines represent the PE-2 system.
In order to determine the average overall structural extension of the systems, figure 3 shows the density profiles along the z-direction of various molecular components for both PE-1 and PE-2 molecular systems. The density averages were sampled and normalized from 4 ns onwards when the PNs were embedded within the POPC membrane. The membrane surface located at the +z direction is designated the ‘top’ surface where the PNs were initially placed. The two vertical lines located at about z = ±15.0 Å indicate the average locations of the phosphate polar head groups that broadly define the membrane surfaces. The water density profile naturally falls on approaching the lipid membrane and becomes zero in the inner hydrophobic region. There is a slight broadening of the curve near the regions where the head groups are located owing to strong interactions between the water molecules and the polar phosphate groups which result in slightly higher water density around these regions.
Figure 3.
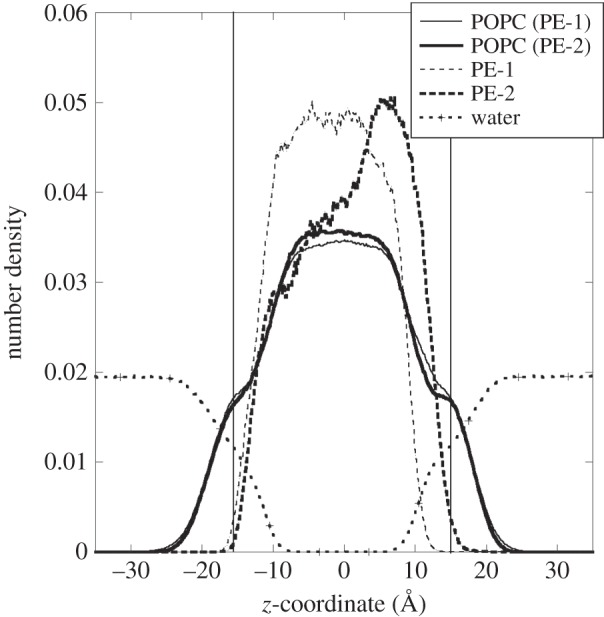
Number density profile along the z-direction of various molecular components for PE-1 (thin lines) and PE-2 (bold lines) molecular systems. The two vertical lines indicate the average positions of the POPC phosphate groups.
Figure 3 clearly shows that PE-1 and PE-2 have very different overall spatial extensions within the membrane. In the case of PE-1, the nanoparticle is almost confined to the hydrophobic region, tending towards the ‘bottom’ surface. Consequently, there is a slight reduction of POPC density in the inner part (around z = 0) of the membrane because of the presence of PE-1. Some of the displaced POPC molecules are pushed towards the ‘top’ surface and this results in a slight distortion of the POPC density profile in the region +10 Å < z < +15 Å. In the case of PE-2, the nanoparticle occupies a much broader region in the membrane, although most of the polymeric materials are still located at the hydrophobic region near to the ‘top’ membrane surface. Such a large extension of the structure may indicate a dissolution process takes place as the PE-2 is immersed in the membrane.
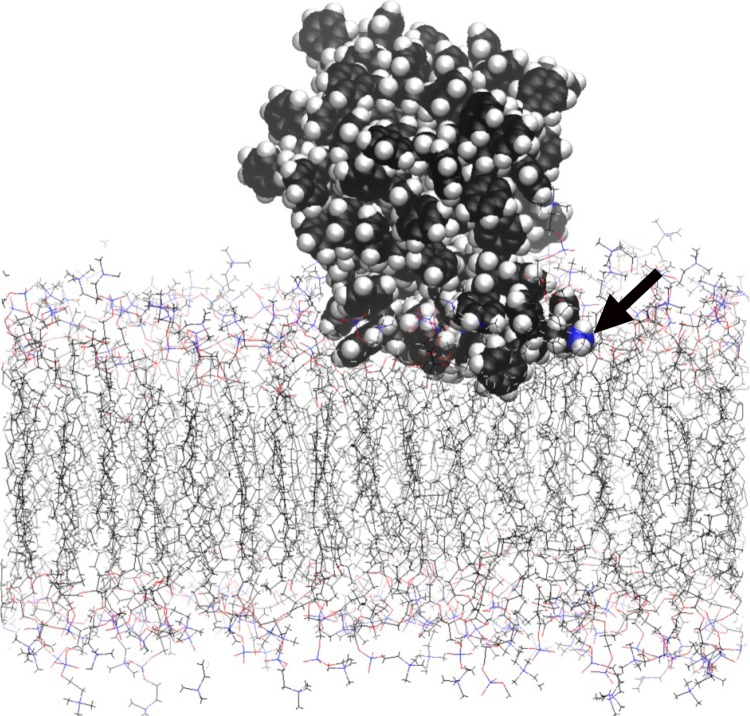
PS nanoparticles are more likely to diffuse back to bulk water than PE nanoparticles, a conclusion reached qualitatively by having a larger number of attempts to start new simulations, each with a different PS orientation with respect to the membrane surface. Nevertheless, similarly to PE, PS nanoparticles can also adsorb irreversibly onto the membrane surface, a process initiated by anchoring of a dangling chain end into the inner hydrophobic region. Figure 4 shows the density profiles for both PS-1 and PS-2 molecular systems. Once again, the profiles were obtained by averaging the samples from 4 ns onwards. The vertical lines show the average positions of the phosphate head groups. Unlike PE nanoparticles, PS nanoparticles were attached to the surface throughout the simulation (up to 20 ns) with only some parts of the polymeric materials lodged within the membrane. Figure 5 shows the final atomic configuration of the PS-2 adsorbed on the membrane surface. The adsorption was initiated by the insertion of one of the chain ends, as indicated by the arrow. The density profile of PS-2 shows a slightly larger penetration depth into the membrane than that of PS-1. This may be due to the fact that the PS-2, which consists of an aggregate of several shorter chain units and more free ends, is less entangled and therefore has greater freedom to make contact with the membrane molecules.
Figure 4.
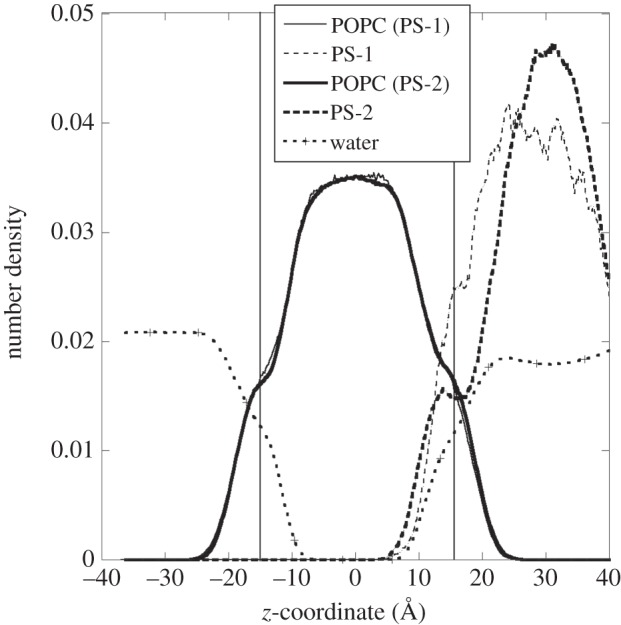
Number density profile along the z-direction of various molecular components for PS-1 (thin lines) and PS-2 (bold lines) molecular systems. The two vertical lines indicate the average positions of the POPC phosphate groups.
Figure 5.
Final atomic configuration at the simulation time of 20 ns, showing the adsorption of PS-2 particle on the POPC membrane. The thick arrow indicates the location of one of the terminal methyl carbons (blue sphere). (Online version in colour.)
4. Discussion
Interactions of molecularly smooth interfaces have been widely investigated in the past [18]. Surface adhesion in the continuum scales can be described by the well-tested JKR theory [19], which is a huge improvement over the classical Hertzian expression [18]. Continuum theory assumes the surface interaction is only confined to the contact junction, which is described by a single parameter, the work of adhesion. However, the nature of surface adhesion at nanoscales depends critically on individual atomic interactions that can extend significantly beyond the contact region. Computer modelling of crystalline solids shows a rich variety of nano-contact phenomena, such as elastic and plastic deformations, wear, and instability ‘jumps’ [20]. However, unlike crystalline solids, surface interactions between cell membranes and PNs cannot be easily characterized. This is because of the inherently complex nature of surface flexibility and permeability that is commonly found in biological soft condensed matter. In addition, the water molecules also play a more complex role, depending on the chemical nature of the surface substrate.
The POPC cell membrane is a phospholipid and the molecule consists of a hydrophilic phosphate polar head and two hydrophobic hydrocarbon tails. The cell membrane is a bilayer, in which the POPC molecules are arranged in tail-to-tail fashion with the hydrocarbon tails forming the interior of the membrane and the polar head groups forming the surfaces that are exposed to the water medium. The polar head groups are highly solvated and can act as an effective barrier against PNs being absorbed into the more favourable hydrophobic region. The energy cost of stripping off the water of hydration is much higher than the weak interactions between the head groups and the non-polar polymer. For this reason, PNs are more likely to move into solvent bulk and away from the membrane surface if they were initially sitting on top of the lipid head groups.
However, dangling chain ends from the PNs can easily penetrate the hydrophilic barrier and be irreversibly adsorbed when they come into contact with the top portion of the hydrocarbon chains of the POPC membrane. When this occurs, the favourable interactions between the PNs and hydrocarbon tails easily compensate for the weak interactions between water and the PNs.
The simulations were carried out at the near-physiological condition of 300 K. In the case of PS, this is below the glass transition of the polymer. Therefore, the global structure of the polymer is expected to remain as a solid. Both PS and PE exist as globular structures since water is a poor solvent for both polymers. Even then, free dangling chain ends can still move randomly and extend away from the main nanoparticle body. For this reason, we would expect polymer aggregates with a higher number of chain ends to have a greater propensity to interact with the membrane surface.
In the case of PE-1 and PE-2 systems, the PE nanoparticles can easily penetrate the hydrophilic barrier due to the lack of bulky side groups. This subsequently leads to complete permeation into the inner part of the membrane. In addition, initial polymer insertion can be facilitated by the reorientation of the PE nanoparticles such that the chain segments are approximately aligned with those of hydrocarbon chain segments from the POPC membrane, as shown in figure 1c, and with decreasing ΔP as shown in figure 2. This occurs presumably due to the tendency to maximize the van der Waals contacts between the hydrophobic chains during the insertion process.
Interestingly, previous work [21] has shown that spherical PS nanoparticles could enter cells, whereas disc-shaped nanoparticles tended either to enter and remain in the lipid bilayers or just bind to the membrane surface. In this case, the particles had a diameter of 20 nm, which is more than an order of magnitude larger than those in this work. In fact, other modelling [22] on carbon nanoparticles has shown that elongated particles have a smaller free energy barrier to permeate the membrane compared with that of spherical particles. This highlights the importance of nanoparticle surface topology in influencing the behaviour of membrane interactions.
PE nanoparticles are expected to gain in chain mobility when they are immersed in a sea of ‘good solvent’ hydrophobic tails in the inner part of the membrane. Subsequently, the nanoparticles expand. However, the extent of expansion depends on the chain topology. PE-1 expansion is more restricted because of self-entanglement of the long single chains. However, PE-2, which has more dangling ends that can easily disentangle from the other chains, is less restricted. In this work, the atomistic simulations indicate that PE-2 is at an early stage of dissolution in the membrane as Rg increases with time (figure 2). Rg is expected to continue to incease and level off over a much longer timescale. Other computational work [12] based on coarse-grain models has shown that after a longer time PS nanoparticles can be completely dispersed into individual chains and distributed across the membrane.
Insertions of the dangling chain ends are still required to initiate irreversible membrane interactions for PS nanoparticles. The density plot in figure 4 shows kinks around the regions where the phosphate groups are located. This suggests build-up of the polymer units around the region, perhaps due to a steric barrier between the hydrated phosphate groups and the bulky aromatic side groups of the polymer units. Note that PS particles contain aromatic side groups which can participate in quadrupole interactions with water. However, such an effect is much smaller for neutral water molecules than for species having high charge density such as cations. Furthermore, highly negatively charged oxygen atoms distributed around the phosphate atoms increase the propensity for water molecules to form strong hydrogen bond networks rather than participating in weaker quadrupole interactions with the π-system of the aromatic rings. This could perhaps explain why PS nanoparticles have much lower permeability than those of PE.
Direct visual inspection of the molecular configurations shows that the PS nanoparticles simply ‘sit’ on top of the membrane throughout the whole simulation. In order to track quantitatively the extent of the interactions between the nanoparticle and the membrane, figure 6 shows a double-plot of penetration depth and the effective surface contacts with respect to time for the PS-2 system. The penetration depth, p, is measured in terms of the minimum z-coordinate value attained by the nanoparticle. The smaller the value of p the deeper is the depth of penetration. The effective surface contact, V, is measured in terms of the van der Waals interaction energy component between PS-2 and the membrane, which is the Lennard-Jones 12-6 potential form for the CHARMM force field. A more negative value of V indicates a greater extent of contact between the particle and the membrane.
Figure 6.
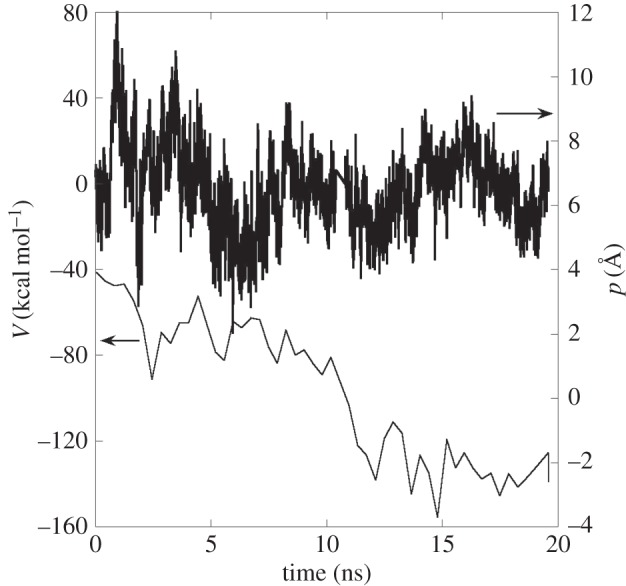
Double y-axis plot of the van der Waals interactions (left scale) between PS-2 and the POPC membrane and the minimum z-coordinate (right scale) of PS-2 with respect to time.
The graphs show that p essentially fluctuates throughout the simulation. However, V becomes more negative with respect to time. This shows that PS-2 is more tightly bound to the membrane by increasing the surface contact, at the expense of the initial contact of the dangling chain ends. This increases the probability of eventual penetration through the hydrophilic barrier by other parts of the polymer chains, leading to the transfer of more polymeric materials into the membrane. Interestingly, other free energy calculations [11] based on coarse-grain models, show that cross-linked PS nanoparticles can permeate the membrane, with the membrane plane bending towards the nanoparticle for maximum contact.
5. Conclusion
Studies of atomic interactions between POPC membrane and PE and PS nanoparticles using MD simulations have been carried out. The simulation timescale achieved here is only of the order of tens of nanoseconds and thus only the initial stage of surface interactions could be probed. Coarse-grain models that can reach much longer timescales would be needed, as for instance, in the case of PS nanoparticles, to study the complete particle uptake process by cell membranes. Nevertheless, molecular models provide mechanistic views of the interactions in atomistic detail and show that irreversible interactions can take place via a single dangling chain end from a nanoparticle by penetrating the hydrophilic barrier at the membrane surface. After this stage, subsequent adsorption behaviour depends on chain topology, as well as polymer unit structure.
Obviously, realistic biological cell membranes can also contain other molecules, such as sterols and other proteins, that are involved in various membrane functions. It is likely that the presence of all these biomolecules may have some roles in influencing the overall interaction with nanoparticles. Nevertheless, the localized atomistic models presented here suggest that qualitatively similar effects are also likely to occur in vivo.
Supplementary Material
Acknowledgement
The simulations were performed using SCARF (Scientific Computing Application Resource for Facilities), the computing resources provided by STFC's Scientific Computing Department.
References
- 1.Nie S, Xing Y, Kim GJ, Simons JW. 2007. Nanotechnology applications in cancer. Annu. Rev. Biomed. Eng. 9, 257–288. ( 10.1146/annurev.bioeng.9.060906.152025) [DOI] [PubMed] [Google Scholar]
- 2.Browne MA, Dissanayake A, Galloway TS, Lowe DM, Thompson RC. 2008. Ingested microscopic plastic translocates to the circulatory system of the mussel, Mytilus edulis (L.). Environ. Sci. Technol. 42, 5026–5031. ( 10.1021/es800249a) [DOI] [PubMed] [Google Scholar]
- 3.Monteiro-Riviere NA, Tran CL. (ed.). 2014. Nanotoxicology: progress toward nanomedicine, 2nd edn. Boca Raton, FL: CRC Press. [Google Scholar]
- 4.Verma A, Uzun O, Hu Yu, Hu Yi, Han H-S, Watson N, Chen S, Irvine DJ, Stellacci F. 2008. Surface-structure-regulated cell-membrane penetration by monolayer-protected nanoparticles. Nat. Mater. 7, 588–595. ( 10.1038/nmat2202) [DOI] [PMC free article] [PubMed] [Google Scholar]
- 5.Mackerell AD., Jr 2004. Empirical force fields for biological macromolecules: overview and issues. J. Comput. Chem. 25 1584–1604. ( 10.1002/jcc.20082) [DOI] [PubMed] [Google Scholar]
- 6.Monticelli L, Salonen E, Ke PC, Vattulainen I. 2009. Effects of carbon nanoparticles on lipid membranes: a molecular simulation perspective. Soft Matter 5, 4433–4445. ( 10.1039/b912310e) [DOI] [Google Scholar]
- 7.Bedrov D, Smith GD, Davande H, Li L. 2008. Passive transport of C60 fullerenes through a lipid membrane: a molecular dynamics simulation study. J. Phys. Chem. B 112, 2078–2084. ( 10.1021/jp075149c) [DOI] [PubMed] [Google Scholar]
- 8.Wallace EJ, Sansom MSP. 2008. Blocking of carbon nanotube based nanoinjectors by lipids: a simulation study. Nano Lett. 8, 2751–2756. ( 10.1021/nl801217f) [DOI] [PubMed] [Google Scholar]
- 9.Barnes DKA, Galgani F, Thompson RC, Barlaz M. 2009. Accumulation and fragmentation of plastic debris in global environments. Phil. Trans. R. Soc. B 364, 1985–1998. ( 10.1098/rstb.2008.0205) [DOI] [PMC free article] [PubMed] [Google Scholar]
- 10.Sackmann E. 1996. Supported membranes: scientific and practical applications. Science 271, 43–48. ( 10.1126/science.271.5245.43) [DOI] [PubMed] [Google Scholar]
- 11.Thake THF, Webb JR, Nash A, Rappoport JZ, Notman R. 2013. Permeation of polystyrene nanoparticles across model lipid bilayer membranes. Soft Matter 9, 10 265–10 274. ( 10.1039/c3sm51225h) [DOI] [Google Scholar]
- 12.Rossi G, Barnoud J, Monticelli L. 2014. Polystyrene nanoparticles perturb lipid cell membrane. J. Phys. Chem. Lett. 5, 241–246. ( 10.1021/jz402234c) [DOI] [PubMed] [Google Scholar]
- 13.Todorov IT, Smith W, Trachenko K, Dove MT. 2006. DL_POLY_3: new dimensions in molecular dynamics simulations via massive parallelism. J. Mater. Chem. 16, 1911–1918. ( 10.1039/b517931a) [DOI] [Google Scholar]
- 14.Yong CW. 2010. DL_FIELD—a force field and model development tool for DL_POLY. In CSE frontier (ed. Blake R.), pp. 38–40. Warrington, UK: STFC Computational Science and Engineering, Darebury Laboratory. [Google Scholar]
- 15.Klauda JB, Venable RM, Freites JA, O'Connor JW, Tobias DJ, Mondragon-Ramirez C, Vorobyov I, MacKerell AD, Jr, Pastor RW. 2010. Update of the CHARMM all-atom additive force field for lipids: validation on six lipid types. J. Phys. Chem. B 114, 7830–7843. ( 10.1021/jp101759q) [DOI] [PMC free article] [PubMed] [Google Scholar]
- 16.Yong CW. 2014. DL_ANALYSER—a general post-analysis software tool for DL_POLY See http://www.ccp5.ac.uk/DL_ANALYSER/.
- 17.Humphrey W, Dalke A, Schulten K. 1996. VMD—visual molecular dynamics. J. Mol. Graph. 14, 33–38. ( 10.1016/0263-7855(96)00018-5) [DOI] [PubMed] [Google Scholar]
- 18.Kendall K. 2001. Molecular adhesion and its application. Dordrecht, The Netherlands: Kluwer. [Google Scholar]
- 19.Johnson KL, Kendall K, Roberts D. 1971. Surface energy and the contact of elastic solids. Proc. R. Soc. Lond. A 324, 301–303. ( 10.1098/rspa.1971.0141) [DOI] [Google Scholar]
- 20.Yong CW, Kendall K, Smith W. 2004. Atomistic studies of surface adhesion using molecular-dynamics simulations. Phil. Trans. R. Soc. Lond. A 362, 1915–1929. ( 10.1098/rsta.2004.1423) [DOI] [PubMed] [Google Scholar]
- 21.Zhang Y, Tekobo S, Tu Y, Zhou Q, Jin X, Dergunov SA, Pinkhassik E, Yan B. 2012. Permission to enter cell by shape: nanodisk vs nanosphere. ACS Appl. Mater. Interfaces 4, 4099–4105. ( 10.1021/am300840p) [DOI] [PubMed] [Google Scholar]
- 22.Chang R, Violi A. 2006. Insights into the effect of combustion-generated carbon nanoparticles on biological membranes: a computer simulation study . J. Phys. Chem. B 110, 5073–5083. ( 10.1021/jp0565148) [DOI] [PubMed] [Google Scholar]
Associated Data
This section collects any data citations, data availability statements, or supplementary materials included in this article.


