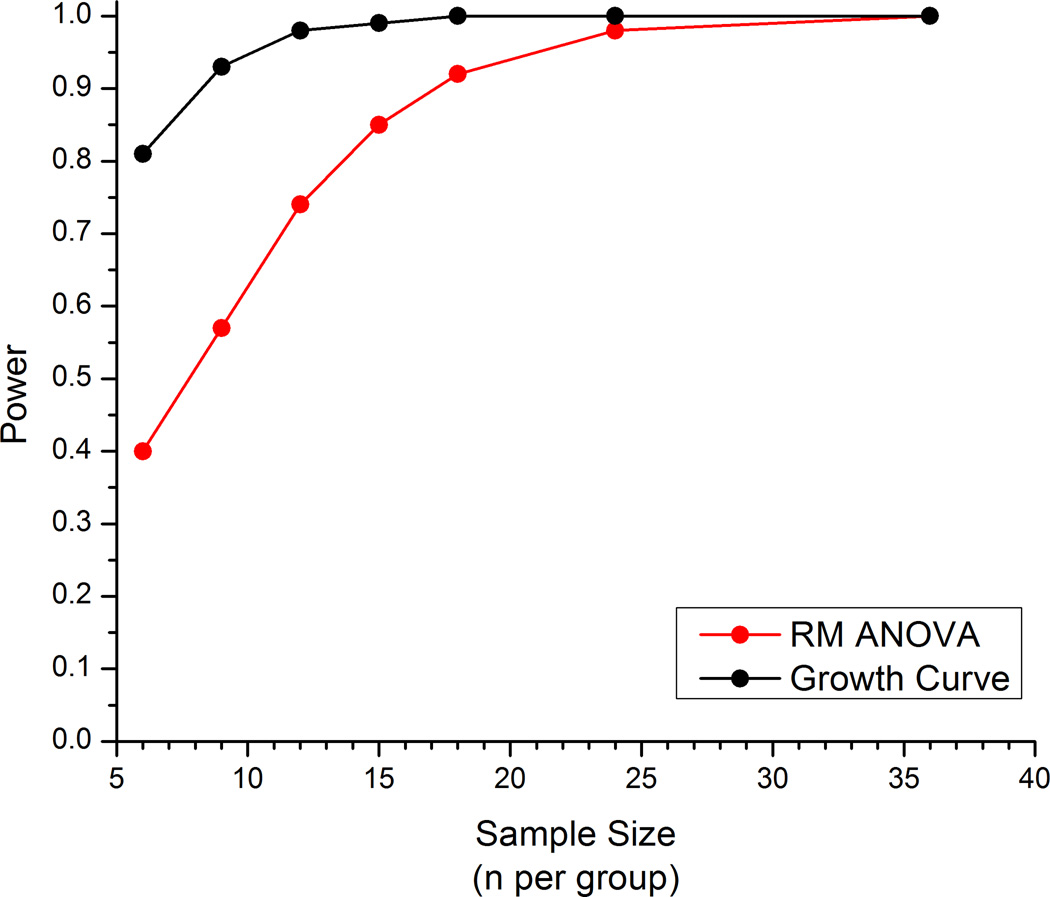
Figure 6.
Plot of statistical power (y-axis) of RM ANOVA model (red) and growth curve model (black) obtained from analyses of simulated data by sample size (n per group) (x-axis). The two simulations estimated two different parameters from the approaches and are not different estimates of the same construct. In the ANOVA simulations, the group*time interaction effect was examined, while a model fit was the focus of the growth curve simulations.

