

Abstract
Abstract: Purpose: To investigate whether fructopyrano-(1→4)-glucopyranose (FG) inhibits the proliferation of liver cancer cells and angiogenesis in a vascular endothelial growth factor (VEGF)/vascular endothelial growth factor receptor (VEGFR) dependent manner. Methods: Bel-7402, HepG2 and SMMC-7721 cells with high expression of VEGF and VEGFR were screened. Bel-7402 cells and human microvascular endothelial cells (HMEC) were treated with FG for 48 h. CCK-8 assay was used to detect cell proliferation. Wound healing assay was used to investigate effect of FG on the migration of HMECs. Tube formation assay was done to test influence of FG on the angiogenesis of HMECs, and qRT-PCR and western blot assay were performed to detect mRNA and protein expression of VEGF, Fit-1 and KDR. Nude mice were inoculated with Bel-7402 cells, and influence of FG on tumor growth, microvessel density (MVD) and VEGF expression in tumor was investigated. Results: Bel-7402 cells had a significantly higher expression of VEGF and VEGFR when compared with HepG2 cells and SMMC-7721 cells. FG could markedly reduce the mRNA and protein expressions of VEGF, Fit-1 and KDR in Bel-7402 cells and inhibit the proliferation of Bel-7402 cells in a concentration dependent manner. In addition, FG was able to remarkably inhibit the proliferation, migration and angiogenesis of HMECs, exerting anti-angiogenetic effect. In cancer-bearing nude mice, FG was found to inhibit the tumor growth, reduce MVD in tumors and decrease the VEGF in tumors. Conclusions: FG can inhibit proliferation of liver cancer cells and suppression angiogenesis in liver cancer in a VEGF/VEGFR dependent manner.
Keywords: Vascular endothelial growth factor, vascular endothelial growth factor receptor, liver cancer, fructopyrano-(1→4)-glucopyranose
Introduction
More than 90% liver cancers belong to hepatocellular carcinoma (HCC) which is rich in blood vessels, and the growth and metastasis of these cancers are closely related to the angiogenesis [1,2]. Vascular endothelial growth factor (VEGF) is an important pro-angiogenic factor and can bind to vascular endothelial growth factor receptor (VEGFR) (mainly Fit-1 and KDR) to induce a series of signal transduction resulting in releasing of different growth factors and cytokines. This may promote the proliferation and migration of endothelial cells, leading to the angiogenesis, which plays an important role in the angiogenesis in liver cancer. In recent years, studies have shown that VEGFR is expressed on not only endothelial cells but a lot of cancer cells [3,4], suggesting that the VEGF/VEGFR signaling pathway is involved in the regulation of proliferation of cancer cells. However, whether there is coexpression of VEGF and VEGFR on liver cancer cells and whether the binding of VEGF to VEGFR may promote the proliferation of liver cancer cells and angiogenesis in liver cancer are largely unknown and have been the focuses in studies on the targeted therapy of liver cancer.
In humans, sucrose is metabolized into glucose and fructose to provide energy. To date, another disaccharide compound (Fructopyrano-(1→4)-glucopyranose [FG]) with similar structure with sucrose has been identified. FG has no Chinese name and its structure is shown in Figure 1. FG is an isomer of sucrose and has following differences from sucrose: 1) the location of glycosidic bond; 2) the pattern of fructose. In formula 1, the compound is pyranose. FG was firstly isolated from the Rhodiola Kirilowii by Wiedenfeld et al [5] who reported the procedures for the extraction of FG. Our group also extracted FG from a Chinese herb radix isatidis and purified it is our previous study. FG is colorless and transparent, has a purity of >99% and a molecular weight of 342 and accounts for 0.2-0.5% in radix isatidis. In previous studies [6], results showed that FG could inhibit the growth of S180 cells and H22 cells in mice in a dose dependent manner. In this study, liver cancer cells with high expression of VEGF and VEGFR were screened, and we investigated whether FG extracted from radix isatidis could inhibit the proliferation of liver cancer cells and angiogenesis in liver cancer in a VEGF/VEGFR dependent manner. This study aimed to inhibit the angiogenesis in liver cancer via suppressing VEGF/VEGFR signaling pathway and provide a new method for the treatment of liver cancer with Traditional Chinese Medicine.
Figure 1.
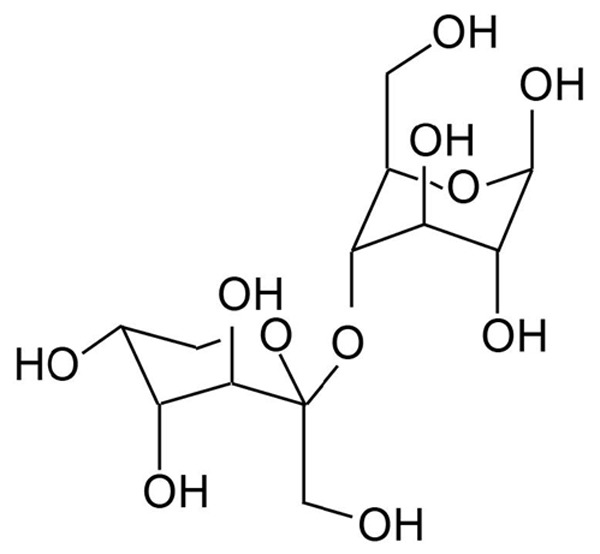
Structure of Fructopyrano-(1→4)-glucopyranose.
Materials and methods
Cell lines, drugs and animals
Human liver cancer cell lines (HepG2 cells, SMMC-7721 cells and Bel-7402 cells) were maintained in RPMI1640 containing 10% fetal bovine serum (FBS) in an environment with 5% CO2 at 37°C, followed by passaging. Human microvascular endothelial cells (HMEC) were grown in MCDB 131 complete medium containing 10% serum in an environment with 5% CO2 at 37°C. These cells were purchased from Shanghai Institute of Materia Medica of Chinese Academy of Sciences.
FG (colorless, transparent, >99% in purity and 342 in molecular weight) was provided by Dr. Sun Q in the Department of Pharmaceutics of Luzhou Medical College. RPMI1640 (GIBCO), cell counting kit-8 (CCK-8 kit; Beyotime Institute of Biotechnology), Human VEGF ELISA kit (Wuhan Cusabio), secondary antibodies from rabbits (Zhongshan Golden Bridge), rabbit anti-human VEGF polyclonal antibody, KDR primary antibody, Fit-1 primary antibody (Wuhan Boster Biotech), evacizumab (Avastin, Roche) and total RNA extraction kit (Tiangen Biotech) were used in this study.
Male BALB/c-nu mice (specific pathogen free) aged 4-5 weeks were purchased from the Experimental Animal Center of Shanghai Institute of Materia Medica of Chinese Academy of Science (License No.: SCXK (iß) 20040002).
Detection of VEGF, Flt-1 and KDR expression
SMMC-7721 cells, Bel-7402 cells and HepG2 cells in logarithmic growth phase were harvested, and the cell density was adjusted to 5×10⁴/mL. After digestion, cells were seeded in 12-well plates. When cell confluence reached near 100%, cells were washed in PBS thrice (5 min for each) and then fixed in cold acetone (-20°C) at 4°C for 15 min. The coverslips with cells were obtained and stored at -20°C. Two step immunohistochemistry was performed to detect the expression of VEGF, Flt-1 and KDR in these cells, and representative photographs were obtained.
Detection of VEGF content in supernatant by ELISA
SMMC-7721 cells, Bel-7402 cells and HepG2 cells in logarithmic growth phase were harvested, and the cell density was adjusted to 3×10⁵/mL. Then, 6 ml of cell suspension was added to flasks, followed by culture for 48 h. The supernatant was transferred into tubes, followed by centrifugation at 4°C for 10 min at 10000 rpm. In addition, additional 1.5 ml of supernatant was collected for further use. ELISA was performed according to manufacturer’s instructions, and optical density (OD) was measured at 450 nm.
Detection of VEGF, Fit-1 and KDR mRNA expression by qRT-PCR
Total RNA was extracted from SMMC-7721 cells, Bel-7402 cells and HepG2 cells in logarithmic growth phase, followed by reverse transcription. PCR was done with 1 μL of cDNA in a thermal cycler (ABI, NY, USA) to detect the mRNA expression of VEGF, Fit-1, KDR and β-actin. The relative expression of target genes was calculated. The primers are shown in Table 1.
Table 1.
Primers used in PCR
| Genes | Primers |
|---|---|
| VEGF (421 bp) | Forward: 5’-CCT TGC TGC TCT ACC TCC-3’ |
| Reverse: 5-AAA TGC TTT CTC CGC TCT-3’ | |
| Flt-1 (497 bp) | Forward: 5’-CAA GTG GCC AGA GGC ATG GAG TT-3’ |
| Reverse: 5’-GAT GTA GTC TTTACC ATC CTG TTG-3’ | |
| KDR (705 bp) | Forward: 5’-GAG GGC CAC TCA TGG TGA TTG T-3’ |
| Reverse: 5’-TGC CAG CAG TCC AGC ATG GTC TG-3’ | |
| β-actin (184 bp) | Forward: 5’-AAA CTC GGC ACA GTT ATT-3’ |
| Reverse: 5’-TAT ACA GCC TAGCAT CCC-3’ |
Detection of proliferation of Bel-7402 cells and HMECs after FG treatment with CCK-8 assay
The density of Bel-7402 cells and HMECs in logarithmic growth phase was adjusted and these cells were then seeded into 96-well plates (90 uL/well). After culture for 24 h, FG (10 uL/well) was added when the cells were adherent to the wall. The final concentration of FG was 62.5 μM, 125 μM, 250 μM, 500 μM and 1000 mM (3 wells in each group). After incubation with FG for 24 h, 48 h and 72 h, CCK-8 (10 μL/well) was added, followed by incubation for another 1 h. OD was measured at 450 nm. Following formula was used to calculate the inhibition rate of proliferation: inhibition rate = [1-(ODFG-ODBlank)/(ODnegative-ODBlank)]×100%. LOGIT method was used to calculate the half maximal inhibitory concentration (IC50).
Detection of migration of HMECs after FG treatment by wound healing assay
Cells were maintained in 6-well plates. When the confluence of single-layer cells reached about 95%, a wound was created in cells by scratching with a curette. These cells were washed with PBS 2-3 times, and then observed under a microscope to assure that there were no cells in the wound. The wound was also marked. Cells were maintained in fresh medium, followed by addition of hEGF (10 ng/ml) and FG at different concentrations (final concentration: 125 μM, 250 μM, 500 μM) (a total of 2 ml). Incubation was done for 24 h, followed by fixation in methanol and Wright-Giemsa staining. After drying, cells were observed under a light microscope, and the wound was photographed at a magnification of ×200. The number of cells migrating across the wound was counted in each group, and one-way analysis of variance was employed for statistical analysis with SPSS version 11.0 [7,8].
Detection of angiogenesis of HMECs after FG treatment by tube formation assay
Cells were maintained in 24-well plates. Each well was pre-coated with Matrigel (300 μl/well, 4°C) at 37°C in an environment with 5% CO2 for. Cells were digested with trypsin and suspended in fresh medium to prepare cell suspension at 2×10⁵/ml. hEGF (0.01 mg/L) and FG at different concentrations (final concentration: 125 μM, 250 μM, and 500 μM; 0.25 ml) were added into each well, followed by incubation for 6 h. Cells were observed under a microscope, and the tube formation was evaluated [9].
Detection of mRNA expression of VEGF, Fit-1 and KDR in Bel-7402 cells after FG treatment by qRT-PCR
Bel-7402 cells in logarithmic growth phase were harvested, and the cell density was added to 5.0×10⁵ cells/flask. Then, 8 ml of cell suspension was added to 4 flasks, followed by incubation for 24 h. There were 4 groups in this experiment, in which cells were treated with 125 μM FG, 250 μM FG, 500 μM FG and RPMI1640, respectively, for 48 h. Then, total RNA was extracted from cells in each group, followed by RT-PCR with 1 μL of cDNA in a thermal cycler (ABI, NY, USA). The relative expression of VEGF, Fit-1 and KDR was determined by normalizing to β-actin mRNA expression.
Detection of protein expression of VEGF, Fit-1 and KDR in Bel-7402 cells after FG treatment by western blot assay
The FG treatment was done as in 2.5. After FG treatment for 48 h, total protein was extracted, and protein concentration was determined with BCA method. After SDS-PAGE, proteins were transferred onto PVDF membrane, followed by blocking for 2 h. Then, the membranes were treated with different primary antibodies (VEGF, Flt-1 and KDR; 1:1000) for 1 h, followed by incubation with horseradish peroxidase (HRP) conjugated secondary antibody at room temperature or 4°C for 1 h. The membranes were then treated with Luminate crescendo western HRP Substrate, and visualized in Bio-Rad gel image system, followed by analysis with Quantity One software.
Effect of FG on the tumor growth in nude mice inoculated with Bel-7402 cells
Bel-7402 tumor with vigorous growth was collected and cut into blocks (1.5 mm3). Under an aseptic condition, these blocks were subcutaneously inoculated into nude mice at right armpit. Nude mice with tumor larger than ≥50 mm3 were recruited and randomly divided into 5 groups: negative control group (NS), positive control group (Bevacizumab, 5 mg/kg, i.p.), 50 mg/kg FG group, 100 mg/kg FG group and 200 mg/kg FG group. FG was administered intragastrically for 5 days, and 2 days later, FG treatment continued for a total of 4 weeks. At the end of experiment, mice were sacrificed. The tumor size and body weight were measured thrice, and the tumor volume (TV), relative tumor volume (RTV) and relative tumor growth (T/C %) were determined as follows:
1) TV = 1/2×a×b2, where a and b represent the length and width, respectively.
2) RTV = Vt/V0, where V0 is the tumor volume at the time of grouping (d0) and Vt refers to the tumor volume at each measurement.
3) T/C (%) = TRTV/CRTV×100%, where TRTV refers to RTV of FG treated mice, and CRTV is RTV of mice in negative control group.
Detection of microvessel density (MVD)
Tumors were sectioned, deparaffinized and hydrated. Then, these sections were blocked in goat serum, followed by addition of CD34 primary antibody (1:50), biotinylated secondary antibody and SABC. In negative control group, primary antibody was replaced with PBS. Visualization was done with DAB, followed by mounting with neutral gum. Sections were observed under a light microscope. MVD counting: A microvessel was defined when the brown vascular endothelial cells or cell population could be differentiated from adjacent microvessels, cancer cells and other connective tissues. First, 5 regions with the most dense MVD were determined as “hot regions) at ×100. Second, the number of microvessels was determined at ×200, and average was obtained as the MVD of a mouse.
Detection of VEGF expression in tumor by immunohistochemistry
Sections were deparaffinized, rehydrated and then treated with 3% H2O2 to block the endogenous peroxidase. Sections were then blocked in goat serum for 10 min. Two-step immunohistochemistry was performed. Sections were observed under a light microscope and representative photographs were obtained. The positive rate was calculated as follow: positive rate = number of positive cells/total cells ×100%.
Statistical analysis
Data are expressed as means ± standard deviation (X̅±S). Statistical analysis was performed with one-way analysis of variance. A value of P<0.05 was considered statistically significant.
Results
Protein expression of VEGF, Flt-1 and KDR in cells
Cells with brown granules in cytoplasm were defined as positive. Results showed both HepG2 cells and Bel-7402 cells had expression of VEGF, Flt-1 and KDR, but SMMC-7721 cells only expressed VEGF and Flt-1 and had no KDR expression (Figure 2).
Figure 2.
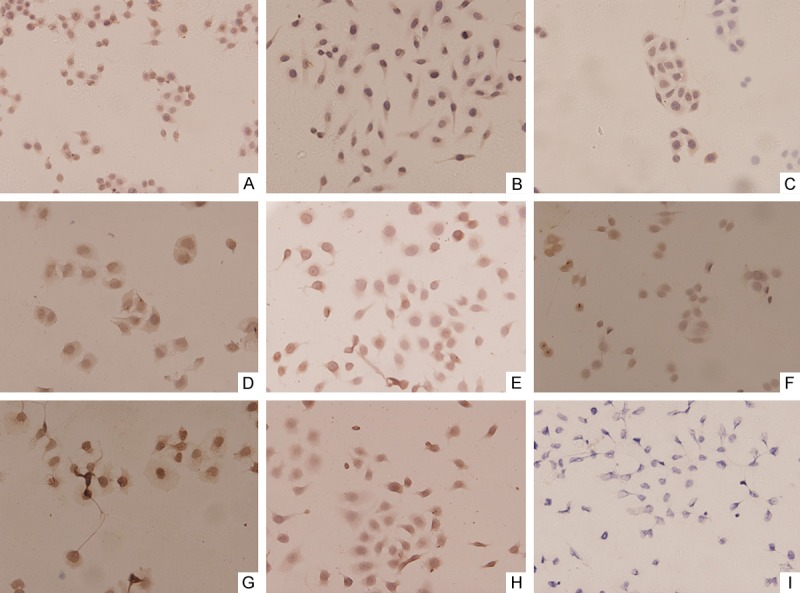
Expression of VEGF, Flt-1, and KDR in hepatoma cell lines by immunohistochemical detection (×200). (A) VEGF in Bel-7402; (B) VEGF in HepG2; (C) VEGF in SMMC-7721; (D) Flt-1 in Bel-7402; (E) Flt-1 in HepG2; (F) Flt-1 in SMMC-7721; (G) KDR in Bel-7402; (H) KDR in HepG2; (I) KDR in SMMC-7721. (A-H) show positive expression, but (I) shows negative expression.
VEGF content of cell culture supernatant
The linear regression equation was determined as follow according to the standard curve of OD: Y = -9.57+1355.12X, R = 0.99915, where Y is the expression of VEGF and X refers to the OD. The VEGF expression in Bel-7402 cells was markedly higher than that in HepG2 cells and SMMC-7721 cells (Figure 3).
Figure 3.
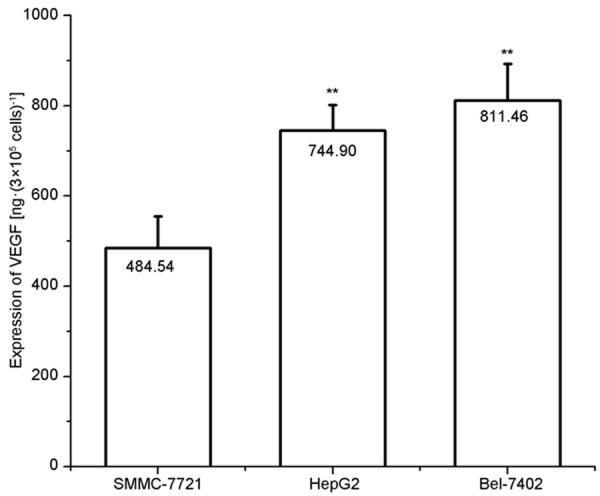
Expression of VEGF in the culture supernatant of hepatoma cell lines (n=3). Results are expressed as mean ± standard error (SE); *P<0.05, **P<0.01, vs. SMMC-7721 cells.
mRNA expression of VEGF, Flt-1 and KDR in cell lines
The mRNA expression of VEGF, Flt-1 and KDR in Bel-7402 cells was significantly higher than that in HepG2 cells and SMMC-7721 cells (Figure 4).
Figure 4.
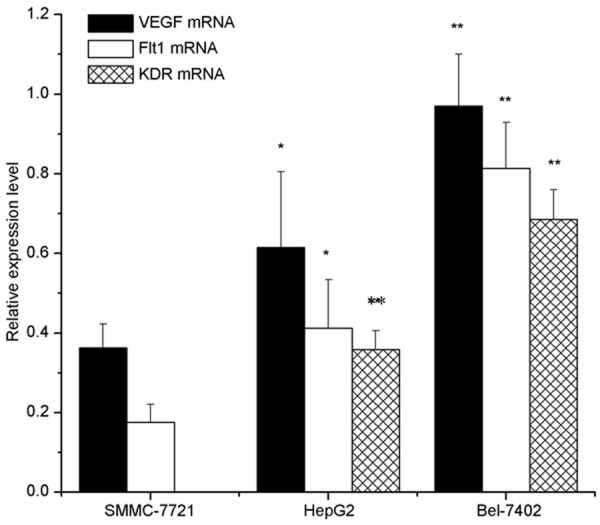
Expression of VEGF, Flt-1, and KDR mRNA in hepatoma cell lines, as detected by qRT-PCR analysis. The relative ratio is shown whereby VEGF, Flt-1, and KDR mRNA signals were normalized to the β-actin signal. Results are expressed as mean ± SE; *P<0.05, **P<0.01, vs. the SMMC-7721 cells.
Inhibition of proliferation of Bel-7402 cells and HMECs by FG
FG could inhibit the proliferation of Bel-7402 cells and HMECs in a concentration dependent manner: the higher the concentration of FG (62.5 μM to 1000 μM), the more potent the inhibition was (Figure 5). After FG treatment for 24 h, 48 h and 72 h, the IC50 of FG was 509.68±36.28 μM, 287.04±15.36 μM and 244.57±12.92 μM, respectively, for Bel-7402 cells and 678.19±45.53 μM, 464.65.84±23.75 μM and 416.39±22.72 μM, respectively, for HMEC. The inhibition rate at 48 h was similar to that at 72 h, suggesting the optimal duration of treatment was 48 h. Thus, in the following experiment, FG treatment was done for 48 h.
Figure 5.
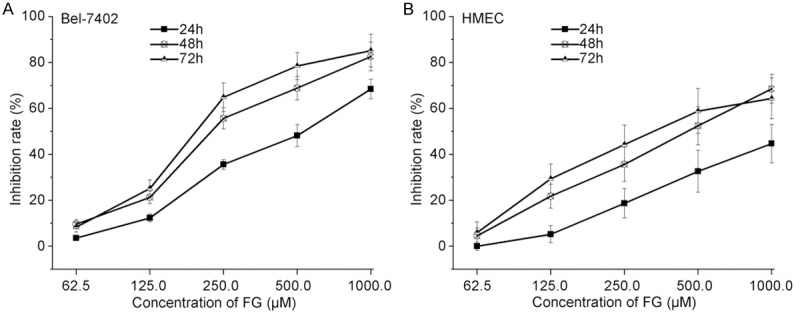
Concentration-inhibitory rate curve, as detected by CCK8 assay (n=3). A. Bel-7402; B. HMEC cells.
Effect of FG on the migration of HMECs
FG at a concentration no lower than 125 μM could inhibit the migration of HMECs, and the higher the concentration of FG, the smaller the number of migrating cells was (Figure 6).
Figure 6.
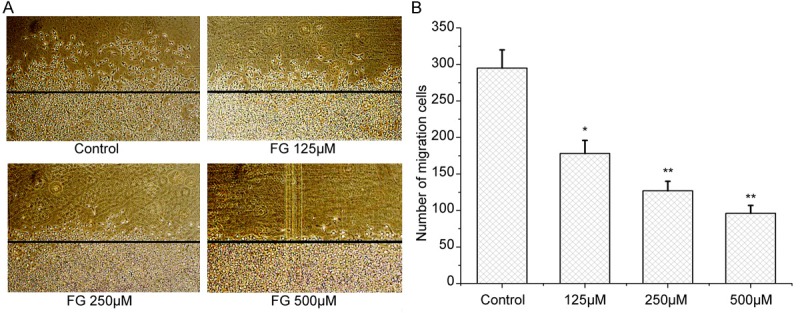
Effect of FG on HMECs migration (×200), as detected by Wounding healing assay (n=3). A. Graph of HMECs migration. B. Number of Migration cells. Results are expressed as mean ± SE; *P<0.05, **P<0.01, vs the control.
Effect of FG on the tube formation of HMECs
Results showed FG could inhibit the tube formation of HMECs, and the higher the concentration of FG, the smaller the number of tubes formed by HMECs was (Figure 7).
Figure 7.
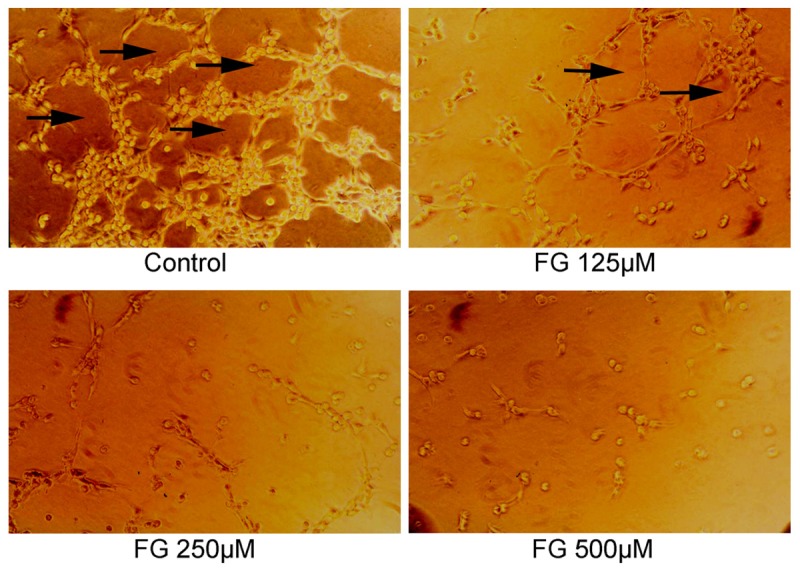
Effect of FG on HMECs tube formation (×200), as detected by Tube formation assay (n=3). Arrows: tube formation.
mRNA expression of VEGF, Flt-1 and KDR in Bel-7402 cells after FG treatment
In negative control group, the mRNA expression of VEGF, Flt-1 and KDR was at a relatively high level. After FG treatment, the mRNA expression of VEGF, Flt-1 and KDR reduced, and the higher the concentration of FG, the lower the mRNA expression of VEGF, Flt-1 and KDR was (Figure 8).
Figure 8.
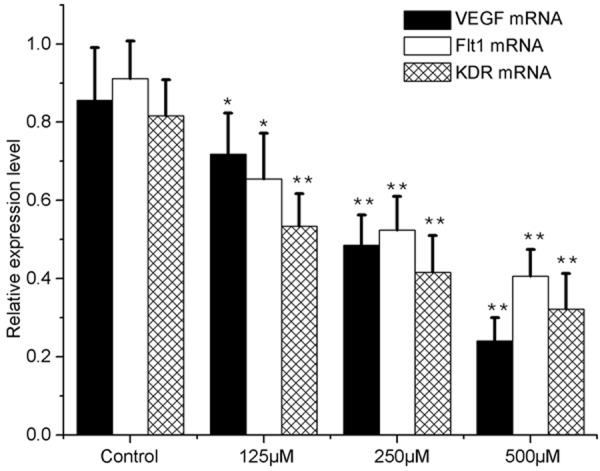
VEGF, Flt-1, and KDR mRNA expression in FG-treated Bel-7402 cells, as revealed by qRT-PCR (n=3). The relative ratio is shown whereby VEGF, Flt-1, and KDR mRNA signals were normalized to the β-actin signal. Results are expressed as mean ± SE; *P<0.05, **P<0.01, vs the control.
Protein expression of VEGF, Flt-1 and KDR in Bel-7402 cells after FG treatment
FG could reduce the protein expression of VEGF, Flt-1 and KDR in Bel-7402 cells in a concentration dependent manner, and the higher the concentration of FG, the lower the protein expression was. Results are shown in Figure 9.
Figure 9.
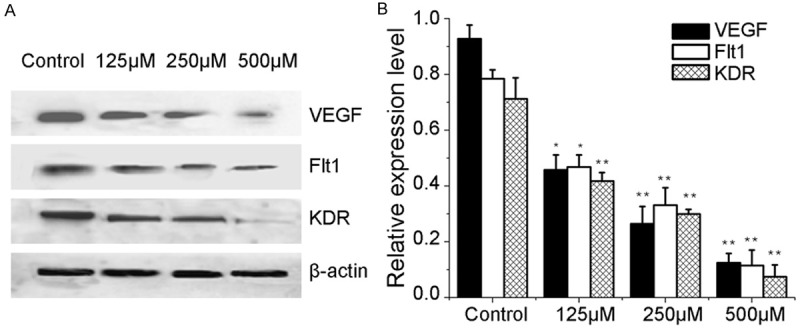
FG regulated the expression of VEGF, Flt-1, and KDR in Bel-7402 cells (n=3). Western blot analyses were conducted and probed with anti-VEGF, anti- Flt-1, anti- KDR, and anti-β-actin antibodies. (A) Bands corresponding to VEGF, Flt-1, KDR, and β-actin. (B) Results were quantified by densitometric analyses of the bands from (A) and then normalized to the β- actin protein. Results are expressed as mean ± SE; *P<0.05, **P<0.01, vs the control.
Effect of FG on tumor growth in nude mice inoculated with Bel-7402 cells
Results showed FG could inhibit the tumor growth to different extents. After FG treatment, the TV, RTV and T/C % reduced significantly (Table 2, Figure 10).
Table 2.
Effect of FG on the tumor growth of nude mice transplanted Bel-7402 cells at 19th day
| Group | Dose (mg/kg) | N | Body weight (g) | TV (mm3) | RTV | T/C (%) | ||
|---|---|---|---|---|---|---|---|---|
|
| ||||||||
| d0 | d19 | d0 | d19 | |||||
| Control | - | 12 | 22.11±1.17 | 28.52±1.62 | 78.76±13.82 | 579.72±189.06 | 7.40±3.08 | |
| Bevacizumab | 5 | 6 | 22.39±1.42 | 22.99±1.48 | 81.31±18.38 | 247.75±148.73** | 3.02±0.97** | 40.86 |
| FG | 50 | 6 | 23.07±1.37 | 29.58±1.75 | 79.14±14.73 | 387.42±155.89* | 4.90±1.23* | 66.19 |
| FG | 100 | 6 | 22.34±1.41 | 27.95±1.59 | 78.35±15.13 | 343.72±93.76** | 4.31±0.88** | 58.20 |
| FG | 200 | 6 | 22.45±1.56 | 27.06±1.65 | 77.83±15.76 | 294.63±82.58** | 3.67±1.06** | 49.66 |
Footnotes: d0: time of dividing into groups, d19: best time of treatment; compare with control:
P<0.05;
P<0.01.
Figure 10.
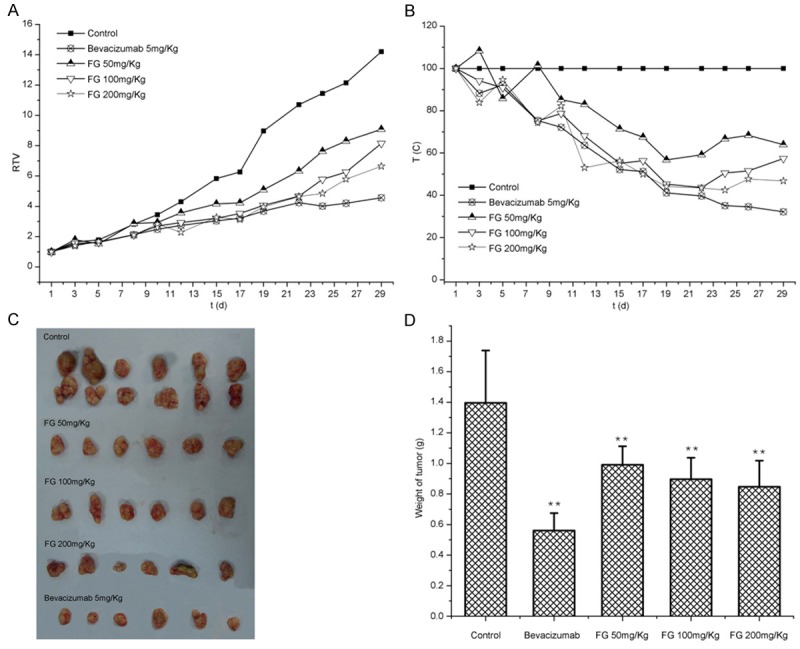
Inhibition of FG on tumor growth in transplanted Bel-7402 cells in nude mice. A. RTV; B. T/C; C. Tumor at d30; D. Weight of tumor.
Effect of FG on the MVD of tumor in nude mice inoculated with Bel-7402 cells
Imunohistochemistry showed the microvessels were brown and cord-like and had scattered distribution, and MVD reduced to different extents after FG treatment. The MVD in FG treatment groups was significantly lower than that in negative control group (P<0.01), suggesting that FG can inhibit the angiogenesis in the tumor of nude mice (Table 3).
Table 3.
Effect of FG on MVD in RTV and T/C in transplanted Bel-7402 cells in nude mice
| Group | Dose (mg/kg) | N | MVD |
|---|---|---|---|
| Control | - | 12 | 49.53±10.52 |
| Bevacizumab | 5 | 6 | 18.34±9.76 |
| FG | 50 | 6 | 35.77±5.85* |
| FG | 100 | 6 | 28.23±4.94** |
| FG | 200 | 6 | 24.49±3.45** |
Footnotes: compare with control:
P<0.05;
P<0.01.
Effect of FG on the VEGF expression in the tumor of nude mice inoculated with Bel-7402 cells
Immunohistochemistry showed tumor cells had VEGF expression in FG treatment groups and these positive cells had brown granules in the cytoplasm, which was different from positive control group. After FG treatment, the proportion of cells positive for VEGF was significantly higher than that in negative control group (P<0.01; Table 4).
Table 4.
Expression of VEGF in transplanted Bel-7402 cells in nude mice (n=3)
| Group | Dose (mg/kg) | N | Ratio of positive expression (%) |
|---|---|---|---|
| Control | - | 12 | 50.99±5.87 |
| Bevacizumab | 5 | 6 | 21.67±3.74 |
| FG | 50 | 6 | 38.83±4.35* |
| FG | 100 | 6 | 30.19±4.78** |
| FG | 200 | 6 | 26.48±4.08** |
Footnotes: Compared with control:
P<0.05;
P<0.01.
Discussion
The proliferation of cancer cells and angiogenesis in cancers are two complex processes regulated by multiple factors. Studies [10,11] have shown that some active mediators are involved in the regulation of both processes. Fibroblast growth factors (FGFs), angiogenin and platelet-derived endothelial cell growth factor (PD-ECGF), transforming growth factor--α/β (TGF-α/β) and vascular endothelial growth factor (VEGF) have been found to be involved these processes. To date, VEGF has been regarded the most potent and specific pro-angiogenic factor in cancers. VEGF acts as a mitogen and a pro-angiogenic factor to directly or indirectly facilitate the angiogenesis of endothelial cells, which plays an important role in the formation, growth and metastasis of cancers [12]. VEGF receptor family mainly includes Fms-like tyrosine (Flt-1), kinase insert domain-containing receptor (KDR) and VEGFR-3 (Flt-4), all of which have tyrosine kinase activity [13,14]. VEGF can bind to KDR to induce the proliferation of vascular endothelial cells; VEGF binds to Flt-1 to induce the migration of endothelial cells and promote the formation of tube-like structure. Generally, VEGF exerts effect on cancer cells via paracrine. Cancer cells without VEGFR may not respond to the VEGF produced by paracrine. On the contrary, endothelial cells have a high expression of VEGFR, but secret a small amount of VEGF. Recent study [15] reveals that VEGF secreted by cancer cells may promote the formation of blood vessels via paracrine. In addition, VEGF secreted by cancer cells may also bind to VEGFR via autocrine to promote the proliferation of cancer cells [3,4].
In recent years, findings show that VEGFR is expressed on not only vascular endothelial cells but some cancer cells. Primary liver cancer is one of the most common malignancies in China and rich in blood vessels. The growth and angiogenesis of liver cancer are closely associated with the VEGF/VEGFR signaling pathway [16]. Graells et al [17] found that liver cancer cell lines had expression of Flt-1 and KDR, but the expression of Flt-1 and KDR varies among cell lines. In addition, they also found that to inhibit the VEGF expression may suppress the proliferation of liver cancer cells, suggesting the presence of autocrine of VEGF in liver cancer cells. In the present study, the mRNA and protein expression of VEGF and VEGFR was detected in HepG2 cells, SMMC-7721 cells and Bel-7402 cells. Our results showed Bel-7402 cells showed co-expression of VEGF, Flt-1 and KDR, and the protein and mRNA expression of VEGF was the highest among these liver cancer cell lines. Thus, Bel-7402 cells were used in the following experiments. Both HepG2 cells and Bel-7402 cells expressed VEGF and VEGFR, suggesting that there might be autocrine of VEGF in liver cancer, which was consistent with previously reported [15,18]. These findings indicate that cancer cells not only secret a large amount of VEGF, but express VEGFR, Flt-1 and KDR. Thus, VEGF secreted by cancer cells can not only promote the angiogenesis via paracrine, but binds to VEGFR via autocrine to promote the proliferation of cancer cells, which play different roles in the growth and metastasis of cancers.
To inhibit the proliferation of cancer cells and angiogenesis in cancers via VEGF/VEGFR signaling pathway can be realized in three ways [19,20]: 1) to selectively inhibit the mRNA expression of VEGF may decrease the synthesis and secretion of VEGF; 2) to directly reduce the VEGFR expression may block the binding of VEGF to its receptors; 3) to directly bind to VEGF receptor may antagonize the pro-angiogenic effect of VEGF to inhibit the tumor growth. In vitro experiment showed FG not only significantly inhibited the proliferation of Bel-7402, but suppressed the proliferation, migration and tube formation of HMECs, suggesting that FG may exert anti-proliferative effect and anti-angiogenic effect on liver cancer cells in vitro. FG markedly reduced the mRNA and protein expression of VEGF, Flt-1 and KDR, suggesting that FG may inhibit the proliferation of liver cancer cells and angiogenesis in a VEGF/VEGFR signaling pathway dependent manner. In vivo experiment further confirmed that FG could inhibit the tumor growth in nude mice to different extents, reduce the MVD in the tumor and decrease the VEGF expression in the tumor. These findings indicate that the FG induced inhibition of growth and angiogenesis of liver cancer is closely related to the down-regulation of VEGF expression. On the basis of above findings, we speculate that FG can inhibit the proliferation of liver cancer cells and suppress the angiogenesis in liver cancer in a VEGF/VEGFR dependent manner. However, the molecular mechanisms underlying the regulation of VEGF/VEGFR signaling pathway by FG are largely unknown and required to be further elucidated.
Acknowledgements
The study was supported by National Natural Science Foundation of China (No: 30873381).
Disclosure of conflict of interest
None.
References
- 1.Shchyogolev AI, Dubova EA, Tumanova UN. Vascularization of hepatocellular carcinoma tissue depends on its differentiation degree. Bull Exp Biol Med. 2012;153:490–494. doi: 10.1007/s10517-012-1749-x. [DOI] [PubMed] [Google Scholar]
- 2.Kong J, Kong F, Gao J, Zhang Q, Dong S, Gu F, Ke S, Pan B, Shen Q, Sun H, Zheng L, Sun W. YC-1 enhances the anti-tumor activity of sorafenib through inhibition of signal transducer and activator of transcription 3 (STAT3) in hepatocellular carcinoma. Mol Cancer. 2014;13:7. doi: 10.1186/1476-4598-13-7. [DOI] [PMC free article] [PubMed] [Google Scholar]
- 3.Farkkila A, Anttonen M, Pociuviene J, Leminen A, Butzow R, Heikinheimo M, Unkila-Kallio L. Vascular endothelial growth factor (VEGF) and its receptor VEGFR-2 are highly expressed in ovarian granulosa cell tumors. Eur J Endocrinol. 2011;164:115–122. doi: 10.1530/EJE-10-0849. [DOI] [PubMed] [Google Scholar]
- 4.Guo S, Colbert LS, Fuller M, Zhang Y, GonzalezPerez RR. Vascular endothelial growth factor receptor-2 in breast cancer. Biochim Biophys Acta. 2010;1806:108–121. doi: 10.1016/j.bbcan.2010.04.004. [DOI] [PMC free article] [PubMed] [Google Scholar]
- 5.Wiedenfeld MH, Zych M, Buchwald W, Furmanowa M. New compounds from Rhodiola kirilowii. Scientia Pharmaceutica (Sci. Pharm. ) 2007;75:29–34. [Google Scholar]
- 6.Liu MH, Li M, Sun Q, Xiao SH. Eeffects of Fructopyrano-(1→4)-glucopyranose extracted from radix isatidis on tumor growth and immune function in tumor bearing mice. Chin pharma J. 2012;47:1542–1546. [Google Scholar]
- 7.Lee MS, Moon EJ, Lee SW, Kim MS, Kim KW, Kim YJ. Angiogenic activity of pyruvic acid in in vivo and in vitro angiogenesis models. Cancer Res. 2001;61:3290–3293. [PubMed] [Google Scholar]
- 8.Wang F, Wang GQ, Xue F, Chen ZQ, Gong YS, Huang ZH. [Migratory properties of vascular smooth muscle cells on extracellular matrix: a study on inverted coverslip migration assay] . Sheng Li Xue Bao. 2013;65:135–142. [PubMed] [Google Scholar]
- 9.Takeda K, Sowa Y, Nishino K, Itoh K, Fushiki S. Adipose-Derived Stem Cells Promote Proliferation, Migration, and Tube Formation of Lymphatic Endothelial Cells In Vitro by Secreting Lymphangiogenic Factors. Ann Plast Surg. 2014 doi: 10.1097/SAP.0000000000000084. [Epub ahead of print] [DOI] [PubMed] [Google Scholar]
- 10.Jang JH, Kim SK, Choi JE, Kim YJ, Lee HW, Kang SY, Park JS, Choi JH, Lim HY, Kim HC. Endothelial progenitor cell differentiation using cryopreserved, umbilical cord blood-derived mononuclear cells. Acta Pharmacol Sin. 2007;28:367–374. doi: 10.1111/j.1745-7254.2007.00519.x. [DOI] [PubMed] [Google Scholar]
- 11.Ye YB, Chen T. Advances of study on angiogenesis and antiangiogenic therapy in hepatocellular carcinoma. Chin J Bases Clin General Sur. 2009;16:861–865. [Google Scholar]
- 12.Kraizer Y, Mawasi N, Seagal J, Paizi M, Assy N, Spira G. Vascular endothelial growth factor and angiopoietin in liver regeneration. Biochem Biophys Res Commun. 2001;287:209–215. doi: 10.1006/bbrc.2001.5548. [DOI] [PubMed] [Google Scholar]
- 13.Yang J, Chen MQ, Dong J. Progress in anti-tumor angiogenesis research with VEGF/VEGFR2 pathway as a target. World Chin J Digestol. 2007;15:3611–3616. [Google Scholar]
- 14.Zeng H, Wu G. Advances on the role of vascular endothelial growth factor receptor-2 in tumor angiogenesis. Tumo J Worl. 2006;5:286–291. [Google Scholar]
- 15.Tian X, Song S, Wu J, Meng L, Dong Z, Shou C. Vascular endothelial growth factor: acting as an autocrine growth factor for human gastric adenocarcinoma cell MGC803. Biochem Biophys Res Commun. 2001;286:505–512. doi: 10.1006/bbrc.2001.5409. [DOI] [PubMed] [Google Scholar]
- 16.Jemal A, Bray F, Center MM, Ferlay J, Ward E, Forman D. Global cancer statistics. CA Cancer J Clin. 2011;61:69–90. doi: 10.3322/caac.20107. [DOI] [PubMed] [Google Scholar]
- 17.Graells J, Vinyals A, Figueras A, Llorens A, Moreno A, Marcoval J, Gonzalez FJ, Fabra A. Overproduction of VEGF concomitantly expressed with its receptors promotes growth and survival of melanoma cells through MAPK and PI3K signaling. J Invest Dermatol. 2004;123:1151–1161. doi: 10.1111/j.0022-202X.2004.23460.x. [DOI] [PubMed] [Google Scholar]
- 18.Wan C, Cui F, Chen B, Luo RC. Antiangiogenesis agent bevacizumab blocks the promoting effect of vascular endothelial growth factor on proliferation of human hepatoma cell line HepG2. J Sec Milit Med Univ. 2008;29:1060–1064. [Google Scholar]
- 19.Chen C, Yu DC, Teng LS. Development of anti-tumor drugs targeting VEGF/VEGFR: a progress. Chin J Cancer Biotherap. 2007;14:291–295. 300. [Google Scholar]
- 20.Miao ZH, Feng JM, Ding J. Newly discovered angiogenesis inhibitors and their mechanisms of action. Acta Pharmacol Sin. 2012;33:1103–1111. doi: 10.1038/aps.2012.97. [DOI] [PMC free article] [PubMed] [Google Scholar]