Abstract
Many studies have focused on the association of tea consumption and the risk and progression of prostate cancer (PCa). However, the evidence is inadequate to draw robust conclusions. To shed light on these inconclusive findings, we conducted a meta-analysis. We searched the database of PubMed and Web of Science for eligible articles. The relevant data were abstracted by two independent reviewers and performed with Stata 11.0. 21 studies were included. The pooled outcomes showed that there was a significant association between tea consumption and PCa risk (OR=0.84, 95% CI (0.71-0.98)); tea consumption could reduce PCa risk in China and India (OR=0.40 and 0.48, 95% CI (0.25-0.66) and (0.24-0.97), respectively); both green and black tea consumption showed no significant effect on PCa risk (OR=0.73 and 0.95, 95% CI (0.52-1.02) and (0.82-1.11), respectively); the highest level tea consumption showed significant protective effect on the low-grade PCa (OR=0.66, 95% CI (0.46-0.93)); no significant effect was found in both localized and advanced PCa in stage subgroup analyses (OR=1.12 and 0.85, 95% CI (0.82-1.54) and (0.62-1.16), respectively). The results show that regardless of tea type, tea consumption might be a potential protective factor for the PCa, especially in China and India. Tea consumption might be the protective factor for low-grade PCa. However, more relevant studies are needed to further explore this association.
Keywords: Prostatic neoplasm, progression, tea, meta-analysis, dose-response
Introduction
Prostate cancer (PCa) is the second-most frequently diagnosed cancer in males around the word. It is also one of the leading causes of cancer death among men of all races [1]. Its etiology has been remained unclear, and there are few established risk factors for PCa reported other than older age, a positive family history, and race [2]. Recently, tea consumption is gained increasing attention.
Tea, one of the most common beverages consumed worldwide, is produced from the leaves of the plant Camellia sinensis. According to the differences in the manufacturing process, it could be classified into two main types, the green tea, which is non-fermented and more popular in China, Japan, and Korea, and the black tea, which is fermented and is the main tea beverage in the United States, Europe, and Western Asia.
Numerous previous studies in vitro and vivo indicated that tea and its components could affect not only the incidence but also the progression of PCa through its apoptosis-inducing, antioxidant properties, and any other ways [3-6]. However, these existing evidences are inadequate to draw robust conclusions because their results are not completely consistent and the range of tea consumption and the cut-offs for the categories differed between studies. So, we conduct the meta-analysis to study the association between the tea consumption and the risk and progression of PCa to shed light on these inconclusive findings.
Materials and methods
Search strategy
We searched the database of PubMed and Web of Science until Jun 2014 for the relevant studies about the association of tea consumption and PCa without language restrictions. The search terms include: tea, green tea, black tea, flavonoid, catechin, thearubigin, theaflavin, together with prostate cancer, prostate neoplasm, prostate tumor, prostate carcinoma or prostatic neoplasm.
Inclusion/exclusion criteria
The titles, abstracts, and full texts of the candidate studies were screened by two reviewers independently. The studies were considered inclusion, when met all of the criteria showed as follows: (1) it explored the association of tea consumption with the risk and progression of PCa; (2) it was a case-control or cohort study; (3) localized PCa: confined within prostate, stage T1-T2, N0, M0; advanced PCa: extraprostatic or metastatic cancer involving lymphnodes or other organs, stage T3-T4, N0-N1, M0-M1; low-grade PCa: Gleason score ≤ 6; high-grade PCa: Gleason score 7-10; (4) the data of the studies were completed or we could use them to calculate the person-years, odds ratio (OR), relative risk (RR), or hazard ratio (HR), and 95% confidence interval (CI) of the tea consumption in the studies; (5) the statistical methods were appropriate; (6) it was not repeated.
The decision to exclude any of these studies was made by the consensus of two reviewers (Fei XW and Shen YT). And any disagreements were arbitrated by discussion with the third reviewer (Li XG).
Data extraction
The data and information of the eligible studies were extracted by two reviewers (Fei XW and Shen YT) independently and verified for accuracy by the third reviewer (Li XG). For each included study, the following data was extracted: the title, fist author, study population, publication year, study type, tea type, the range of tea consumption, the number of sample, covariates controlled for by matching or multivariable analysis, the numbers of case/non-cases, total person-years and person-years in different exposure categories, OR, RR, or HR, and 95% CI of the tea consumption in each study. For studies that reported several multivariable adjusted RRs (ORs or HRs), we selected the effect estimate that adjusted for potential confounders.
Quality assessment
We used the Newcastle-Ottawa Scale (NOS) to assess the quality of each eligible study. When met one item, the study got one score. The NOS arranged from zero up to nine scores. The study was considered high quality, if got more than four scores [7].
Statistical analysis
The DerSimonianand Laird random-effect model was used to combine the OR estimates. We used OR as the common measure of risk estimate across studies and considered HR and RR as OR because of the low absolute risk of cancer [8]. Study-specific estimates regarding the highest vs. non/lowest tea consumption were extracted from the studies. And the results were considered significant when a two-sided P value was less than 0.05 in the Z test. Heterogeneity was tested by the Cochran’s Q statistic and I2 test at the level of a=0.1. Subgroup analyses were conducted to identify possible variables or characteristics moderating the results obtained. Sensitive analyses in which one study at a time was excluded were conducted to evaluate the influence of an individual study on the results. Begg’s funnel plot and Egger’s regression test were used to evaluate the publication bias (There was no publication bias, when a two-sided P value was equal to or more than 0.05).
To assess exposure levels, we converted all measures into cups per day and defined 250 ml of tea as one cup regardless of tea type unless it was well established in a specific study population or a geographical area and as some Chinese studies reported the amount of tea leaves consumed as the measure of tea consumption, we regarded consumption of 150 g tea beverages equivalent to one cup, as described previously [9]. If the study reported tea consumption as number of times, we regarded one time as one cup. And if the studies reported tea consumption by cups per month or cups per week, we redefined these exposure categories as cups per day by multiplying with 1/30 or 1/7, respectively.
Two-stage dose-response analysis was conducted, which estimates study-specific slopes and 95% CIs from the natural logs of the RR/OR/HR estimates and CIs across tea consumption categories [9]. According to the requirement of the method, studies with at least 3 quantitative exposure categories were included. Pooling of RRs from each study requires the exposure levels and distribution of cases and person-years or non-cases in each category of tea consumption. However, not all studies reported the distributions of cases and person-years or non-cases for exposure categories. Montague’s study did not report person-years for each category and instead reported the total person-years [10]. We estimated the distribution of person-years for each category of it by using the methods described by Aune [11]. The median or mean tea consumption in each category was used for the dose-response analysis. If a study did not report the median of the exposure category, we assigned the level of tea consumption to categories based on the calculated midpoint of tea consumption. When the highest category was open-ended, we assumed the dose as 1.2 times the lowest bound of this category; when the lowest category was open-ended, we treated zero as the lowest bound [12]. We also tested the nonlinear relationship between tea consumption and PCa risk by modelling tea consumption levels by using restricted cubic splines with 4 knots at fixed percentiles (5%, 35%, 65%, 95%) of the distribution as described by Larsson and Orsini [13,14]. A P value for nonlinearity was calculated by testing the null hypothesis that the coefficient of the second and third spline was equal to zero.
All analyses were conducted using Stata v.11.0 software, and a two-sided P value equal to or more than 0.05 means there was no significance.
Results
Literature search
The process of study selection was shown in Figure 1. 1823 studies were identified in the primary literature search. After screening the titles and abstracts, 1781 studies were excluded. Among them, 465 studies were reviews and meta-analyses, and 1316 studies were non-relevant. 42 studies remained for further evaluation with the full texts. After examining those studies in details, 21 studies were excluded due to duplications and insufficient data. We had tried to contact with the correspondence author, but in vain. As a result, 21 studies were included in the meta-analysis [5,15-33,10], among which 8 studies were cohort studies [10,15,17,19,24-27], and 13 were case-control studies [5,16,18,20-23,28-33]. If the studies provided follow-up years, tea type or other stratifications, it would be regarded as more than one study.
Figure 1.
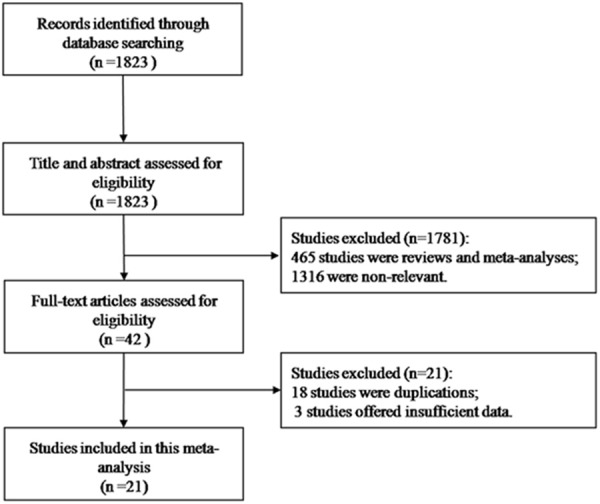
Flow diagram for selection process of the study.
Characters and assessments of involved studies
21 studies were included, 8 cohort studies involving 4872 cases among 137201 individuals and 13 case-control studies involving 5190 cases among 17424 individuals (Table 1). All the eligible studies were assessed by the NOS (Table 2). The score of each of them was more than four. It meant that all of the studies had high quality.
Table 1.
Characteristics of studies on tea consumption and PCa risk
| Reference | Study type | Country | Non/lowest | Highest | Tea type | OR/RR/HR & 95% CI |
|---|---|---|---|---|---|---|
| Slattery et al. (1993) [5] | PCCb | USA | 0 cup/week | > 5 cups/week | NS | > 67 years 0.9 (0.59, 1.36) |
| PCC | USA | 0 cup/week | > 5 cups/week | NS | ≤ 67 years 1.06 (0.72, 1.57) | |
| Montague et al. (2012) [10] | cohort | Singapore | None | ≥ 2 cup/day | Green | 0.95 (0.62, 1.45) |
| None | ≥ 2 cup/day | Black | 1.17 (0.67, 2.07) | |||
| Allen et al. (2004) [15] | cohort | Japan | < 1/week | 5+/week | Green | 1.29 (0.84, 1.98) |
| < 2/week | daily | Black | 0.86 (0.47, 1.59) | |||
| Berroukche et al. (2012) [16] | HCC | Western Algeria | ≤ 1 cup/day | > 6 cup/day | Green | 0.6 (0.3, 1.1) |
| Ellison (2000) [17] | cohort | Canada | 0 ml/day | > 750 ml/day | Black | 1.03 (0.58, 1.82) |
| Ganesh et al. (2011) [18] | HCC | Indian | No | Yes | NS | 0.7 (0.1, 3.4) |
| Geybels et al. (2013) [19] | cohort | Dutch/Netherland | ≤ 1 cup/day | ≥ 5 cup/day | Black | 0.97 (0.80, 1.17) |
| Geybels et al. (2013) [20] | PCC | Canada/USA | ≤ 1 /week | ≥ 2 cup/day | Black | 0.63 (0.45, 0.90) |
| Hu et al. (2014) [21] | HCCa | China | No | Yes | NS | 0.586 (0.360, 0.952) |
| Jain et al. (1998) [22] | PCC | Canada | 0 g/day | > 500 g/day | NS | 0.70 (0.50, 0.99) |
| Jian et al. (2004) [23] | HCC | China | 0 g/day No | ≥ 5 g/day Yes | Green Green + Black | 0.10 (0.04, 0.23) 0.474 (0.166,1.351) |
| Kikuchi et al. (2006) [24] | cohort | Japan | < 1 cup/day | ≥ 5 cup/day | Green | 0.85 (0.50, 1.43) |
| Kurahashi et al. (2008) [25] | cohort | Japan | < 1 cup/day | ≥ 5 cup/day | Green | 0.90 (0.66, 1.23) |
| Severson et al. (1989) [26] | cohort | USA | No | Ever | Green | 1.47 (0.99, 2.19) |
| No | Ever | Black | 0.83 (0.61, 1.13) | |||
| Shafique et al. (2012) [27] | cohort | Scottish | 0-3 cup/day | ≥ 7 cup/day | Black | 1.50 (1.06, 2.12) |
| Sharpe et al. (2002) [28] | PCC | Canada | Never | ≥ 5 cup/day | Black | 1.9 (1.0, 3.4) |
| Sonoda et al. (2004) [29] | HCC | Japan | ≤ 1 cup/day | ≥ 10 cup/day | Green | 0.67 (0.27, 1.64) |
| 0 cup/day | ≥ 1 cup/day | Black | 1.51 (0.89, 2.56) | |||
| Tyagi et al. (2010) [30] | PCC | Indian | No | Yes | NS | 0.45 (0.21, 0.97) |
| Villeneuve et al. (1999) [31] | PCC | Canada | None | ≥ 4 cup/day | NS | 1.1 (0.8, 1.5) |
| No | Yes | NS | 0.28 (0.17-0.47) | |||
| Wu et al. (2009) [32] | HCC | China | None | Ever | Green | 0.52 (0.28, 0.96) |
| None | Ever | Black | 0.55 (0.23, 1.31) | |||
| None | Ever | Oolong | 0.73 (0.39, 1.37) | |||
| Vecchia et al. (1992) [33] | HCC | Italy | None | ≥ 1 cup/day | NS | 0.9 (0.5, 1.7) |
HCC: Hospital-based case-control;
PCC: Population-based case-control.
Table 2.
Quality assessment of eligible studies in Meta-analysis
| Reference | Adjustments | Score |
|---|---|---|
| Slattery et al. (1993) [5] | Dietary intake, body size, age within strata, and demographic characteristics did not alter these association | 8 |
| Montague et al. (2012) [10] | Age, dialect group, interview year, education, BMI, smoking history | 8 |
| Allen et al. (2004) [15] | Age, calendar period, city of residence, radiation dose and education level | 7 |
| Berroukche et al. (2012) [16] | Total energy intake, tobacco smoking and family history of PCa | 7 |
| Ellison (2000) [17] | Age, coffee, cola, total alcohol, beer, wine, spirits, smoking status, pack-year smoking, BMI, highest education level attained, respondent status, intake of fiber, fat, calories | 8 |
| Ganesh et al. (2011) [18] | Age, religion and education | 6 |
| Geybels et al. (2013) [19] | Age | 8 |
| Geybels et al. (2013) [20] | Age, race, first-degree family history of PCa, smoking status, and history of PCa screening | 6 |
| Hu et al. (2014) [21] | Un-adjustment | 6 |
| Jain et al. (1998) [22] | Age (continuous) and total energy intake | 7 |
| Jian et al. (2004) [23] | Age at interview, locality, education, family income, BMI, physical activity, alcohol consumption, tobacco smoking, total fat intake, marital status, age at marriage, number of children, vasectomy, family history of PCa | 7 |
| Kikuchi et al. (2006) [24] | Age, BMI, alcohol consumption, smoking status, marital status, daily calorie intake, daily calcium intake, walking duration, consumption frequencies of black tea and coffee and consumption frequencies of fish | 8 |
| Kurahashi et al. (2008) [25] | Age, area, smoking status, alcohol consumption, BMI, marital status, and coffee, black tea, and miso soup consumption | 7 |
| Severson et al. (1989) [26] | Age | 7 |
| Shafique et al. (2012) [27] | Age, BMI, smoking status, coffee consumption, alcohol intake, cholesterol level, systolic blood pressure, social class, years of full-time education | 7 |
| Sharpe et al. (2002) ([28)] | Age, ethnicity, respondent status, family income, BMI, cumulative cigarette smoking, and cumulative alcohol consumption | 5 |
| Sonoda et al. (2004) [29] | Cigarette smoking and energy intake | 5 |
| Tyagi et al. (2010) [30] | Un-adjustment | 7 |
| Villeneuve et al. (1999) [31] | Age, province of residence, race, years since quitting smoking, cigarette pack-years, BMIa, rice and pasta, coffee, grains and cereals, alcohol, fruit and fruit juices, tofu, meat, income, and family history of cancer | 8 |
| Wu et al. (2009) [32] | Un-adjustment | 7 |
| Vecchia et al. (1992) [33] | Age, are of residence, education, smoking, and coffee consumption | 6 |
BMI: body mass index.
The PCa risk assessment between the highest vs. non/lowest tea consumption
Figure 2 showed that there was a significant association between tea consumption and the risk of PCa (OR=0.84, 95% CI (0.71-0.98), P for heterogeneity < 0.001) [5,10,15-20,24-33]. Sensitivity analysis was performed to evaluate the effect of a single study on the overall estimate by sequentially excluding each study. We found that most studies could possibly not influence the overall risk estimate except the study by Jian [23] (Figure 3). The Begg’s and Egger’s test were performed to assess the publication bias. As shown in Figures 4 and 5, there was no publication bias in the meta-analyses of the association between tea consumption and PCa risk (P for Begg’s test=0.058, P for Egger’s test=0.114).
Figure 2.
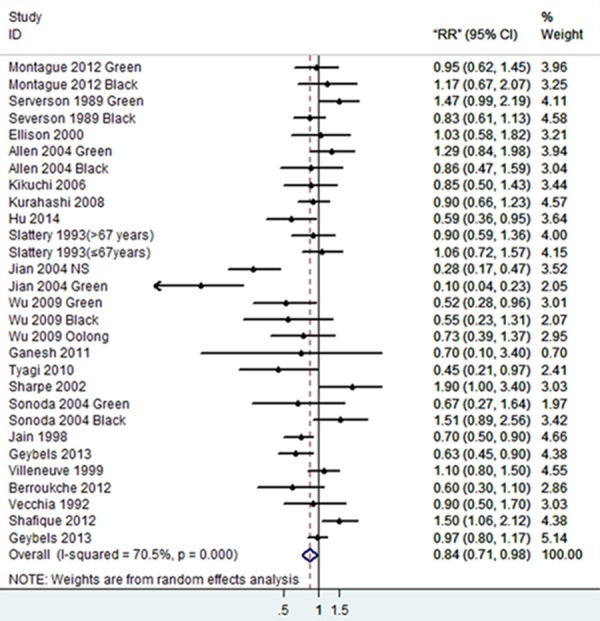
Forest plot showing risk estimates for the association between tea consumption and PCa risk.
Figure 3.
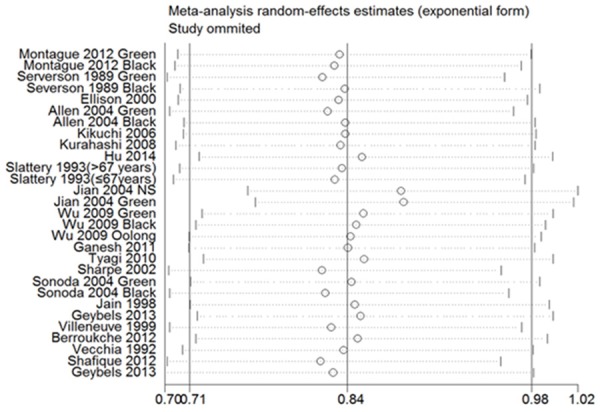
Sensitivity analysis demonstrates the influence of a single study to overall estimate.
Figure 4.
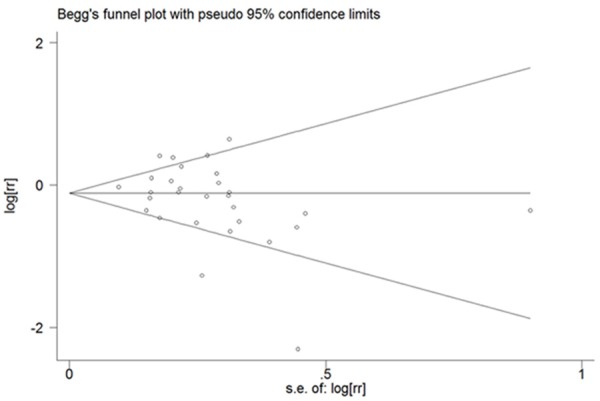
Begg’s test for publication bias of all studies on the association between tea consumption and PCa risk.
Figure 5.
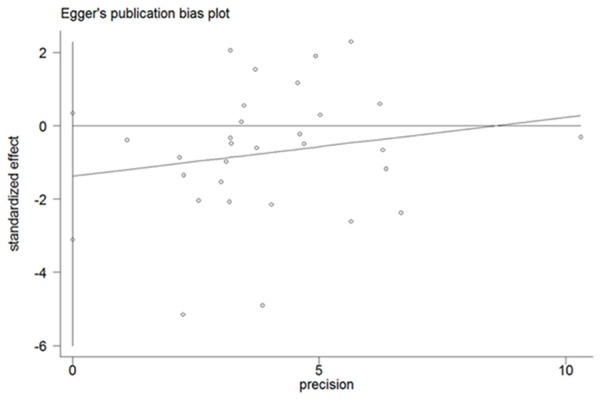
Egger’s test for publication bias of all studies on the association between tea consumption and PCa risk.
The PCa risk subgroup analyses between the highest vs. non/lowest tea consumption
The subgroup analyses were performed according to the region, tea type and study type, which were shown in Table 3. In the region-subgroup analyses, tea consumption could reduce PCa risk in China [21,23,32] and India [18,30] (OR=0.40 and 0.48, 95% CI (0.25-0.66) and (0.24-0.97), respectively); when stratified by tea type, both green tea [10,15,16,21,23,24,26,29,32] and black tea consumption [5,10,15,17-20,22,26-33] showed no significant effect on the PCa risk (OR=0.73 and 0.95, 95% CI (0.52-1.02) and (0.82-1.11), respectively); When stratified by study type, the case-control studies showed a protective effect of tea consumption against PCa (OR=0.69, 95% CI (0.54-0.88)) [5,16,18,20-22,28-33], while the summary of cohort studies [10,15,17,19,24-27] showed no significant association between them (OR=1.04, 95% CI (0.92-1.19)).
Table 3.
The subgroup analyses of tea consumption and PCa risk
| Studies (n) | OR (95% CI) | Test for heterogeneity | Test for publish bias | |||
|---|---|---|---|---|---|---|
|
| ||||||
| P | I2 (%) | P egger’s | P begg’s | |||
| All studies | 29 | 0.84 (0.71, 0.98)* | < 0.001 | 70.5% | 0.114 | 0.058 |
| Region | ||||||
| Japan | 6 | 1.01 (0.82, 1.25) | 0.360 | 8.8% | 0.842 | 1.000 |
| Singapore | 2 | 1.02 (0.73, 1.44) | 0.563 | 0.0% | - | - |
| China | 6 | 0.40 (0.25, 0.66)* | 0.003 | 72.8% | 0.521 | 0.452 |
| USA | 4 | 1.02 (0.80, 1.32) | 0.148 | 43.9% | 0.424 | 0.734 |
| Canada | 5 | 0.94 (0.67, 1.31) | 0.007 | 71.8% | 0.335 | 0.806 |
| India | 2 | 0.48 (0.24, 0.97)* | 0.652 | 0.0% | - | - |
| Tea type | ||||||
| Green | 10 | 0.73 (0.52, 1.02) | < 0.001 | 77.7% | 0.031 | 0.049 |
| black | 17 | 0.95 (0.82, 1.11) | 0.01 | 50.2% | 0.967 | 0.710 |
| Study design | ||||||
| Cohort | 11 | 1.04 (0.92, 1.19) | 0.233 | 22.1% | 0.573 | 0.640 |
| Case-Control | 18 | 0.69 (0.54, 0.88)* | < 0.001 | 74.4% | 0.230 | 0.272 |
There is a significant difference;
“-”: It is not applicable.
We performed the sensitivity analysis and found that most studies could possibly not influence the risk estimate except the study by Jian [23], showed in Figure 6. And the Egger’s and Begg’s test revealed that there was no publication bias in most subgroup analyses, except the green tea subgroup analysis, which showed a slightly bias (P for Begg’s test=0.049, P for Egger’s test=0.031). It was maybe due to the study [23].
Figure 6.
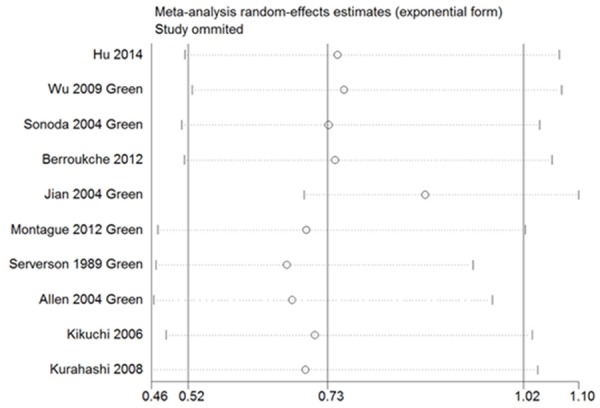
Sensitivity analysis demonstrates the influence of a single study to green tea subgroup estimate.
The progression of PCa between the highest vs. non/lowest consumption
The meta-analyses of PCa progression between the highest vs. non/lowest tea consumption level indicated that when stratified by Gleason score [20,27], the highest level tea consumption showed significant protective effect on the low-grade PCa (OR=0.66, 95% CI (0.46-0.93)), while no statistical effect on the high-grade PCa (OR=1.06, 95% CI (0.47, 2.38)). And on significant effect was found in both localized PCa [25,10,19,20] and advanced PCa [25,10,19,20,5] in stage subgroup analyses (OR=1.12 and 0.85, 95% CI (0.82-1.54) and (0.62-1.16), respectively) (Table 4).
Table 4.
The meta-analyses of tea consumption and PCa progression
| Studies (n) | OR (95% CI) | Test for heterogeneity | Test for publish bias | |||
|---|---|---|---|---|---|---|
|
| ||||||
| P | I2 (%) | P egger’s | P begg’s | |||
| Gleason Score | ||||||
| Low-grade PCa | 2 | 0.66 (0.46, 0.93)* | 0.891 | 0.0% | - | - |
| High-grade PCa | 3 | 1.06 (0.47, 2.38) | 0.055 | 65.6% | - | - |
| Stage | ||||||
| Localized PCa | 5 | 1.12 (0.82, 1.54) | 0.016 | 67.0% | 0.627 | 0.462 |
| Advanced PCa | 7 | 0.85 (0.62, 1.16) | 0.055 | 51.4% | 0.664 | 0.764 |
There is a significant difference;
“-”: It is not applicable.
There was no publication bias in the meta-analyses of the association between tea consumption and both localized PCa and advanced PCa. And due to the small quantity of included studies, the Egger’s test and Begg’s test for the low-grade and high-grade PCa were not performed (Table 4).
The dose-response meta-analysis of tea consumption and PCa risk
The dose-response meta-analyses involving 7 cohort studies [10,15,17,19,24,25,27] and 8 case-control studies [5,16,20,22,23,28,29,31] showed that there were significant dose-response relationships between tea consumption and PCa risk (P for case-control subgroup was 0.028, and for cohort subgroup was 0.027). Neither in the cohort nor case-control subgroup, there was no evidence of a potential nonlinear relationship (P for nonlinearity was 0.37 and 0.38, respectively) between tea consumption level and risk of PCa. However, as shown in Figures 7 and 8, there was a weak trendency that tea consumption less than 4 cups/day seemed to decrease the risk of PCa.
Figure 7.
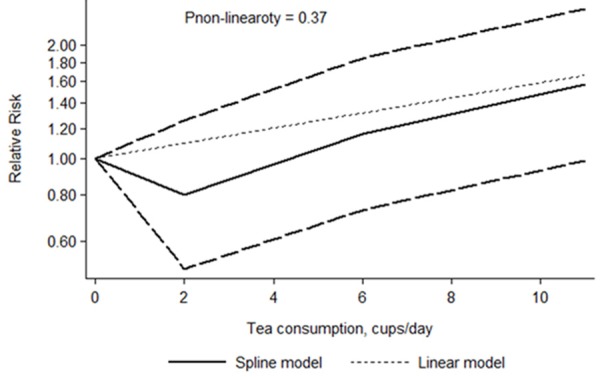
Dose-response relations between tea consumption and PCa risk in cohort studies.
Figure 8.
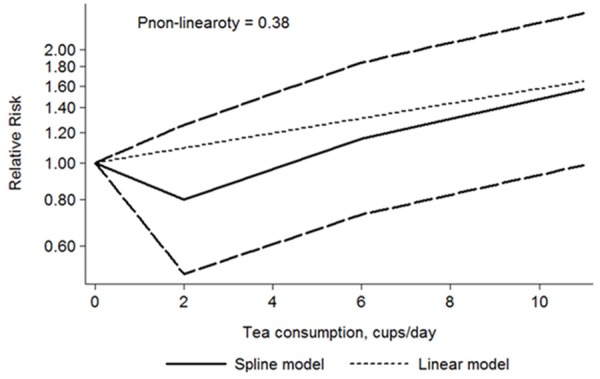
Dose-response relations between tea consumption and PCa risk in case-control studies.
Discussion
PCa is the second most common cause of cancer worldwide after lung cancer. Despite many advances in the treatment of it, little is known about the etiological factors associated with its development and progression. Increasing studies indicated that the changes in the gene pool or environments were not the major contributing factors, and the dietary factors might play a crucial role in PCa biology and tumourigenesis.
As one of the most common beverages consumed worldwide, tea has gained increasing attention. Numerous studies suggested that tea consumption had potential benefit in helping to reduce incidence rate and slow progression of PCa. And the epigallocatechin-3-gallate (EGCG), one kind of tea catechins, showed it could inhibit prostate tumor growth and increases survival in mice [34,35], might play the main roles. Because of its different content in black tea and green tea, these two tea types present different effects on prostate carcinogenesis [36,37]. The green tea consumption might be a protective factor, while the black tea, relative to green tea, containing lower EGCG, might be a risk factor of PCa [24,27,28,32]. But it was still inconsistent [15,20]. The overall pooled outcomes in our meta-analysis revealed that when compared to none/lowest level tea consumption, highest level tea consumption could reduce the risk of PCa. But no statistical association was found with both green tea and black tea consumption. From the above, these findings indicated that regardless of tea type, tea consumption might be a potential protective factor for the PCa.
In addition, in order to verify the conclusions deeply, subgroup analyses were performed according to region and study type. Our outcomes suggested that tea consumption presented a preventive effect on PCa in China and India. And apart from this, subgroup analysis also revealed that case-control studies rather than cohort studies presented significant inverse association between tea consumption and PCa risk. It might be due to the fact that all the studies of China and India were case-control studies. Thus the protective role of tea consumption became stronger in case-control subgroup. And our findings were consistent with previous meta-analyses [38].
For further exploring the association between tea consumption and the progression of PCa, the subgroup analyses based on the Gleason score and stage were conducted. The pooled outcomes showed that most stratified analyses presented no significant association of tea consumption with PCa, except the summary of low-grade studies. It demonst-rated inverse association between them, which was not consistent with previous studies that showed protective effects of tea catechins on high-risk men with high-grade prostate intraepithelial neoplasia [39]. Our findings hinted that tea consumption might be not associated with PCa stage. But for the Gleason score, it could play a protective role in low-grade PCa. However, the number of included studies was too small to draw a solid conclusion, therefore more relevant randomized controlled trials or large prospective cohort studies are needed to further explore this association.
When compared with previous meta-analyses, our meta-analysis has two strengths. First, we assessed the association of tea consumption with Gleason score and stage of PCa at first time. Second, we performed the dose-response analyses not only in cohort studies but also in case-control studies, which included a wide range of tea consumption and allowed a concrete and quantitative assessment of the association between tea consumption and PCa risk.
However, although our study showed positive results, there are several limitations in this meta-analysis, which should be taken consideration when assess the results of it. First, some included studies did not provide the exact tea type, and although we have used the adjusted estimates, the adjusted criteria for OR/RR/HR differed between studies, which could bias our conclusions. Second, in most studies, tea consumption level is mostly assessed as the number of cups of tea consumed daily, weekly or monthly. However, cup size may vary considerably for different countries or areas and the dry tea leaves brewed in each cup may also be different. In addition, the cut-offs for the highest consumption level also varied across different studies. Therefore, there might be some inevitable measurement errors and possible uncontrolled confounding factors when assessing the association of tea consumption with PCa. Third, because of the insufficient information, the dose-response analysis was not performed for the localized and advanced PCa. And the number of studies, which were included in low-grade and high-grade subgroup analyses, was too small to gain solid conclusions, therefore more relevant studies are needed to further explore this association.
Conclusion
To sum up, our meta-analysis suggested that regardless of tea type, tea consumption might be a potential protective factor for the PCa, especially in China and India. Tea consumption might play a protective role in low-grade PCa. However, because of the small number of included studies, more relevant studies are needed to further explore this association.
Acknowledgements
Supported by “the Science and Technology Project of Nanjing” grant: YKK08060.
Disclosure of conflict of interest
None.
References
- 1.Faezeh A, Mehdi KP, Mahsa J, Bahram R. Fruit and Vegetable Intake in Relation to Prostate Cancer in Iranian Men: A Case-Control Study. Asian Pac J Cancer Prev. 2014;15:5317–24. doi: 10.7314/apjcp.2014.15.13.5223. [DOI] [PubMed] [Google Scholar]
- 2.Shavers VL, Underwood W, Moser RP. Race/ethnicity and the perception of the risk of developing prostate cancer. Am J Prev Med. 2009;37:64–67. doi: 10.1016/j.amepre.2009.03.007. [DOI] [PMC free article] [PubMed] [Google Scholar]
- 3.Caporali A, Davalli P, Astancolle S, D’Arca D, Brausi M, Bettuzzi S, Corti A. The chemopreventive action of catechins in the TRAMP mouse model of prostate carcinogenesis is accompanied by clusterin overexpression. Carcinogenesis. 2004;25:2217–2224. doi: 10.1093/carcin/bgh235. [DOI] [PubMed] [Google Scholar]
- 4.Adhami VM, Mukhtar H. Polyphenols from green tea and pomegranate for prevention of prostate cancer. Free Radic Res. 2006;40:1095–1104. doi: 10.1080/10715760600796498. [DOI] [PubMed] [Google Scholar]
- 5.Slattery ML, West DW. Smoking, alcohol, coffee, tea, caffeine, and theobromine: risk of prostate cancer in Utah (United States) Cancer Causes Control. 1993;4:559–63. doi: 10.1007/BF00052432. [DOI] [PubMed] [Google Scholar]
- 6.Shimizu M, Adachi S, Masuda M, Kozawa O, Moriwaki H. Cancer chemoprevention with green tea catechins by targeting receptor tyrosine kinases. Mol Nutr Food Res. 2011;55:832–843. doi: 10.1002/mnfr.201000622. [DOI] [PubMed] [Google Scholar]
- 7.Ownby RL, Crocco E, Acevedo A, John V, Loewenstein D. Depression and risk for Alzheimer disease: systematic review, meta-analysis, and metaregression analysis. Arch Gen Psychiatry. 2006;63:530–538. doi: 10.1001/archpsyc.63.5.530. [DOI] [PMC free article] [PubMed] [Google Scholar]
- 8.Greenland S. Quantitative methods in the review of epidemiologic literature. Epidemiol Rev. 1987;9:1–30. doi: 10.1093/oxfordjournals.epirev.a036298. [DOI] [PubMed] [Google Scholar]
- 9.Tang NP, Wu YM, Zhou B, Wang B, Yu RB. Green tea, black tea consumption and risk of lung cancer: a meta-analysis. Lung Cancer. 2009;65:274–283. doi: 10.1016/j.lungcan.2008.12.002. [DOI] [PubMed] [Google Scholar]
- 10.Montague JA, Butler LM, Wu AH, Genkinger JM, Koh WP, Wong AS, Wang R, Yuan JM, Yu MC. Green and black tea intake in relation to prostate cancerrisk among Singapore Chinese. Cancer Causes Control. 2012;23:1635–1641. doi: 10.1007/s10552-012-0041-8. [DOI] [PMC free article] [PubMed] [Google Scholar]
- 11.Aune D, Greenwood DC, Chan DS, Vieira R, Vieira AR, Navarro Rosenblatt DA, Cade JE, Burley VJ, Norat T. Body mass index, abdominal fatness and pancreatic cancer risk: a systematic review and non-linear dose-response meta-analysis of prospective studies. Ann oncol. 2012;23:843–852. doi: 10.1093/annonc/mdr398. [DOI] [PubMed] [Google Scholar]
- 12.Mao Q, Lin Y, Zheng X, Qin J, Yang K, Xie LP. A meta-analysis of alcohol intake and risk of bladder cancer. Cancer Causes Control. 2010;21:1843–1850. doi: 10.1007/s10552-010-9611-9. [DOI] [PubMed] [Google Scholar]
- 13.Larsson SC, Orsini N. Coffee consumption and risk of stroke: a dose-response meta-analysis of prospective studies. Am J Epidemiol. 2011;174:993–1001. doi: 10.1093/aje/kwr226. [DOI] [PubMed] [Google Scholar]
- 14.Larsson SC, Orsini N, Wolk A. Dietary magnesium intake and risk of stroke: a meta-analysis of prospective studies. Am J Clin Nutr. 2012;95:362–366. doi: 10.3945/ajcn.111.022376. [DOI] [PubMed] [Google Scholar]
- 15.Allen NE, Sauvaget C, Roddam AW, Appleby P, Nagano J, Suzuki G, Key TJ, Koyama K. A prospective study of diet and prostate cancer in Japanese men. Cancer Causes Control. 2004;15:911–920. doi: 10.1007/s10552-004-1683-y. [DOI] [PubMed] [Google Scholar]
- 16.Berroukche A, Bendahmane M, Kandouci B. Association of diet with the risk of prostate cancer in Western Algeria. Oncologie. 2012;14:674–678. [Google Scholar]
- 17.Ellison LF. Tea and other beverage consumption and prostate cancer risk: a Canadian retrospective cohort study. Eur J Cancer Prev. 2000;9:125–130. doi: 10.1097/00008469-200004000-00009. [DOI] [PubMed] [Google Scholar]
- 18.Ganesh B, Saoba SL, Sarade MN, Pinjari SV. Risk factors for prostate cancer: An hospital-based case-control study from Mumbai, India. Indian J Urol. 2011;27:345–350. doi: 10.4103/0970-1591.85438. [DOI] [PMC free article] [PubMed] [Google Scholar]
- 19.Geybels MS, Neuhouser ML, Stanford JL. Associations of tea and coffee consumption with prostate cancer risk. Cancer Causes Control. 2013;24:941–948. doi: 10.1007/s10552-013-0170-8. [DOI] [PMC free article] [PubMed] [Google Scholar]
- 20.Geybels MS, Verhage BA, Arts IC, van Schooten FJ, Goldbohm A, van den Brandt PA. Dietary flavonoid intake, black tea consumption, and risk of overall and advanced stage prostate cancer. Am J Epidemiol. 2013;177:1388–1398. doi: 10.1093/aje/kws419. [DOI] [PubMed] [Google Scholar]
- 21.Hu JP, Zhen Q, Zhang LS, Cui FL. Kallikrein 3 and vitamin D receptor polymorphisms: potentials environmental risk factors for prostate cancer. Diagn Pathol. 2014;9:84. doi: 10.1186/1746-1596-9-84. [DOI] [PMC free article] [PubMed] [Google Scholar]
- 22.Jain MG, Hislop GT, Howe GR, Burch JD, Ghadirian P. Alcohol and other beverage use and prostate cancer risk among Canadian men. Int J Cancer. 1998;78:707–711. doi: 10.1002/(sici)1097-0215(19981209)78:6<707::aid-ijc7>3.0.co;2-2. [DOI] [PubMed] [Google Scholar]
- 23.Jian L, Xie LP, Lee AH, Binns CW. Protective effect of green tea against prostate cancer: a case-control study in southeast China. Int J Cancer. 2004;108:130–135. doi: 10.1002/ijc.11550. [DOI] [PubMed] [Google Scholar]
- 24.Kikuchi N, Ohmori K, Shimazu T, Nakaya N, Kuriyama S, Nishino Y, Tsubono Y, Tsuji I. No association between green tea and prostate cancer risk in Japanese men: the Ohsaki Cohort Study. Br J Cancer. 2006;95:371–373. doi: 10.1038/sj.bjc.6603230. [DOI] [PMC free article] [PubMed] [Google Scholar]
- 25.Kurahashi N, Sasazuki S, Iwasaki M, Inoue M, Tsugane S. Green tea consumption and prostate cancer risk in Japanese men: a prospective study. Am J Epidemiol. 2008;167:71–77. doi: 10.1093/aje/kwm249. [DOI] [PubMed] [Google Scholar]
- 26.Severson RK, Nomura AM, Grove JS, Stemmermann GN. A prospective study of demographics, diet, and prostate cancer among men of Japanese ancestry in Hawaii. Cancer Res. 1989;49:1857–1860. [PubMed] [Google Scholar]
- 27.Shafique K, McLoone P, Qureshi K, Leung H, Hart C, Morrison DS. Tea consumption and the risk of overall and grade specific prostate cancer: a large prospective cohort study of Scottish men. Nutr Cancer. 2012;64:790–797. doi: 10.1080/01635581.2012.690063. [DOI] [PubMed] [Google Scholar]
- 28.Sharpe CR, Siemiatycki J. Consumption of non-alcoholic beverages and prostate cancer risk. Eur J Cancer Prev. 2002;11:497–501. doi: 10.1097/00008469-200210000-00013. [DOI] [PubMed] [Google Scholar]
- 29.Sonoda T, Nagata Y, Mori M, Miyanaga N, Takashima N, Okumura K, Goto K, Naito S, Fujimoto K, Hirao Y, Takahashi A, Tsukamoto T, Fujioka T, Akaza H. A case-control study of diet and prostate cancer in Japan: possible protective effect of traditional Japanese diet. Cancer Sci. 2004;95:238–242. doi: 10.1111/j.1349-7006.2004.tb02209.x. [DOI] [PMC free article] [PubMed] [Google Scholar]
- 30.Tyagi B, Manoharan N, Raina V. A case control study on prostate cancer in Delhi. Asian Pac J Cancer Prev. 2010;11:397–401. [PubMed] [Google Scholar]
- 31.Villeneuve PJ, Johnson KC, Kreiger N, Mao Y. Risk factors for prostate cancer: results from the Canadian National Enhanced Cancer Surveillance System. The Canadian Cancer Regi- stries Epidemiology Research Group. Cancer Causes Control. 1999;10:355–367. doi: 10.1023/a:1008958103865. [DOI] [PubMed] [Google Scholar]
- 32.Wu YJ, Liang CH, Zhou FJ, Gao X, Chen LW, Liu Q. A case-control study of environmental and genetic factors and prostate cancer in Guangdong. Zhonghua Yu Fang Yi Xue Za Zhi. 2009;43:581–585. [PubMed] [Google Scholar]
- 33.La Vecchia C, Negri E, Franceschi S, D’Avanzo B, Boyle P. Tea consumption and cancer risk. Nutr Cancer. 1992;17:27–31. doi: 10.1080/01635589209514170. [DOI] [PubMed] [Google Scholar]
- 34.Graham HN. Green tea composition, consumption, and polyphenol chemistry. Prev Med. 1992;21:334–350. doi: 10.1016/0091-7435(92)90041-f. [DOI] [PubMed] [Google Scholar]
- 35.Liao S, Umekita Y, Guo J, Kokontis J, Hiipakka R. Growth inhibition and regression of human prostate and breast tumors in athymic mice by tea epigallocatechin gallate. Cancer Lett. 1995;96:239–243. doi: 10.1016/0304-3835(95)03948-v. [DOI] [PubMed] [Google Scholar]
- 36.Balentine DA, Wiseman SA, Bouwens LC. The chemistry of tea flavonoids. Crit Rev Food Sci Nutr. 1997;37:693–704. doi: 10.1080/10408399709527797. [DOI] [PubMed] [Google Scholar]
- 37.Wang ZY, Huang MT, Lou YR, Xie JG, Reuhl KR, Newmark HL, Ho CT, Yang CS, Conney AH. Inhibitory effects of black tea, green tea, decaffeinated black tea, and decaffeinated green tea on ultraviolet B light-induced skin carcinogenesis in 7, 12-dimethylbenz[a] anthracene-initiated SKH-1 mice. Cancer Res. 1994;54:3428–3435. [PubMed] [Google Scholar]
- 38.Zheng J, Yang B, Huang T, Yu Y, Yang J, Li D. Green tea and black tea consumption and prostate cancer risk: an exploratory meta-analysis of observational studies. Nutr Cancer. 2011;63:663–672. doi: 10.1080/01635581.2011.570895. [DOI] [PubMed] [Google Scholar]
- 39.Maurizio B, Saverio B, Giancarlo P, Federica R, Arnaldo C. Inhibition of human prostate cancer progression by administration of green tea catechins: a two years later follow-up update. J Urology. 2008;179:224–224. [Google Scholar]


