

Abstract
Although the mortality of cerebrovascular disease (CVD) has been steadily declined in the European Union (EU), CVD remains among the major causes of death in EU. As risk factors such asobesity and diabetes mellitus are increasing, the trends of European CVD mortality remains unknown. To understand the variation in CVD mortality of different EU countries, we studied the trends in CVD mortality in EU countries over the last three decades between males and females. Age- and sex-specific mortality rates between 1980 and 2011 were calculated by data from the WHO mortality database. Joinpoint software was used to calculate annual percentage changes and to characterize trends in mortality rates over time. Our study showed that between 1980 and 2011, CVD mortality significantly decreased in both men and women across all age groups. The specific mortality trends varied largely between EU countries. The plateau trend was observed in little regions at different age groups, however, the EU as a whole displayed declined trend CVD mortality. During the last three decades, CVD mortality decreased substantially in the entire population of EU. However, despite this overall decline in CVD mortality, several areas were identified as having no change in their CVD mortality rates at different period. The whole EU needs to establish strict prevention measures toreduce the incidence of CVD risk factors.
Keywords: Cerebrovascular disease, mortality, trends
Introduction
Cerebrovascular disease (CVD) is the second leading cause of death after ischemic heart disease worldwide [1]. The age-standardized death rates (per 100 000) of CVD declined by 19.5 percent from 105.7 deaths (per 100 000) in 1990 to 88.4 deaths (per 100 000) worldwide in 2010 [2-4]. Similar trends has also been identified in some countries in the European Region (EU) [5,6]. This decrease is largely due to declines in CVD risk factors, such as smoking, and improved health care [7]. However, many other risk factors, such asobesity and diabetes mellitus, have significantly increased [8-10]. Due to the high prevalence of many of those risk factors increasing CVD,it has been predicted that the declining trends in CVD mortality will stop. Furthermore, the leveling off mortality trends have already detected in coronary heart disease (CHD) in England, Walesand Germany [11,12]. CHD and CVD share similarrisk factors [13]. Moreover, the plateaus trends of CVD mortality have been observed in some region in EU at different time [14]. So far, little is known about the impact of these upwards prevalence risk factors on the trends of CVD mortality in the EU during the last three decades.
The aim of this study was to investigate overall trends in age- and sex-specific CVD mortality rates in EU countries between 1980 and 2011.
Methods
In this study, we obtained the CVD death count and population data for all country of the EU, from the WHO mortality database for the period 1980-2011. Age-and sex-specific mortality rates were calculated directly based on the European Standard Population. CVD as a cause of death was defined according to the International Classification of Disease codes (described in Appendix I as well as country code) Cyprus was excluded for unreliable and missing data. For Germany, we calculated the age-standardized mortality rates (ASMR) by combining the death count and population data of the former Democratic Republic of Germany and the former Federal Republic of Germany for years prior to 1990. In addition, England, Wales, Scotland, and Northern Ireland were combined together as the UK. The age groups analyzed were (i), 45 years, (ii) 45-54 years, (iii) 55-64 years, and (iv) 65 years and over.
Joinpoint software was used to identify CVD mortality trends for both sex and age. The software uses permutation tests to estimate direction and magnitude of changes in the trend with a significance level (α) of 0.05. Annual Percent Change (APC) and Average Annual Percent Change (AAPC) were calculated to characterize the overall trend for a given time period. Every ten years of AAPC during the period 1980-2011 was used to observe the dynamically changes of CVD mortality.
Results
Table 1 lists the years that data was collected, with corresponding population sizes, total numbers of death, and total CVD deaths, further divided by country and sex. There were more CVD deaths among women than men in all the countries as well as a higher percentage of deaths among women than men caused by CVD.
Table 1.
Overview of data availability, and numbers of deaths and population in 2011
| Data years | Males 2011a | Females 2011a | |||||||
|---|---|---|---|---|---|---|---|---|---|
|
| |||||||||
| Total population | Total deaths | CVD deaths (% of total) | Total population | Total deaths | CVD deaths (% of total) | ||||
| Austria | 1980-2011 | 4105493 | 36539 | 1914 | 5.2382% | 4315407 | 39940 | 3020 | 7.5613% |
| Belgium | 1980-2009 | 5290436 | 51356 | 3016 | 5.8727% | 5506056.5 | 52460 | 4359 | 8.3092% |
| Bulgaria | 1980-2011 | 3577946 | 56634 | 9321 | 16.4583% | 3770502 | 51624 | 10979 | 21.2672% |
| Czech Republic | 1985-2011 | 5153009 | 54141 | 4306 | 7.9533% | 5343663 | 52707 | 6497 | 12.3266% |
| Denmark | 1980-2006 | 2690179 | 25718 | 1447 | 5.6264% | 2744388 | 26487 | 1953 | 7.3734% |
| Estonia | 1981-2011 | 617809 | 7456 | 498 | 6.6792% | 722119 | 7748 | 741 | 9.5638% |
| Finland | 1980-2009 | 2645475 | 25152 | 1799 | 7.1525% | 2742797 | 24752 | 2547 | 10.2901% |
| France | 1980-2009 | 30334982 | 273461 | 13322 | 4.8716% | 32303954 | 263736 | 18751 | 7.1098% |
| Germany | 1980-2011 | 40152977 | 407628 | 23041 | 5.6525% | 41626233 | 444700 | 36025 | 8.1010% |
| Greece | 1980-2010 | 5598793 | 56480 | 6238 | 11.0446% | 5708764 | 52604 | 8672 | 16.4854% |
| Hungary | 1980-2011 | 4737813 | 63883 | 5804 | 9.0854% | 5233914 | 64912 | 7565 | 11.6542% |
| Ireland | 1980-2009 | 2217664 | 15044 | 777 | 5.1648% | 2241641 | 13854 | 1238 | 8.9360% |
| Italy | 1980-2010 | 29350339 | 285068 | 24086 | 8.4492% | 31133047 | 299547 | 36687 | 12.2475% |
| Latvia | 1980-2010 | 1033421 | 14584 | 1767 | 12.1160% | 1205587 | 15489 | 2893 | 18.6778% |
| Lithuania | 1981-2010 | 1527510 | 21536 | 2097 | 9.7372% | 1759310 | 20584 | 3662 | 17.7905% |
| Luxembourg | 1980-2010 | 252018 | 1810 | 118 | 6.5193% | 254948 | 1811 | 172 | 9.4975% |
| Malta | 1980-2011 | 206909 | 1664 | 152 | 9.1346% | 208745 | 1603 | 183 | 11.4161% |
| Netherlands | 1980-2011 | 8263177 | 65259 | 3302 | 5.0598% | 8429897 | 70482 | 5138 | 7.2898% |
| Poland | 1980-2011 | 18650105 | 198178 | 15230 | 7.6850% | 19875565 | 177323 | 20332 | 11.4661% |
| Portugal | 1980-2011 | 5042781 | 52786 | 5625 | 10.6562% | 5514218 | 50414 | 7625 | 15.1248% |
| Romania | 1980-2010 | 10434143 | 137957 | 21278 | 15.4236% | 10997155 | 121766 | 26295 | 21.5947% |
| Slovakia | 1992-2010 | 2639896 | 27645 | 2514 | 9.0939% | 2791128 | 25800 | 3342 | 12.9535% |
| Slovenia | 1985-2010 | 1014716 | 9292 | 829 | 8.9217% | 1034545 | 9317 | 1144 | 12.2786% |
| Spain | 1980-2010 | 22697679 | 198121 | 12152 | 6.1336% | 23375152 | 183926 | 16703 | 9.0814% |
| Sweden | 1980-2010 | 4669629 | 43919 | 3111 | 7.0835% | 4708497 | 46600 | 4491 | 9.6373% |
| UK | 1980-2010 | 30643254 | 270945 | 19294 | 7.1210% | 31618713 | 290721 | 30080 | 10.3467% |
Data are for 2011, or most recent available years.
Overall age-standardized CVD mortality for men and women are presented in Figure 1. The ASMR for women was higher than men for all 32 study years all ages combined. Between 1980 and 2011, it decreased by 38.8% in men and 36.6% in women. The characteristic decline curves in mortality rate for men and women were nearly the same, indicating a moderate decrease between 1980 and 2002 followed by a steeper decrease.
Figure 1.
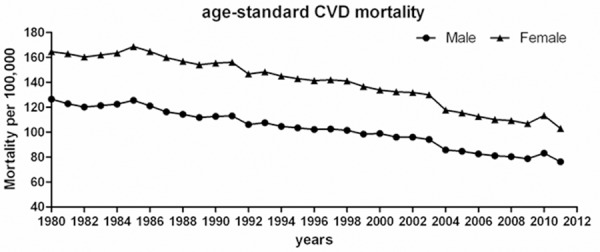
Age-standard CVD mortality for men and women between 1980 and 2011 in European Region.
Trends in CVD mortality across age groups were presented in more detail in Figure 2. CVD ASMR dropped substantially in both men and women in all age groups. After 1985, a constant decrease was found in all age groups followed bya less pronounced decrease between 2006 and 2011. In addition, CVD mortality was always higher among men (excluding aged > 65), among whom CVD mortality was higher among women since 1987. A significant decrease in CVD mortality was detected in almost all countries in EU among both sexes in the last decades. Except the group (55-64 years), the ten-year AAPC of CVD mortality for all subgroupsincreased every ten years.
Figure 2.
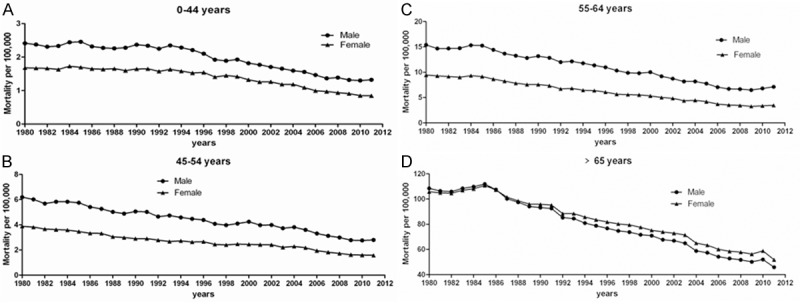
Age-and sex-specific mortality rates between 1980 and 2011 in European Region.
No major different was detected in the AAPC change in ASMR in both sexes combined all age groups between 1980 and 2011 (Table 2). Only the declining trends in age groups (44-54, 55-64) are more pronounced compared with the younger ones (< 45) and the older groups (> 65). For ages 55 to 64, the decline trends appeared tolevel off or even rise after 2006.
Table 2.
Overview of AAPC and APC in men and women in EU between 1980 and 2011
| AAPC | Trend 1 | Trend 2 | Trend 3 | Trend 4 | ||||||||
|---|---|---|---|---|---|---|---|---|---|---|---|---|
|
|
||||||||||||
| 1980-2011 | 1980-1989 | 1990-1999 | 2000-2011 | Period | APC | Period | APC | Period | APC | Period | APC | |
| Male | ||||||||||||
| all ages | -1.4* | -1.1* | -1.1* | -1.9* | 1980-2002 | -1.1* | 2002-2006 | -3.9* | 2006-2011 | -0.5 | ||
| < 45 years | -2.1* | -0.8* | -1.9* | -3.4* | 1980-1988 | -1.0* | 1988-1993 | 1.1 | 1993-2011 | -3.4* | ||
| 45-54 years | -2.6* | -1.9* | -1.9* | -3.9* | 1980-2004 | -1.9* | 2004-2011 | -5.0* | ||||
| 55-64 years | -2.4* | -1.8* | -2.8* | -2.4* | 1980-1995 | -1.8* | 1995-2009 | -4.0* | 2009-2011 | 5.1 | ||
| > 65 years | -2.5* | -1.4* | -2.6* | -3.2* | 1980-1984 | 0.1 | 1984-2003 | -2.6* | 2003-2006 | -5.7 | 2006-2011 | -2.0* |
| Female | ||||||||||||
| all ages | -1.4* | -0.9* | -0.9* | -2.2* | 1980-2002 | -0.9* | 2002-2005 | -5.3 | 2005-2011 | -1 | ||
| < 45 years | -2.2* | -0.5* | -1.7* | -4.0* | 1980-1996 | -0.5* | 1996-2011 | -4.0* | ||||
| 45-54 years | -3.1* | -3.1* | -1.6* | -4.4* | 1980-1990 | -3.1* | 1990-2004 | -1.6* | 2004-2011 | -6.0* | ||
| 55-64 years | -3.1* | -2.3* | -3.0* | -3.8* | 1980-1984 | -1.4 | 1984-2000 | -3.0* | 2000-2009 | -5.3* | 2009-2011 | 3.4 |
| > 65 years | -2.0* | -1.0* | -2.1* | -2.8* | 1980-1985 | -0.1 | 1985-2003 | -2.1* | 2003-2006 | -5.5* | 2006-2011 | -1.5* |
Rate of change significantly different from 0 at P<0.05.
The tendency for CVD mortality varied countries from countries in the EU. Across all 26 countries, most of them indicated a drop tendency in the past three decades. Austria, Estonia, France, Ireland and Luxembourg demonstrated asteeper decreasein comparison to all other countries (AAPC ≤ 3.0% among both sexes from 1980 and 2011) (Table 3). Among men, no significant change was observed in Denmark, Slovakia, Spain, Sweden and UK. For women only Malta had no significant change. Moreover, Bulgaria, Lithuania, Poland and Slovakia showed positive AAPC for men and women between 1980 and 2011.
Table 3.
Joinpoint analyses of APC and AAPC by country and sex, all ages combined
| AAPC | Trend 1 | Trend 2 | Trend 3 | Trend 4 | ||||||||
|---|---|---|---|---|---|---|---|---|---|---|---|---|
|
|
||||||||||||
| 1980-2011 | 1980-1989 | 1990-1999 | 2000-2011 | Period | APC | Period | APC | Period | APC | Period | APC | |
| Males | ||||||||||||
| Austria | -4.2* | -3.2* | -3.3 | -5.6* | 1980-1985 | -1.20 | 1985-1994 | -5.5* | 1994-1997 | 1.3 | 1997-2011 | -5.6* |
| Belgium | -2.2* | -2.7* | -1.9 | -1.9* | 1980-1983 | 1.20 | 1983-1987 | -5.9* | 1987-2009 | -1.9* | ||
| Bulgaria | 0.4* | 0.4* | 0.4* | 0.4* | 1980-2011 | 0.4* | ||||||
| Czech Republic | -2.0* | 2 | -3.6* | -3.6* | 1980-1986 | 4.9* | 1986-2011 | -3.6* | ||||
| Denmark | -1.8 | -2.4* | -1.3 | 1994-2000 | -2.4* | 2000-2003 | 3.7 | 2003-2006 | -6.0* | |||
| Estonia | -5.5* | -2.3* | -7.2* | 1994-2005 | -2.3* | 2005-2011 | -11.1* | |||||
| Finland | -1.7* | -1.7* | -1.7* | -1.7* | 1987-2011 | -1.7* | ||||||
| France | -3.1* | -4.0* | -2.6* | -2.6* | 1980-1986 | -2.6* | 1986-1989 | -6.7* | 1989-2009 | -2.6* | ||
| Germany | -2.6* | -2.7* | -2.8* | -2.3* | 1980-1988 | -2.8* | 1988-1995 | -1.7* | 1995-2005 | -4.0* | 2005-2011 | -0.9 |
| Greece | -0.7* | 0.7* | -0.3* | -2.3* | 1980-1985 | 1.4* | 1985-2002 | -0.3* | 2002-2010 | -2.8* | ||
| Hungary | -1.8* | -1.5* | -0.7* | -3.1* | 1980-1988 | -1.6* | 1988-2003 | -0.7* | 2003-2006 | -7.7* | 2006-2011 | -1.6* |
| Ireland | -3.1* | -2.6* | -2.6* | -4.2* | 1980-2001 | -2.6* | 2001-2006 | -7.9* | 2006-2009 | 1.7 | ||
| Italy | -1.4* | -0.9* | -1.4* | -1.7* | 1980-1993 | -0.9* | 1993-2010 | -1.7* | ||||
| Latvia | -0.6* | 0.6* | 0.6* | -2.9* | 1980-2002 | 0.6* | 2002-2010 | -3.7* | ||||
| Lithuania | 1.4* | 0.9* | 0.9* | 2.2* | 1981-2000 | 0.9* | 2000-2010 | 2.2* | ||||
| Luxembourg | -3.7* | -2.6* | -5.3* | -2.9 | 1980-1985 | -0.30 | 1985-2007 | -5.3* | 2007-2010 | 3 | ||
| Malta | -1.3* | -1.3* | -1.3* | -1.3* | 1980-2010 | -1.3* | ||||||
| Netherlands | -2.1* | -1.4* | -1.2* | -3.8* | 1980-1987 | -1.9* | 1987-1991 | 0.3 | 1991-2002 | -1.3* | 2002-2011 | -4.3* |
| Poland | 1.6* | 2.0* | 4.3* | -1.6* | 1980-1995 | 2.0* | 1995-2000 | 7.2* | 2000-2011 | -1.6* | ||
| Portugal | -2.2* | -0.2* | -1.6* | -4.3* | 1980-1996 | -0.20 | 1996-2011 | -4.3* | ||||
| Romania | 1.8* | 1.9* | 4.3* | -0.5* | 1980-1991 | 1.9* | 1991-1994 | 13.7* | 1994-2010 | -0.5* | ||
| Slovakia | 0.6 | -1.4* | 2.3* | 1992-2005 | -1.4* | 2005-2010 | 6.1* | |||||
| Slovenia | -1.3* | -0.3 | -2.5* | -0.4* | 1985-1992 | -0.30 | 1992-2007 | -3.1* | 2007-2010 | 6.3 | ||
| Spain | -2.3 | -1.8 | -1.8 | -3.3 | 1980-2002 | -1.8 | 2002-2010 | -3.6 | ||||
| Sweden | -1.6 | 0 | 0 | -3.4 | 1987-1999 | 0 | 1999-2010 | -3.4 | ||||
| UK | -2 | -0.9 | -2 | -3.8 | 1980-1986 | -0.2 | 1986-1998 | -2.4 | 1998-2002 | 1.2 | 2002-2010 | -4.4 |
| Females | ||||||||||||
| Austria | -3.6* | -1.8* | -3.2* | -5.4* | 1980-1984 | 0.1 | 1984-2002 | -3.2* | 2002-2005 | -13.3 | 2005-2011 | -2 |
| Belgium | -2.0* | -1.6* | -1.9* | -2.5* | 1980-1983 | 3 | 1983-1988 | -4.5* | 1988-1993 | -0.7 | 1993-2009 | -2.5* |
| Bulgaria | 0.1 | -1 | 0.5* | 0.7 | 1980-1982 | -5.8 | 1982-2004 | 0.5* | 2004-2007 | 5 | 2007-2011 | -2.3 |
| Czech Republic | -1.4* | 2.7 | -3.1* | -3.1* | 1980-1986 | 5.8* | 1986-2011 | -3.1* | ||||
| Denmark | -1.9* | -2.6* | -1.9 | 1994-1999 | -2.6* | 1999-2002 | 1.7 | 2002-2006 | -3.7* | |||
| Estonia | -5.8* | -2.2* | -7.8* | 1994-2003 | -2.2* | 2003-2011 | -9.8* | |||||
| Finland | -2.1* | -0.4 | -1.9* | -2.6* | 1987-1993 | -0.4 | 1993-2011 | -2.6* | ||||
| France | -3.2* | -3.5* | -3.0* | -3.0* | 1980-1985 | -2.0* | 1985-1988 | -6.0* | 1988-2009 | -3.0* | ||
| Germany | -2.4* | -1.3* | -2.7* | -3.1* | 1980-1988 | -1.5* | 1988-1993 | 0.2 | 1993-2007 | -4.1* | 2007-2011 | -1.2 |
| Greece | -0.8* | 0.9* | -0.5* | -2.6* | 1980-1987 | 1.3* | 1987-2003 | -0.5* | 2003-2010 | -3.5* | ||
| Hungary | -1.6* | -1.3* | -0.9* | -2.7* | 1980-1994 | -1.3* | 1994-2003 | -0.5 | 2003-2006 | -7.5* | 2006-2011 | -0.9 |
| Ireland | -2.9* | -3.0* | -1.9* | -4.2* | 1980-1984 | -4.3* | 1984-2000 | -1.9* | 2000-2005 | -7.6* | 2005-2009 | 0.2 |
| Italy | -0.6* | 0.1 | -0.6* | -1.2* | 1980-1994 | 0.1 | 1994-2010 | -1.2* | ||||
| Latvia | -0.9* | 0.7 | 0.2 | -3.6* | 1980-1985 | 3.4* | 1985-1989 | -2.6 | 1989-2003 | 0.2 | 2003-2010 | -5.2* |
| Lithuania | 1.5* | 1.5* | 1.5* | 1.5* | 1981-2010 | 1.5* | ||||||
| Luxembourg | -3.7* | -1.3* | -4.7* | -4.7* | 1980-1989 | -1.3* | 1989-2010 | -4.7* | ||||
| Malta | -0.4 | -0.4 | -0.4 | -0.4 | 1980-2010 | -0.4 | ||||||
| Netherlands | -1.5* | 0.2 | -0.7* | -3.7* | 1980-1987 | -0.2 | 1987-1992 | 1.8* | 1992-2002 | -1.4* | 2002-2011 | -4.3* |
| Poland | 1.4* | 1.4* | 4.7* | -1.9* | 1980-1995 | 1.4* | 1995-2000 | 9.1* | 2000-2011 | -1.9* | ||
| Portugal | -1.9* | 0.1 | -1.3* | -4.1* | 1980-1996 | 0.1 | 1996-2011 | -4.1* | ||||
| Romania | 1.4* | 1.8* | 3.7* | -0.9 | 1980-1991 | 1.8* | 1991-1994 | 9.9 | 1994-2005 | 0.5 | 2005-2010 | -2.3* |
| Slovakia | 1.2* | -1.0* | 3.1* | 1992-2006 | -1.0* | 2006-2010 | 9.5* | |||||
| Slovenia | -1.2* | -2.2* | -2.2* | 0.3 | 1985-2006 | -2.2* | 2006-2010 | 4.2 | ||||
| Spain | -2.2* | -1.1* | -2.0* | -3.6* | 1980-1991 | -1.1* | 1991-2003 | -2.1* | 2003-2010 | -4.2* | ||
| Sweden | -1.4* | 0.0* | 0 | -3.2* | 1987-2002 | 0 | 2002-2005 | -6.7 | 2005-2010 | -2.3* | ||
| UK | -2.1* | -0.5 | -2.0* | -4.2* | 1980-1988 | -0.2 | 1988-1998 | -2.3* | 1998-2002 | 0.2 | 2002-2010 | -4.7* |
Rate of change significantly different from 0 at P<0.05.
Joinpoint analyses indicated a levelling off of trendsin all ages combined and subgroups (aged ≥ 55 years) after the year 2006 for men and women. Additionally, those plateaus trends were also observed in individual countries at different times. For men, Belgium, France, Germany, Hungary, Ireland, Luxembourg, Slovakia and Slovenia presented a less pronounced decline or even a rise. Austria, France, Germany, Hungary, Ireland, Slovakia, and Sweden shared a similar pattern in women. However, in the majority of countries that had mortality trends with plateau characteristics, the APC was still statistically significant for a decrease in CVD mortality (Figure 3).
Figure 3.
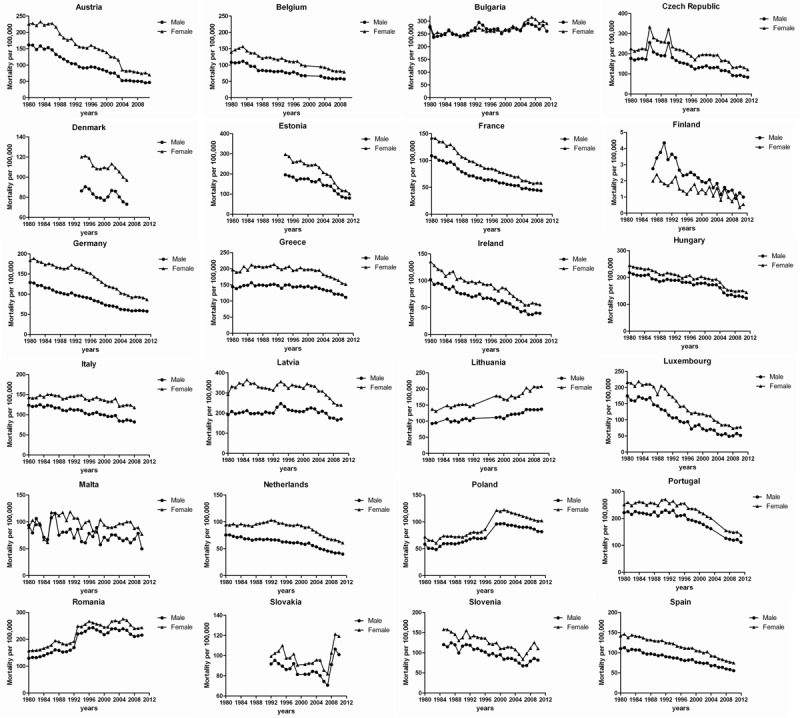
Trends in age-standardized mortality rate by country in EU. Data for age-standardized mortality Exception, where data were not available for all years are Belgium (no data 2000-2002); Estonia (no data before 1994); Lithuania (no data 1980, 1983-1984, 1993-1997); Poland (nodata1997-1998); Portugal (no data 2004-2006); Slovakia (no data before 1992); Slovenia (no data before 1985); Sweden (no data for male 1980, 2008); UK (no data 20000).
Discussion
In the whole EU, CVD mortality decreased markedly between 1980 and 2011. The overall trends were characterized by a drop patternin both sexes and ages. Declines were sustained in 16 of all 26 countries such as Austria, Estonia, France, Ireland and Luxembourg. In many countries CVD mortality had decreased by 50%, and in Austria it decreased by 70%. Overall, average all-cause mortality has declined, both among men and among women, but variation between countries still exists.
Blood pressure (BP) is the principal risk factor for stroke, and the decline in CVD among EU is largely caused by reducing in the prevalence of hypertension [10,15,16]. Therapeutic interventions for hypertension have been carried out gradually among the EU. For example Germany, Sweden, England, Spain and Italy started to conduct treatment for hypertension in the 1990s. The different starting dates for the treatment for hypertension could affect the CVD mortality trends in the past three decades.
For men in Belgium, the prevalence of systolic blood pressure above 159 mm Hg decreased from 51% to 21% between 1967 and 1986. The proportion of subjects receiving treatment for hypertension increased from 10% to 36%. The decrease in stroke mortality in Belgium associated with effects of treatment for hypertension and a decrease in sodium intake [17]. This is in contrast with Portugal where the diet is traditionally very rich in salt. Although the salt content of the Portuguese diet has been declining in recent decades, Portugal still has a higher rates of stroke mortality in Western European. Higher rates of stroke in lower socioeconomic groups and in rural areas suggest a link between stroke mortality and adherence to the traditional Portuguese diet [18].
Differences in economic and political correlates may also contribute to the changes in mortality trends. The CVD mortality rates declined with rapid economic growth that brought a degree of prosperity everywhere, as systems of social security were introduced that reduced the risks of poverty, and new drugs and other treatment modes were developed that brought diseases under control. The overall trends for Germany in our investigation reflect a special situation attributable to the reunification in 1990 [19]. Politically, however, Europe was divided between a Western, capitalist bloc, and an Eastern, communist bloc.Stroke mortality rose in Eastern European countries until the late 1980s to a level twice as high as that in Western European [20]. The mortality levels in Western Europe, still very dissimilar in the 1950s, converged to low levels around 1990, while those in Central and Eastern Europe such as Bulgaria remained high and increasingly moved away from those in Western Europe. Both among men and among women most of Bulgaria’s widening gap in total mortality is proportional to its growing economic disadvantage, as well as its democratic deficit, as compared to Sweden. Apart from a few exceptions, the overall declining trends in EU still continue. It is, however still difficult to draw a conclusion that the CVD mortality in EU is starting to plateau or increase.
In conclusion, the last three decades significant reductions in CVD mortality have been observed in all age groups and in both sexes in most EU countries. To date, there is little evidence to suggest that these reductions are plateauing in younger age groups across the EU as a whole. However, in a small number of countries there was evidence of recent plateauing in some age groups. It remains vitally important for the whole EU to monitor and work towards reducing preventable risk factors for CAD and other chronic conditions to promote well-being and equity across the region.
Acknowledgements
This work was supported by the grants from National Natural Science Foundation of China (81100162 to W. Sun; 81200669 to J. Xiao), Innovation Program of Shanghai Municipal Education Commission (13YZ014 to J. Xiao), Foundation for University Young Teachers by Shanghai Municipal Education Commission (year 2012, to J. Xiao), Innovation Foundation of Shanghai university (sdcx2012038, to J. Xiao), and Program for the integration of production, teaching and research for University Teachers supported by Shanghai Municipal Education Commission (year 2014, to JJ Xiao), and by the Priority Academic Program Development of Jiangsu Higher Education Institutions (PAPD2010-2013). Dr XQ Kong is a Fellow at the Collaborative Innovation Center for Cardiovascular Disease Translational Medicine.
Disclosure of conflict of interest
None.
References
- 1.Murray CJ, Lopez AD, Jamison DT. The global burden of disease in 1990: summary results, sensitivity analysis and future directions. Bull World Health Organ. 1994;72:495–509. [PMC free article] [PubMed] [Google Scholar]
- 2.Feigin VL, Forouzanfar MH, Krishnamurthi R, Mensah GA, Connor M, Bennett DA, Moran AE, Sacco RL, Anderson L, Truelsen T, O’Donnell M, Venketasubramanian N, Barker-Collo S, Lawes CM, Wang W, Shinohara Y, Witt E, Ezzati M, Naghavi M, Murray C Global Burden of Diseases, Injuries, and Risk Factors Study 2010 (GBD 2010) and the GBD Stroke Experts Group. Global and regional burden of stroke during 1990-2010: findings from the Global Burden of Disease Study 2010. Lancet. 2014;383:245–254. doi: 10.1016/s0140-6736(13)61953-4. [DOI] [PMC free article] [PubMed] [Google Scholar]
- 3.World Health Organization. The global burden of disease: 2004 update. WHO. 2008 [Google Scholar]
- 4.Mirzaei M, Truswell AS, Arnett K, Page A, Taylor R, Leeder SR. Cerebrovascular disease in 48 countries: secular trends in mortality 1950-2005. J Neurol Neurosurg Psychiatry. 2012;83:138–145. doi: 10.1136/jnnp-2011-300408. [DOI] [PubMed] [Google Scholar]
- 5.Muller-Riemenschneider F, Andersohn F, Willich SN. Trends in age-standardised and age-specific mortality from ischaemic heart disease in Germany. Clin Res Cardiol. 2010;99:545–551. doi: 10.1007/s00392-010-0151-9. [DOI] [PubMed] [Google Scholar]
- 6.Bertuccio P, Levi F, Lucchini F, Chatenoud L, Bosetti C, Negri E, La Vecchia C. Coronary heart disease and cerebrovascular disease mortality in young adults: recent trends in Europe. Eur J Cardiovasc Prev Rehabil. 2011;18:627–634. doi: 10.1177/1741826710389393. [DOI] [PubMed] [Google Scholar]
- 7.Levi F, Lucchini F, Negri E, La Vecchia C. Trends in mortality from cardiovascular and cerebrovascular diseases in Europe and other areas of the world. Heart. 2002;88:119–124. doi: 10.1136/heart.88.2.119. [DOI] [PMC free article] [PubMed] [Google Scholar]
- 8.Finucane MM, Stevens GA, Cowan MJ, Danaei G, Lin JK, Paciorek CJ, Singh GM, Gutierrez HR, Lu Y, Bahalim AN, Farzadfar F, Riley LM, Ezzati M Global Burden of Metabolic Risk Factors of Chronic Diseases Collaborating Group (Body Mass Index) National, regional, and global trends in body-mass index since 1980: systematic analysis of health examination surveys and epidemiological studies with 960 country-years and 9.1 million participants. Lancet. 2011;377:557–567. doi: 10.1016/S0140-6736(10)62037-5. [DOI] [PMC free article] [PubMed] [Google Scholar]
- 9.Danaei G, Finucane MM, Lu Y, Singh GM, Cowan MJ, Paciorek CJ, Lin JK, Farzadfar F, Khang YH, Stevens GA, Rao M, Ali MK, Riley LM, Robinson CA, Ezzati M Global Burden of Metabolic Risk Factors of Chronic Diseases Collaborating Group (Blood Glucose) National, regional, and global trends in fasting plasma glucose and diabetes prevalence since 1980: systematic analysis of health examination surveys and epidemiological studies with 370 country-years and 2.7 million participants. Lancet. 2011;378:31–40. doi: 10.1016/S0140-6736(11)60679-X. [DOI] [PubMed] [Google Scholar]
- 10.O’Donnell MJ, Xavier D, Liu L, Zhang H, Chin SL, Rao-Melacini P, Rangarajan S, Islam S, Pais P, McQueen MJ, Mondo C, Damasceno A, Lopez-Jaramillo P, Hankey GJ, Dans AL, Yusoff K, Truelsen T, Diener HC, Sacco RL, Ryglewicz D, Czlonkowska A, Weimar C, Wang X, Yusuf S INTERSTROKE investigators. Risk factors for ischaemic and intracerebral haemorrhagic stroke in 22 countries (the INTERSTROKE study): a case-control study. Lancet. 2010;376:112–123. doi: 10.1016/S0140-6736(10)60834-3. [DOI] [PubMed] [Google Scholar]
- 11.Allender S, Scarborough P, O’Flaherty M, Capewell S. Patterns of coronary heart disease mortality over the 20th century in England and Wales: Possible plateaus in the rate of decline. BMC Public Health. 2008;8:148. doi: 10.1186/1471-2458-8-148. [DOI] [PMC free article] [PubMed] [Google Scholar]
- 12.Muller-Riemenschneider F, Andersohn F, Willich SN. Trends in age-standardised and age-specific mortality from ischaemic heart disease in Germany. Clin Res Cardiol. 2010;99:545–551. doi: 10.1007/s00392-010-0151-9. [DOI] [PubMed] [Google Scholar]
- 13.Yusuf S, Hawken S, Ounpuu S, Dans T, Avezum A, Lanas F, McQueen M, Budaj A, Pais P, Varigos J, Lisheng L INTERHEART Study Investigators. Effect of potentially modifiable risk factors associated with myocardial infarction in 52 countries (the Interheart study): case-control study. Lancet. 2004;364:937–952. doi: 10.1016/S0140-6736(04)17018-9. [DOI] [PubMed] [Google Scholar]
- 14.Rieks S, Willich SN, Mueller-Riemenschneider F. Trends in age-standardized and age-specific cerebrovascular mortality in Germany between 1980 and 2009. Cerebrovasc Dis. 2012;34:368–375. doi: 10.1159/000343228. [DOI] [PubMed] [Google Scholar]
- 15.Ezzati M, Hoorn SV, Rodgers A, Lopez AD, Mathers CD, Murray CJ Comparative Risk Assessment Collaborating Group. Estimates of global and regional potential health gains from reducing multiple major risk factors. Lancet. 2003;362:271–280. doi: 10.1016/s0140-6736(03)13968-2. [DOI] [PubMed] [Google Scholar]
- 16.Almgren T, Persson B, Wilhelmsen L, Rosengren A, Andersson OK. Stroke and coronary heart disease in treated hypertension-a prospective cohort study over three decades. J Intern Med. 2005;257:496–502. doi: 10.1111/j.1365-2796.2005.01497.x. [DOI] [PubMed] [Google Scholar]
- 17.Joossens JV, Kesteloot H. Trends in systolic blood pressure, 24-hour sodium excretion, and stroke mortality in the elderly in Belgium. Am J Med. 1991;90:5S–11S. doi: 10.1016/0002-9343(91)90428-z. [DOI] [PubMed] [Google Scholar]
- 18.Mackenbach JP. Bacalhao under the Ponte 25 de Abril: impressions from Lisbon. Eur J Public Health. 2009;19:1. doi: 10.1093/eurpub/ckn138. [DOI] [PubMed] [Google Scholar]
- 19.Muller-Riemenschneider F, Andersohn F, Willich SN. Trends in age-standardised and age-specific mortality from ischaemic heart disease in Germany. Clin Res Cardiol. 2010;99:545–551. doi: 10.1007/s00392-010-0151-9. [DOI] [PubMed] [Google Scholar]
- 20.Mirzaei M, Truswell AS, Arnett K, Page A, Taylor R, Leeder SR. Cerebrovascular disease in 48 countries: secular trends in mortality 1950-2005. J Neurol Neurosurg Psychiatry. 2012;83:138–145. doi: 10.1136/jnnp-2011-300408. [DOI] [PubMed] [Google Scholar]