

Abstract
The effects of exercise are not limited to muscle, and its ability to mitigate some chronic diseases is under study. A more complete understanding of how exercise impacts non-muscle tissues might facilitate design of clinical trials and exercise mimetics. Here, we focused on lactate’s ability to mediate changes in liver and brain bioenergetic-associated parameters. In one group of experiments, C57BL/6 mice underwent seven weeks of treadmill exercise sessions at intensities intended to exceed the lactate threshold. Over time, the mice dramatically increased their lactate threshold. To ensure that plasma lactate accumulated during the final week, the mice were run to exhaustion. In the liver, mRNA levels of gluconeogenesis-promoting genes increased. And while PGC-1α expression increased, there was a decrease in PGC-1β expression, and overall gene expression changes favored respiratory chain down-regulation. In the brain, PGC-1α and PGC-1β were unchanged but PRC expression and mtDNA copy number increased. Brain TNFα expression fell, while VEGF-A expression rose. In another group of experiments, exogenously administered lactate was found to reproduce some but not all of these observed liver and brain changes. Our data suggest that lactate, an exercise byproduct, could mediate some of the effects exercise has on the liver and the brain, and that lactate itself can act as a partial exercise mimetic.
Keywords: exercise, lactate, brain, liver
Introduction
Bioenergetic function plays a role in various chronic diseases including cardiovascular disease, diabetes, and some neurodegenerative disorders. In these instances bioenergetic function is thought to constitute a viable therapeutic target (Duncan 2011, Ren et al. 2010, Fontan-Lozano et al. 2008, Swerdlow 2011). Exercise, a non-pharmacologic intervention, affects cell and tissue bioenergetics. While exercise’s effects on muscle bioenergetics are particularly robust these effects are not muscle-limited and, at least to a minor degree, occur in other tissues. It was recently postulated physical exercise might potentially delay or mitigate age-related central nervous system diseases such as Alzheimer’s disease (AD), perhaps through effects on brain bioenergetics (Rockwood & Middleton 2007).
In muscle, exercise facilitates mitochondrial biogenesis (Hood et al. 2006), and this confers some benefits of endurance training. Exercise may also affect brain mitochondrial biogenesis. One study found exercise increases brain peroxisome proliferator-activated receptor- gamma coactivator 1 alpha (PGC-1α) mRNA levels (Steiner et al. 2011). In several tissues PGC-1α acts as a master regulator of mitochondrial biogenesis and cell energy metabolism. It binds and activates nuclear respiratory factor 1 (NRF-1), which in turn induces the expression of mitochondrial transcription factor A (TFAM) (Vina et al. 2009, Scarpulla 2008). TFAM enables the replication, maintenance, and transcription of mitochondrial DNA (mtDNA). Under some conditions exercise has been shown to increase brain mtDNA copy number (Bayod et al. 2011, Marosi et al. 2012, Zhang et al. 2012a, Zhang et al. 2012b).
Exercise has long been thought to primarily modify brain molecular physiology by increasing amounts of brain derived neurotrophic factor (BDNF) (Stranahan et al. 2009), but other factors may also mediate the non-muscle effects of exercise, or perhaps lie upstream of BDNF changes. Lactate, which is generated and released by exercising muscle, in particular appears to affect the brain. Blood lactate accesses the brain via endothelial monocarboxylate transporters (MCTs) (Pierre & Pellerin 2005). Lactate imported from the blood to the brain is used to generate energy (Boumezbeur et al. 2010, Gallagher et al. 2009, Quistorff et al. 2008, van Hall et al. 2009, Wyss et al. 2011), protects ischemic neurons (Berthet et al. 2009), and facilitates memory formation (Newman et al. 2011, Suzuki et al. 2011). For these reasons and others, we considered whether lactate itself might reproduce and perhaps mediate exercise- associated changes in brain bioenergetic infrastructures.
Materials and Methods
Animals
The animal work described in this study was approved by the Institutional Animal Care and Use Committee of the University of Kansas Medical Center. Whenever possible, efforts were made to minimize animal discomfort. We attest that we have reviewed the ARRIVE guidelines for the use of animals in research, and are in compliance with these guidelines. Fifty-four C57BL/6 male mice were included in these studies. Our mice were obtained from the Jackson Laboratory, and were 4 months old when they reached our vivarium. All mice were maintained on an ad libitum diet, and were housed 4 per cage on a 12:12 hour light:dark schedule. After a 1 week accommodation period, the mice were randomly placed into 4 groups, a sedentary group (SED, n = 11), an exercise group (EX, n = 12), a lactate treatment group (LAC, n = 16), and a lactate-free vehicle group (VEH, n = 15).
Exercise training
EX mice were exercised for 7 weeks, 2 sessions per day, on a six-lane treadmill designed for mice (Columbus Instruments, Columbus, OH). The back of each treadmill lane contained an electrified grid, which delivered a shock stimulus to stationary mice (0.2 mA, 200 ms pulses, 1 Hz). For the first 3 weeks each session consisted of a 3 minute warm-up at 15 m/min followed by 42 minutes at 18 m/min. This speed approximates the lactate threshold for untrained C57BL/6 mice (Billat et al. 2005). During weeks 4, 5, and 6 the treadmill speed was progressively increased to 20 m/min, 22 m/min, and 25 m/min respectively. In order to ensure that at least at the end of the training period exercise intensity exceeded the lactate threshold, during the last week (week 7) the mice did not run for a specified time interval at a specific speed, but instead ran to exhaustion. Mice were defined as exhausted if, for the third time, they remained on the shock grid for greater than 5 continuous seconds without attempting to run. During these 7 weeks running sessions were performed 5 days per week.
The SED mice served as the control group for the EX mice. SED mice did not receive any exercise training. To minimize potential confounding factors such as differences in sound and light exposure, during the EX mice training sessions SED mice were placed in the same room as the EX mice.
At the conclusion of the 7-week training period, EX mice were sacrificed by decapitation 1 hour after the last session, and SED mice were also decapitated at approximately the same time on the same day. Liver and brain tissue were immediately frozen in liquid nitrogen, and saved at −80°C for subsequent analysis.
Lactate treatment
LAC mice received 2g/kg of sodium lactate dissolved in phosphate buffered saline (PBS). The lactate solution concentration was 200 mg/mL (~18 mM), and the pH was 7.4. The controls for the LAC group, the VEH group, were administered PBS at a volume that approximated the average volume administered to the LAC mice. Injections were performed intraperitoneally, once a day, for 14 consecutive days. 1 hour after the final injection mice were sacrificed by decapitation, liver and brain tissue were immediately frozen in liquid nitrogen, and these tissues were saved at −80°C for subsequent analysis.
Lactate, glucose, and insulin levels
Plasma lactate levels were assayed using a commercial L-lactate assay kit (Eton Bioscience Inc., San Diego, CA). In order to minimize day-to-day assay variation, EX mouse values were normalized to the mean lactate level of the SED mice assayed on the same day. For the VEH and LAC groups, values were normalized to the mean lactate level of VEH mice assayed on the same day.
Blood glucose levels were measured using a One-Touch Ultra Blood Glucose Monitoring System (LifeScan, Milpitas, CA). Plasma samples were also prepared from tail vein blood that was collected in heparinized micro-hematocrit capillary tubes (Fisher Scientific, Pittsburgh, PA). Plasma insulin levels were measured using an insulin enzyme-linked immunosorbent assay kit according to the manufacturer’s instructions (American Laboratory Products Company, Salem, NH). Blood glucose and plasma insulin were measured after a 16 hour fast (fasting blood glucose and fasting plasma insulin). Values for the homeostasis model assessment of insulin resistance (HOMA-IR) were calculated as the product of fasting blood glucose (mM) and plasma insulin (microunits/ml) divided by 22.5 (Matthews et al. 1985).
Quantitative real-time, reverse-transcription PCR
Total RNA was prepared from frozen brain and liver tissue using the TRI Reagent (Life Technologies, Grand Island, NY). Reverse transcription was performed on total RNA (1 μg) using a High Capacity cDNA Reverse Transcription kit (Applied Biosystems, Foster City, CA). Quantitative real-time, reverse-transcription PCR (qPCR) was performed using TaqMan Universal PCR Master Mix (Applied Biosystems, Foster City, CA) and ready-to-use TaqMan Gene Expression Assays (Applied Biosystems) to quantify the mRNA levels of PGC-1α, PGC- 1β, PGC-1 related co-activator (PRC), NRF-1, TFAM, phosphoenolpyruvate carboxykinase 1 (PCK1), pyruvate dehydrogenase kinase 4 (PDK4), vascular endothelial growth factor A (VEGF-A), hypoxia-inducible factor alpha (HIF-1α), and tumor necrosis factor alpha (TNF-α). Glyceraldehyde 3-phosphate dehydrogenase (GAPDH) was used as an internal loading control. Our qPCR amplifications were performed using an Applied Biosystems StepOnePlus Real-Time PCR System (Applied Biosystems).
MtDNA copy number
To quantify liver and brain mtDNA, total DNA was extracted using a phenol-chloroform based method as previously described (Guo et al. 2009). Briefly, frozen mouse liver and brain (~15 mg) were homogenized by 10 strokes of a Dounce homogenizer in lysis buffer (10 mM Tris-HCl at pH 8.0, 1 mM EDTA, and 0.1 % SDS). After adding proteinase K, lysate tubes were incubated at 55 °C for 3 hours. Lysate solutions were vortexed vigorously and centrifuged at 8,000 g for 15 minutes. Supernatants were mixed with phenol/chloroform/isoamyl alcohol (25:4:1) (Sigma-Aldrich, St. Louis, MO), and centrifuged again at 8,000 g for 15 minutes. The supernatants were mixed with an equal volume of chloroform and centrifuged at 8,000 g for 15 minutes. The resulting supernatants were mixed with sodium acetate and isopropanol, stored overnight at −20 °C to facilitate DNA precipitation, and centrifuged at 8000 g for 15 minutes to pellet the DNA.
DNA pellets were then washed with 70% ethanol, air dried, and dissolved in nuclease- free water. DNA concentration and purity were determined spectrophotometrically by determining the absorbance at 260 nm and the 260 nm/280 nm ratio. Each real-time PCR reaction was performed using 10 ng of DNA as the template. We used TaqMan Gene Expression Assays (Applied Biosystems) to quantify the amounts of two targets present on mtDNA, NADH dehydrogenase subunit 2 (ND2) and the16s ribosomal RNA (rRNA) gene, as well as the amount of a nuclear target, the 18s rRNA gene. The relative mtDNA to nuclear DNA copy number ratio was determined using the comparative ΔΔCT method, in which ND2: 18s rRNA and 16s rRNA: 18s rRNA ratios were calculated.
Immunochemistry
Brain protein lysates were prepared using NE-PER Nuclear and Cytoplasmic Extraction Reagents (Thermo Scientific, Rockford, IL) according to the manufacturer’s instructions. Protein concentrations were measured using a BCA protein assay reagent kit (Thermo Scientific, Rockford, IL). Cytoplasmic and nuclear HIF-1α protein levels (primary antibody: 1:500 dilution; Ab113642; Abcam, Cambridge, MA) were analyzed by Western blot. GAPDH (1:2000 dilution; 2118; Cell Signaling Technology, Danvers, MA) and histone deacetylase 1 (1:2000 dilution; PA1-860; Thermo Scientific) were used as loading controls for the cytoplasmic and nuclear fractions, respectively. Primary antibody binding was detected using horseradish peroxidase- conjugated secondary antibodies (1:2000 dilution; Cell Signaling Technology) and SuperSignal West Femto Maximum Sensitivity Substrate (Thermo Scientific).
Statistical analysis
Data were summarized by means and standard errors. Mean values were compared by two-way, unpaired t-tests or two-way, paired t-tests using SPSS 18.0 (SPSS Inc., Chicago, IL, USA). Pearson’s correlation analysis was used to test inter-parameter relationships. p-values less than 0.05 were considered statistically significant.
Results
Effect of treadmill training and lactate injection on plasma lactate levels
Treadmill training profoundly changed the exercise-related plasma lactate accumulation threshold (Fig. 1A). At the beginning of the first week of training, immediately after completing a treadmill session at 18 m/min plasma lactate levels were higher in the EX mice than they were in the SED mice. After one week of training at 18 m/min, though, exercise at 18 m/min no longer increased the plasma lactate and at the end of weeks 2 and 3 post-exercise lactate levels were actually lower in the EX mice than they were in the SED mice. Increasing the treadmill speed to 20 m/min, 22 m/min, and 25 m/min in weeks 4, 5, and 6 eventually eliminated this post-exercise lactate reduction, but did not increase the EX mouse post-exercise lactate level above the SED mouse lactate level. Only after running EX mice to exhaustion during week 7 did we again manage to exceed the lactate accumulation threshold and increase plasma lactate levels.
Figure 1. Plasma lactate levels.

A, Treadmill exercise at 18 m/min initially elevated plasma lactate levels, but over time the exercise intensity needed to boost plasma lactate concentrations increased. Measurements were performed immediately after the completion of an exercise session. *P < 0.05 relative to the lactate levels of the SED mice. B, In LAC mice, plasma lactate levels peaked approximately 15 minutes after an intraperitoneal injection, remained significantly elevated for at least 1 hour, and returned to baseline by 3 hours. *P < 0.05 relative to the lactate levels of the VEH mice.
In the LAC mice, 2 g/kg of intraperitoneal lactate rapidly increased the plasma lactate level (Fig. 1B). Lactate levels peaked approximately 15 minutes after injection, remained significantly elevated over the pre-injection baseline for at least 1 hour, and returned to the baseline level by 3 hours.
Effect of treadmill training and lactate injections on weight, glucose, and insulin
At the beginning of the study body weights were comparable between the SED and EX groups, as well as between the VEH and LAC groups. At the end of the 7 week treadmill training period the EX mice did not increase their mean weight, while the SED mice did (SED baseline 28.36 ± 0.37 grams, increasing to 31.04 ± 0.55 grams; p < 0.05; Fig. 2A). After 14 days of lactate injections, LAC mice lost ~4% of their starting body weight (LAC baseline 28.17 ± 0.55 grams, decreasing to 27.19 ± 0.61 grams; p < 0.001; Fig. 2A), while the VEH group maintained its weight.
Figure 2. Effect of treadmill training and lactate injection on weight, fasting glucose, and fasting insulin.

A, Over 7 weeks SED mice gained weight while EX mice did not. Over 2 weeks LAC mice lost ~4% of their starting body weight, while the VEH group maintained its weight. B, Over 7 weeks fasting blood glucose levels did not change in the EX mice but increased in the SED mice. After 2 weeks LAC mouse blood glucose levels were higher than at the start of the experiment. C, at the end of the 7-week training period, fasting plasma insulin levels were higher in the EX group than in the SED group; at the end of the 2-week injection period, fasting plasma insulin levels were lower in the LAC group than in the VEH group. D, The HOMA-IR value increased in the EX group. It was not significantly altered by lactate injection. *P < 0.05, **p < 0.001.
Over the course of the study fasting blood glucose levels did not change in the EX mice, while SED mouse blood glucose levels increased. At the end of the 7 weeks, the SED fasting blood glucose was 111 ± 6.4 mg/dL, and in the EX mice it was 94.8 ± 4.61 mg/dL (p = 0.05; Fig. 2B). In the LAC mice, blood glucose levels rose over the course of the study. At the end of the 2 week injection period, the LAC mouse mean fasting blood glucose level rose from 91.25 ± 3.15 mg/dL to 110.31 ± 4.82 (p < 0.05; Fig. 2B).
Fasting plasma insulin levels were higher in the EX group at the end of the 7-week training period than they were in the SED group. The final plasma insulin level in the SED group was 0.33 ± 0.06 ng/mL, and in the EX group it was 0.68 ± 0.11 ng/mL (p < 0.05; Fig. 2C). At the end of the 2-week injection period, fasting plasma insulin levels were lower in the LAC group than they were in the VEH group. The final plasma insulin level in the LAC group was 0.24 ± 0.03 ng/mL, and in the VEH group it was 0.37 ± 0.05 ng/mL (p < 0.05; Fig. 2C). The HOMA-IR calculation, interestingly, at face value suggested that 7 weeks of intensive exercise training actually decreased insulin sensitivity. In the SED mice the HOMA-IR value was 2.25 ± 0.34, and in the EX mice it was 3.94 ± 0.64 (p < 0.05; Fig. 2D). HOMA-IR values trended lower in the LAC group when compared to those in the VEH group (1.61 ± 0.22 in the LAC group, 2.2 ± 0.27 in the VEH group), but this difference was not significant (p = 0.1; Fig. 2D).
Effect of treadmill training and lactate injections on liver bioenergetics-related gene expression and mtDNA levels
Exercise and lactate injection enhanced the liver gluconeogenesis infrastructure. PCK1 expression was ~30% more in the EX group than it was in the SED group (p < 0.05). In the LAC versus VEH group comparison, PCK1 expression trended higher in the LAC group but this inter-group difference was not significant (p = 0.07) (Fig 3). PDK4 expression was ~120% higher in the EX group than it was in the SED group (p < 0.05), and ~50% higher in the LAC group than it was in the VEH group (p < 0.05) (Fig. 3).
Figure 3. Effect of treadmill training and lactate injection on liver gluconeogenesis.

Compared to the SED mice, PCK1 and PDK4 mRNA levels were higher in the EX mouse livers. Compared to the VEH mice, PCK1 expression trended higher in the LAC group livers, while PDK4 expression increased in the LAC group livers. *P < 0.05
The co-transcriptional activator PGC-1α also influences hepatic gluconeogenesis (Herzig et al. 2001). Relative to their respective control groups, PGC-1α mRNA levels were increased ~150% in EX mouse livers (p < 0.001), and ~75% in LAC mouse livers (p < 0.001) (Fig. 4). Exercise and lactate, though, had the opposite effect on PGC-1β, another member of the PGC-1 co-transcription factor family. Liver PGC-1β mRNA expression decreased by ~35% in the EX mice (p < 0.05), and by ~50% in the LAC mice (p < 0.001) (Fig. 4). mRNA levels of PRC, a third member of the PGC-1 family (Scarpulla 2008), were comparable between the EX and SED groups as well as between the LAC and VEH groups (Fig. 4).
Figure 4. Effect of treadmill training and lactate injection on genes that regulate liver mitochondrial biogenesis.

Relative to their respective control groups, EX and LAC group PGC- 1α mRNA levels increased whereas PGC-1β mRNA levels decreased. PRC mRNA levels remained comparable. NRF-1 mRNA levels were lower in EX and LAC group livers. TFAM mRNA levels were lower in the EX group than they were in the SED group, and comparable between the LAC and VEH groups. *P < 0.05, **p < 0.001.
Both PGC-1α and PGC-1β mediate some co-transcriptional effects through the NRF-1 transcription factor (Lin et al. 2002, Lin et al. 2003). Liver NRF-1 mRNA levels were ~15% lower in EX mice than they were in SED mice (p < 0.05), and ~15% lower in LAC mice than they were in VEH mice (p < 0.05) (Fig. 4). TFAM mRNA levels were ~20% lower in EX mouse livers than they were in SED mouse livers (p < 0.001), but liver TFAM expression was equivalent between the LAC and VEH groups (Fig. 4).
mtDNA levels were assessed by determining mtDNA to nDNA copy number ratios. Liver 16s rRNA/18s rRNA and ND2/18s rRNA ratios were comparable between the EX and SED groups (Fig. 5). For the VEH and LAC groups, no differences in either the 16s rRNA/18s rRNA or ND2/18s rRNA ratios were observed, although the ND2/18s rRNA ratio arguably trended lower in the LAC group (p = 0.08, Fig. 5).
Figure 5. Effect of treadmill training and lactate injection on liver mtDNA copy number.

In liver, 16s rRNA/18s rRNA and ND2/18s rRNA ratios were comparable between the EX and SED groups. The 16s rRNA/18s rRNA ratio was comparable between the VEH and LAC groups. Compared to the VEH group, the LAC group ND2/18s rRNA ratio trended lower but these values were not statistically different.
Effect of treadmill training and lactate injections on brain bioenergetics-related gene expression and mtDNA levels
We did not find significant inter-group differences in brain PGC-1α, PGC-1β, NRF-1, or TFAM mRNA levels. We saw an equivalent expression of these genes between the SED and EX groups, and between the LAC and VEH groups. Expression levels of PRC, though, increased by ~25% in the EX mouse brains compared to the SED mouse brains (p < 0.05), and by ~30% in the LAC mouse brains compared to the VEH mouse brains (p < 0.05) (Fig. 6). As brain is not typically considered to be a gluconeogenic organ, we did not assess PCK1 and PDK4 expression.
Figure 6. Effect of treadmill training and lactate injection on genes that regulate brain mitochondrial biogenesis.
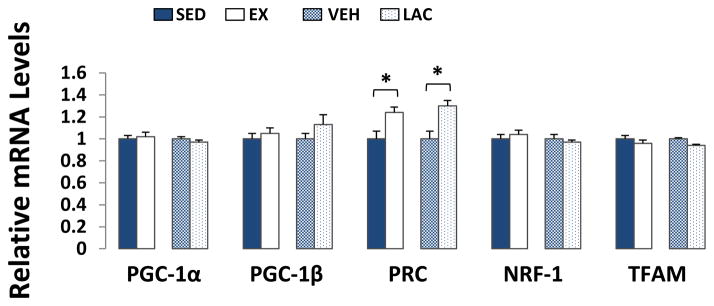
Compared to their respective control groups, brain PRC expression increased in the EX and LAC groups. Exercise and lactate injection did not alter brain PGC-1α, PGC-1β, NRF-1, or TFAM mRNA levels. *P < 0.05
The brain 16s rRNA/18s rRNA ratio was ~20% higher in the EX mice than it was in the SED mice (p < 0.05), and the ND2/18s rRNA ratio was ~15% higher in the EX mice than it was in the SED mice (p < 0.05) (Fig. 7). Brain mtDNA levels between the VEH and LAC groups were comparable.
Figure 7. Effect of treadmill training and lactate injection on brain mtDNA copy number.

16s rRNA/18s rRNA and ND2/18s rRNA ratios were higher in EX brains than they were in SED brains. VEH and LAC brain mtDNA levels were comparable. *P < 0.05
We assessed the effects of supra-lactate threshold exercise and exogenous lactate treatment on the brain’s expression of TNF-α, an inflammation mediator, and VEGF-A, an angiogenenic/neurogenic growth factor (Jin et al. 2002). Brain TNF-α mRNA levels were ~30% lower in EX mouse brains than they were in SED mouse brains (p < 0.05), but were comparable between VEH and LAC brains (Fig. 8). VEGF-A expression was ~20% higher in EX brains than it was in SED brains (p < 0.05), and ~15% higher in LAC brains than it was in VEH brains (p < 0.05) (Fig. 8). Despite this VEGF increase, mRNA and protein levels of HIF-1α, a protein that activates VEGF transcription (Pugh & Ratcliffe 2003), were equivalent between the EX and SED brains and between the LAC and VEH brains (data not shown).
Figure 8. Effect of treadmill training and lactate injection on brain TNF-α and VEGF-A expression.

TNF-α mRNA levels were lower in EX brains than they were in SED brains, but were comparable between VEH and LAC brains. Brain VEGF-A expression was higher in EX brains than it was in SED brains, and was higher in LAC brains than it was in VEH brains. *P < 0.05
We examined the relationship between brain VEGF-A and PRC mRNA levels. When data were combined from all 4 groups, a strong positive correlation between VEGF-A and PRC mRNA levels was observed (r = 0.665, p < 0.001) (Fig. 9).
Figure 9. Relationship between brain VEGF-A and PRC mRNA levels.

When data from all 4 groups were combined, a positive correlation between brain VEGF-A and PRC mRNA levels was observed.
Discussion
Our current study shows supra-lactate threshold exercise and lactate itself in some ways similarly alter brain and liver bioenergetic infrastructures. Overlapping changes involve the expression of genes that monitor, respond to, and modify cell bioenergetic states. Our data suggest that in the liver, exercise-generated lactate enhances gluconeogenic infrastructure while reducing expression levels of some proteins that maintain respiration-associated infrastructures. In the brain, exercise-generated lactate enhances PRC and VEGF expression and does not down- regulate respiration-related infrastructures. In general, in the liver and brain, lactate itself to some extent functions as an exercise mimetic. These findings have clinical and clinical trial- design implications.
In this study hepatic gluconeogenesis data come from mice exercised above the lactate threshold. Our current findings are consistent with a previous study in which mice exercised below the lactate threshold (E et al. 2012). The liver plays a central role in the Cori Cycle, in which exercise-generated lactate is removed from the blood and used to generate glucose. It is not surprising, then, that the expression of two gluconeogenic genes, PCK1 and PDK4, increased in the livers of EX and LAC mice and that mRNA levels of PGC-1α, which promotes hepatic gluconeogenic gene expression (Herzig et al. 2001), also increased.
PGC-1α is the most studied PGC-1 family member; the effects of exercise on PGC-1β and PRC are not well known. In general, PGC-1β drives gluconeogenic gene expression less robustly than PGC-1α, but is a stronger activator of NRF-1 and inducer of respiration-relevant gene expression (Lin et al. 2002, Lin et al. 2003). PGC-1β, therefore, likely supports cell respiration to a greater extent than PGC-1α.
The liver, of course, helps avoid hypoglycemia. To counter hypoglycemia under conditions of increased glucose utilization, a state that exercise may induce, the liver imports lactate from the blood, converts it to glucose, and releases glucose into the blood. An increase in hepatic respiration could theoretically compete with this role. Avoiding this competition could perhaps explain why exercise associates with increased liver PGC-1α expression but decreased PGC-1β expression.
We also explored the ability of exercise and lactate to modify the expression of bioenergetics-associated genes in the brain. Lactate certainly appears to play a critical role in brain energy metabolism (Boumezbeur et al. 2010, van Hall et al. 2009, Wyss et al. 2011), and while most brain lactate is regionally generated by astrocytes in response to local metabolic activity, externally generated lactate accesses the brain via MCTs (Pierre & Pellerin 2005). In this study, we found supra-lactate threshold exercise and intraperitoneal lactate injections both increase brain VEGF-A mRNA expression. This suggests exercise-generated lactate could at least partly mediate exercise’s ability to increase brain VEGF-A mRNA levels. VEGF-A expression is also elevated within tumor cells, which frequently overproduce lactate (Walenta & Mueller-Klieser 2004, Siemeister et al. 1998). The possibility that tumor-generated lactate might contribute to increased tumor VEGF-A expression seems worth considering.
VEGF is believed to play a critical role in exercise-induced neurogenesis (Fabel et al. 2003, Latimer et al. 2011, Tang et al. 2010). In general, this signal protein binds specific cell membrane tyrosine kinase receptors (VEGFRs), and this binding stimulates angiogenesis (Cross et al. 2003). Exercise induces VEGF expression in mouse and rat brains, where it drives dentate gyrus, cerebellum, and hippocampus angiogenesis (Pereira et al. 2007, Fabel et al. 2003, Black et al. 1990). Angiogenesis in general is activated by hypoxia, which initiates HIF-1α nuclear translocation, and HIF-1 complex formation activates VEGF transcription (Pugh & Ratcliffe 2003). While one study found intense exercise reduced brain mitochondrial O2 (Secher et al. 2008), because HIF-1α mRNA and protein levels did not change we cannot implicate hypoxia as the cause of our observed brain VEGF increase.
PGC-1α, interestingly, increases VEGF expression via estrogen-related receptor alpha (ERR-α) co-activation (Arany et al. 2008). While PGC-1α expression was not increased in either EX or LAC mouse brains, we did not assess PGC-1α protein levels or activation states. We therefore cannot conclude PGC-1α did not mediate VEGF expression.
mRNA levels of PRC, another PGC-1 family member, increased in both EX and LAC mouse brains. PRC also interacts with ERR-α to induce mitochondria-related gene transcription, and in general supports mitochondrial ATP production (Mirebeau-Prunier et al. 2010, Vercauteren et al. 2009). Although it is not currently known whether PRC specifically stimulates VEGF expression, we observed a positive correlation between mouse brain PRC and VEGF-A mRNA expression. This correlation suggests PRC may play a role in mediating exercise and lactate-associated VEGF expression changes.
Unlike hepatocytes, which use lactate to support gluconeogenesis, neurons mostly use lactate to support respiration (Erlichman et al. 2008, Gallagher et al. 2009, Pellerin & Magistretti 1994, Wyss et al. 2011). While down-regulating respiration infrastructure in the liver may have physiologic advantages, it is difficult to envision situations in which down-regulating respiration infrastructure would benefit the brain. Perhaps for this reason brain PGC-1β, NRF-1, and TFAM expression did not decline with either supra-lactate threshold exercise or the administration of exogenous lactate.
Our EX mice failed to increase brain PGC-1α mRNA expression, although Steiner et al. previously reported exercise can increase brain PGC-1α expression (Steiner et al. 2011). In that study, mice exercised on a treadmill 1 hour per day, at 25 m/min and a 5% incline, for 8 weeks. Differences between our exercise protocol and that of Steiner et al. may account for this inter- study discrepancy. Our lactate injection data, though, suggest exercise-generated lactate did not drive the brain PGC-1α mRNA increase observed by Steiner et al.
Similarly, we could not prove that lactate mediates an exercise-associated increase in brain mtDNA. While mtDNA content was higher in EX mice than it was in SED mice, mtDNA levels between LAC and VEH mice were equivalent. Although our study joins several others that also found exercise increases brain mtDNA copy number (Bayod et al. 2011, Marosi et al. 2012, Zhang et al. 2012a, Zhang et al. 2012b, Steiner et al. 2011), what causes this phenomenon remains unclear. In addition to arguing that lactate is not solely responsible, our data further suggest PGC-1α expression changes are not a prerequisite.
As we found in a study of mice exercised below the lactate accumulation threshold (E et al. 2012), mice exercised above the lactate accumulation threshold have lower brain TNF-α expression. LAC mice did not show reduced brain TNF-α mRNA, which suggests lactate does not account for this change. The exercise-related mechanism that drives reduced brain TNF-α expression remains unknown.
In this study, exercise training profoundly enhanced lactate thresholds and exceeding this threshold was not, from an exercise protocol perspective, straightforward. This suggests that over the long term, exercising human subjects with chronic illnesses above the lactate threshold will be impractical. If it turns out that intensive exercise benefits the brain more than mild or moderate exercise, exercise mimetics will likely be needed.
It is worth considering whether lactate itself could serve as a clinically useful exercise mimetic. Over the two-week lactate treatment period mild weight loss occurred; it is unclear whether this reflects an adverse or exercise mimetic-like effect. Lactate, it is reported, may stimulate beta cell insulin secretion, suppress glycolysis, and cause insulin resistance (Meats et al. 1989, Choi et al. 2002). Although lactate treatment in our study increased blood glucose measurements, plasma insulin levels decreased and HOMA-IR values certainly did not rise.
In contrast to our lactate treatment HOMA-IR data, even though exercise is known to reduce insulin resistance our EX mice had elevated HOMA-IR values. This was driven by increased fasting insulin levels. Other investigators report that in mice exercise training increases islet insulin secretion (Huang et al. 2011), although the underlying basis of this phenomenon is unclear. Also, the HOMA-IR value primarily provides an estimate of liver insulin resistance (Bonora et al. 2000). For this reason and others we do not believe exercise truly increased overall insulin resistance in our EX mouse group.
For our two experimental groups, the exercised mice and the lactate-injected mice, we did not attempt to exactly match the pharmacokinetic parameters of brain and liver lactate exposure. Maximum levels and daily exposure durations were almost certainly different between these groups, and the number of days of increased lactate exposure definitely differed. This was partly a consequence of feasibility limitations, since accomplishing this would have required us to repeatedly sample mouse plasma lactate levels while the mice were running on the treadmill. Our goal, though, was simply to test whether administering lactate itself induces some of the same bioenergetic infrastructure and bioenergetic-related changes that exercise induces. Our data argue it does.
We did not specifically test whether lactate affects liver and brain bioenergetic pathway flux dynamics in different or similar ways, although our molecular-based data predict differences should outweigh similarities. Unlike the liver, the brain is not considered a gluconeogenic organ. Neurons do not express glucose-6-phosphatase, the enzyme that mediates the final step of gluconeogenesis (Lehninger et al. 2005, Bell et al. 1993). Although astrocytes do express glucose-6-phosphatase, astrocytes dephosphorylate glucose at much lower rates than they phosphorylate glucose. This contrasts with liver-derived observations (Ghosh et al. 2005, Bhattacharya & Datta 1993, Gotoh et al. 2000). Further, astrocytes express the MCT4 monocarboxylate transporter isoform, which favors lactate export over import, while neurons express MCT2 transporters that favor lactate import (Pierre & Pellerin 2005). Overall, bioenergetic cross-talk between neurons and astrocytes seems designed to favor lactate production by astrocytes and lactate consumption by neurons. For these reasons, we suspect that while liver lactate exposure increases liver gluconeogenesis, increasing brain lactate levels should cause no or little increase in brain gluconeogenesis. This prediction, though, remains experimentally unconfirmed.
In conclusion, our results are consistent with the view that during exercise, muscle- generated lactate accounts for at least some exercise-associated brain and liver bioenergetic infrastructure and bioenergetic-associated adaptations. These adaptations are tissue-specific, are defined by each tissue’s bioenergetic-related needs and obligations, and based on these needs and obligations are ultimately predictable. Lactate enhances hepatic gluconeogenesis while probably limiting hepatocyte respiration. Although lactate probably does not account for all major exercise-related, bioenergetics-associated brain changes, it does appear that it is able to induce brain VEGF expression and through this may drive brain angiogenesis and neurogenesis. For this reason, exercise mimetics that reproduce lactate’s brain effects are worth developing for, and testing in, conditions with perturbed brain energy metabolism.
Acknowledgments
Supported by the University of Kansas Alzheimer’s Disease Center (P30-AG035982) and the Frank and Evangeline Thompson Alzheimer’s Treatment Development Fund (to RHS), and a Mabel Woodyard Fellowship Award (to LE). The University of Kansas Alzheimer’s Disease Center Mitochondrial Genomics and Metabolism Core provided technical support.
Abbreviations
- AD
Alzheimer’s disease
- BDNF
brain derived neurotrophic factor
- ERR-α
estrogen-related receptor alpha
- GAPDH
glyceraldehyde 3-phosphate dehydrogenase
- HIF-1α
hypoxia- inducible factor alpha
- HOMA-IR
homeostasis model assessment of insulin resistance
- MCT
monocarboxylate transporter
- mtDNA
mitochondrial DNA
- ND2
NADH dehydrogenase subunit 2
- NRF-1
nuclear respiratory factor 1
- PCK1
phosphoenolpyruvate carboxykinase 1
- PDK4
pyruvate dehydrogenase kinase 4
- PGC-1
peroxisome proliferator-activated receptor- gamma coactivator 1
- PRC
PGC-1 related co-activator
- rRNA
ribosomal RNA
- TFAM
mitochondrial transcription factor A
- TNF-α
tumor necrosis factor alpha
- VEGF-A
vascular endothelial growth factor A
Footnotes
No conflicts of interest, financial or otherwise, are declared by the authors.
References
- Arany Z, Foo SY, Ma Y, et al. HIF-independent regulation of VEGF and angiogenesis by the transcriptional coactivator PGC-1alpha. Nature. 2008;451:1008–1012. doi: 10.1038/nature06613. [DOI] [PubMed] [Google Scholar]
- Bayod S, Del Valle J, Canudas AM, Lalanza JF, Sanchez-Roige S, Camins A, Escorihuela RM, Pallas M. Long-term treadmill exercise induces neuroprotective molecular changes in rat brain. J Appl Physiol. 2011;111:1380–1390. doi: 10.1152/japplphysiol.00425.2011. [DOI] [PubMed] [Google Scholar]
- Bell JE, Hume R, Busuttil A, Burchell A. Immunocytochemical detection of the microsomal glucose-6-phosphatase in human brain astrocytes. Neuropathology and applied neurobiology. 1993;19:429–435. doi: 10.1111/j.1365-2990.1993.tb00465.x. [DOI] [PubMed] [Google Scholar]
- Berthet C, Lei H, Thevenet J, Gruetter R, Magistretti PJ, Hirt L. Neuroprotective role of lactate after cerebral ischemia. J Cereb Blood Flow Metab. 2009;29:1780–1789. doi: 10.1038/jcbfm.2009.97. [DOI] [PubMed] [Google Scholar]
- Bhattacharya SB, Datta AG. Is brain a gluconeogenic organ? Molecular and cellular biochemistry. 1993;125:51–57. doi: 10.1007/BF00926834. [DOI] [PubMed] [Google Scholar]
- Billat VL, Mouisel E, Roblot N, Melki J. Inter- and intrastrain variation in mouse critical running speed. J Appl Physiol. 2005;98:1258–1263. doi: 10.1152/japplphysiol.00991.2004. [DOI] [PubMed] [Google Scholar]
- Black JE, Isaacs KR, Anderson BJ, Alcantara AA, Greenough WT. Learning causes synaptogenesis, whereas motor activity causes angiogenesis, in cerebellar cortex of adult rats. Proc Natl Acad Sci U S A. 1990;87:5568–5572. doi: 10.1073/pnas.87.14.5568. [DOI] [PMC free article] [PubMed] [Google Scholar]
- Bonora E, Targher G, Alberiche M, Bonadonna RC, Saggiani F, Zenere MB, Monauni T, Muggeo M. Homeostasis model assessment closely mirrors the glucose clamp technique in the assessment of insulin sensitivity: studies in subjects with various degrees of glucose tolerance and insulin sensitivity. Diabetes Care. 2000;23:57–63. doi: 10.2337/diacare.23.1.57. [DOI] [PubMed] [Google Scholar]
- Boumezbeur F, Petersen KF, Cline GW, Mason GF, Behar KL, Shulman GI, Rothman DL. The contribution of blood lactate to brain energy metabolism in humans measured by dynamic 13C nuclear magnetic resonance spectroscopy. J Neurosci. 2010;30:13983–13991. doi: 10.1523/JNEUROSCI.2040-10.2010. [DOI] [PMC free article] [PubMed] [Google Scholar]
- Choi CS, Kim YB, Lee FN, Zabolotny JM, Kahn BB, Youn JH. Lactate induces insulin resistance in skeletal muscle by suppressing glycolysis and impairing insulin signaling. Am J Physiol Endocrinol Metab. 2002;283:E233–240. doi: 10.1152/ajpendo.00557.2001. [DOI] [PubMed] [Google Scholar]
- Cross MJ, Dixelius J, Matsumoto T, Claesson-Welsh L. VEGF-receptor signal transduction. Trends Biochem Sci. 2003;28:488–494. doi: 10.1016/S0968-0004(03)00193-2. [DOI] [PubMed] [Google Scholar]
- Duncan JG. Mitochondrial dysfunction in diabetic cardiomyopathy. Biochim Biophys Acta. 2011;1813:1351–1359. doi: 10.1016/j.bbamcr.2011.01.014. [DOI] [PMC free article] [PubMed] [Google Scholar]
- EL, Lu J, Burns JM, Swerdlow RH. Effect of Exercise on Mouse Liver and Brain Bioenergetic Infrastructures. Exp Physiol. 2012 doi: 10.1113/expphysiol.2012.066688. [DOI] [PMC free article] [PubMed] [Google Scholar]
- Erlichman JS, Hewitt A, Damon TL, Hart M, Kurascz J, Li A, Leiter JC. Inhibition of monocarboxylate transporter 2 in the retrotrapezoid nucleus in rats: a test of the astrocyte-neuron lactate-shuttle hypothesis. J Neurosci. 2008;28:4888–4896. doi: 10.1523/JNEUROSCI.5430-07.2008. [DOI] [PMC free article] [PubMed] [Google Scholar]
- Fabel K, Fabel K, Tam B, Kaufer D, Baiker A, Simmons N, Kuo CJ, Palmer TD. VEGF is necessary for exercise-induced adult hippocampal neurogenesis. Eur J Neurosci. 2003;18:2803–2812. doi: 10.1111/j.1460-9568.2003.03041.x. [DOI] [PubMed] [Google Scholar]
- Fontan-Lozano A, Lopez-Lluch G, Delgado-Garcia JM, Navas P, Carrion AM. Molecular bases of caloric restriction regulation of neuronal synaptic plasticity. Mol Neurobiol. 2008;38:167–177. doi: 10.1007/s12035-008-8040-1. [DOI] [PubMed] [Google Scholar]
- Gallagher CN, Carpenter KL, Grice P, et al. The human brain utilizes lactate via the tricarboxylic acid cycle: a 13C-labelled microdialysis and high-resolution nuclear magnetic resonance study. Brain. 2009;132:2839–2849. doi: 10.1093/brain/awp202. [DOI] [PubMed] [Google Scholar]
- Ghosh A, Cheung YY, Mansfield BC, Chou JY. Brain contains a functional glucose-6-phosphatase complex capable of endogenous glucose production. The Journal of biological chemistry. 2005;280:11114–11119. doi: 10.1074/jbc.M410894200. [DOI] [PubMed] [Google Scholar]
- Gotoh J, Itoh Y, Kuang TY, Cook M, Law MJ, Sokoloff L. Negligible glucose-6-phosphatase activity in cultured astroglia. Journal of neurochemistry. 2000;74:1400–1408. doi: 10.1046/j.1471-4159.2000.0741400.x. [DOI] [PubMed] [Google Scholar]
- Guo W, Jiang L, Bhasin S, Khan SM, Swerdlow RH. DNA extraction procedures meaningfully influence qPCR-based mtDNA copy number determination. Mitochondrion. 2009;9:261–265. doi: 10.1016/j.mito.2009.03.003. [DOI] [PMC free article] [PubMed] [Google Scholar]
- Herzig S, Long F, Jhala US, et al. CREB regulates hepatic gluconeogenesis through the coactivator PGC-1. Nature. 2001;413:179–183. doi: 10.1038/35093131. [DOI] [PubMed] [Google Scholar]
- Hood DA, Irrcher I, Ljubicic V, Joseph AM. Coordination of metabolic plasticity in skeletal muscle. J Exp Biol. 2006;209:2265–2275. doi: 10.1242/jeb.02182. [DOI] [PubMed] [Google Scholar]
- Huang HH, Farmer K, Windscheffel J, Yost K, Power M, Wright DE, Stehno-Bittel L. Exercise increases insulin content and basal secretion in pancreatic islets in type 1 diabetic mice. Exp Diabetes Res. 2011;2011:481427. doi: 10.1155/2011/481427. [DOI] [PMC free article] [PubMed] [Google Scholar]
- Jin K, Zhu Y, Sun Y, Mao XO, Xie L, Greenberg DA. Vascular endothelial growth factor (VEGF) stimulates neurogenesis in vitro and in vivo. Proc Natl Acad Sci U S A. 2002;99:11946–11950. doi: 10.1073/pnas.182296499. [DOI] [PMC free article] [PubMed] [Google Scholar]
- Latimer CS, Searcy JL, Bridges MT, Brewer LD, Popovic J, Blalock EM, Landfield PW, Thibault O, Porter NM. Reversal of glial and neurovascular markers of unhealthy brain aging by exercise in middle-aged female mice. PLoS One. 2011;6:e26812. doi: 10.1371/journal.pone.0026812. [DOI] [PMC free article] [PubMed] [Google Scholar]
- Lehninger AL, Nelson DL, Cox MM. Lehninger principles of biochemistry. W.H. Freeman; New York: 2005. [Google Scholar]
- Lin J, Puigserver P, Donovan J, Tarr P, Spiegelman BM. Peroxisome proliferator-activated receptor gamma coactivator 1beta (PGC-1beta), a novel PGC-1- related transcription coactivator associated with host cell factor. The Journal of biological chemistry. 2002;277:1645–1648. doi: 10.1074/jbc.C100631200. [DOI] [PubMed] [Google Scholar]
- Lin J, Tarr PT, Yang R, Rhee J, Puigserver P, Newgard CB, Spiegelman BM. PGC-1beta in the regulation of hepatic glucose and energy metabolism. The Journal of biological chemistry. 2003;278:30843–30848. doi: 10.1074/jbc.M303643200. [DOI] [PubMed] [Google Scholar]
- Marosi K, Bori Z, Hart N, Sarga L, Koltai E, Radak Z, Nyakas C. Long-term exercise treatment reduces oxidative stress in the hippocampus of aging rats. Neuroscience. 2012 doi: 10.1016/j.neuroscience.2012.09.001. [DOI] [PubMed] [Google Scholar]
- Matthews DR, Hosker JP, Rudenski AS, Naylor BA, Treacher DF, Turner RC. Homeostasis model assessment: insulin resistance and beta-cell function from fasting plasma glucose and insulin concentrations in man. Diabetologia. 1985;28:412–419. doi: 10.1007/BF00280883. [DOI] [PubMed] [Google Scholar]
- Meats JE, Tuersley MD, Best L, Lynch AM, Tomlinson S. Lactate alters plasma membrane potential, increases the concentration of cytosolic Ca2+ and stimulates the secretion of insulin by the hamster beta-cell line HIT-T15. J Mol Endocrinol. 1989;3:121–128. doi: 10.1677/jme.0.0030121. [DOI] [PubMed] [Google Scholar]
- Mirebeau-Prunier D, Le Pennec S, Jacques C, Gueguen N, Poirier J, Malthiery Y, Savagner F. Estrogen-related receptor alpha and PGC-1-related coactivator constitute a novel complex mediating the biogenesis of functional mitochondria. FEBS J. 2010;277:713–725. doi: 10.1111/j.1742-4658.2009.07516.x. [DOI] [PubMed] [Google Scholar]
- Newman LA, Korol DL, Gold PE. Lactate produced by glycogenolysis in astrocytes regulates memory processing. PLoS One. 2011;6:e28427. doi: 10.1371/journal.pone.0028427. [DOI] [PMC free article] [PubMed] [Google Scholar]
- Pellerin L, Magistretti PJ. Glutamate uptake into astrocytes stimulates aerobic glycolysis: a mechanism coupling neuronal activity to glucose utilization. Proc Natl Acad Sci U S A. 1994;91:10625–10629. doi: 10.1073/pnas.91.22.10625. [DOI] [PMC free article] [PubMed] [Google Scholar]
- Pereira AC, Huddleston DE, Brickman AM, et al. An in vivo correlate of exercise- induced neurogenesis in the adult dentate gyrus. Proc Natl Acad Sci U S A. 2007;104:5638–5643. doi: 10.1073/pnas.0611721104. [DOI] [PMC free article] [PubMed] [Google Scholar]
- Pierre K, Pellerin L. Monocarboxylate transporters in the central nervous system: distribution, regulation and function. Journal of neurochemistry. 2005;94:1–14. doi: 10.1111/j.1471-4159.2005.03168.x. [DOI] [PubMed] [Google Scholar]
- Pugh CW, Ratcliffe PJ. Regulation of angiogenesis by hypoxia: role of the HIF system. Nat Med. 2003;9:677–684. doi: 10.1038/nm0603-677. [DOI] [PubMed] [Google Scholar]
- Quistorff B, Secher NH, Van Lieshout JJ. Lactate fuels the human brain during exercise. FASEB J. 2008;22:3443–3449. doi: 10.1096/fj.08-106104. [DOI] [PubMed] [Google Scholar]
- Ren J, Pulakat L, Whaley-Connell A, Sowers JR. Mitochondrial biogenesis in the metabolic syndrome and cardiovascular disease. J Mol Med (Berl) 2010;88:993–1001. doi: 10.1007/s00109-010-0663-9. [DOI] [PMC free article] [PubMed] [Google Scholar]
- Rockwood K, Middleton L. Physical activity and the maintenance of cognitive function. Alzheimers Dement. 2007;3:S38–44. doi: 10.1016/j.jalz.2007.01.003. [DOI] [PubMed] [Google Scholar]
- Scarpulla RC. Transcriptional paradigms in mammalian mitochondrial biogenesis and function. Physiol Rev. 2008;88:611–638. doi: 10.1152/physrev.00025.2007. [DOI] [PubMed] [Google Scholar]
- Secher NH, Seifert T, Van Lieshout JJ. Cerebral blood flow and metabolism during exercise: implications for fatigue. J Appl Physiol. 2008;104:306–314. doi: 10.1152/japplphysiol.00853.2007. [DOI] [PubMed] [Google Scholar]
- Siemeister G, Martiny-Baron G, Marme D. The pivotal role of VEGF in tumor angiogenesis: molecular facts and therapeutic opportunities. Cancer Metastasis Rev. 1998;17:241–248. doi: 10.1023/a:1006027124696. [DOI] [PubMed] [Google Scholar]
- Steiner JL, Murphy EA, McClellan JL, Carmichael MD, Davis JM. Exercise training increases mitochondrial biogenesis in the brain. J Appl Physiol. 2011;111:1066–1071. doi: 10.1152/japplphysiol.00343.2011. [DOI] [PubMed] [Google Scholar]
- Stranahan AM, Zhou Y, Martin B, Maudsley S. Pharmacomimetics of exercise: novel approaches for hippocampally-targeted neuroprotective agents. Curr Med Chem. 2009;16:4668–4678. doi: 10.2174/092986709789878292. [DOI] [PMC free article] [PubMed] [Google Scholar]
- Suzuki A, Stern SA, Bozdagi O, Huntley GW, Walker RH, Magistretti PJ, Alberini CM. Astrocyte-neuron lactate transport is required for long-term memory formation. Cell. 2011;144:810–823. doi: 10.1016/j.cell.2011.02.018. [DOI] [PMC free article] [PubMed] [Google Scholar]
- Swerdlow RH. Role and treatment of mitochondrial DNA-related mitochondrial dysfunction in sporadic neurodegenerative diseases. Curr Pharm Des. 2011;17:3356–3373. doi: 10.2174/138161211798072535. [DOI] [PMC free article] [PubMed] [Google Scholar]
- Tang K, Xia FC, Wagner PD, Breen EC. Exercise-induced VEGF transcriptional activation in brain, lung and skeletal muscle. Respir Physiol Neurobiol. 2010;170:16–22. doi: 10.1016/j.resp.2009.10.007. [DOI] [PMC free article] [PubMed] [Google Scholar]
- van Hall G, Stromstad M, Rasmussen P, Jans O, Zaar M, Gam C, Quistorff B, Secher NH, Nielsen HB. Blood lactate is an important energy source for the human brain. J Cereb Blood Flow Metab. 2009;29:1121–1129. doi: 10.1038/jcbfm.2009.35. [DOI] [PubMed] [Google Scholar]
- Vercauteren K, Gleyzer N, Scarpulla RC. Short hairpin RNA-mediated silencing of PRC (PGC-1-related coactivator) results in a severe respiratory chain deficiency associated with the proliferation of aberrant mitochondria. The Journal of biological chemistry. 2009;284:2307–2319. doi: 10.1074/jbc.M806434200. [DOI] [PMC free article] [PubMed] [Google Scholar]
- Vina J, Gomez-Cabrera MC, Borras C, Froio T, Sanchis-Gomar F, Martinez-Bello VE, Pallardo FV. Mitochondrial biogenesis in exercise and in ageing. Adv Drug Deliv Rev. 2009;61:1369–1374. doi: 10.1016/j.addr.2009.06.006. [DOI] [PubMed] [Google Scholar]
- Walenta S, Mueller-Klieser WF. Lactate: mirror and motor of tumor malignancy. Semin Radiat Oncol. 2004;14:267–274. doi: 10.1016/j.semradonc.2004.04.004. [DOI] [PubMed] [Google Scholar]
- Wyss MT, Jolivet R, Buck A, Magistretti PJ, Weber B. In vivo evidence for lactate as a neuronal energy source. J Neurosci. 2011;31:7477–7485. doi: 10.1523/JNEUROSCI.0415-11.2011. [DOI] [PMC free article] [PubMed] [Google Scholar]
- Zhang Q, Wu Y, Sha H, Zhang P, Jia J, Hu Y, Zhu J. Early exercise affects mitochondrial transcription factors expression after cerebral ischemia in rats. Int J Mol Sci. 2012a;13:1670–1679. doi: 10.3390/ijms13021670. [DOI] [PMC free article] [PubMed] [Google Scholar]
- Zhang Q, Wu Y, Zhang P, Sha H, Jia J, Hu Y, Zhu J. Exercise induces mitochondrial biogenesis after brain ischemia in rats. Neuroscience. 2012b;205:10–17. doi: 10.1016/j.neuroscience.2011.12.053. [DOI] [PubMed] [Google Scholar]