

Abstract
Objective:
We evaluated the relationship of optical coherence tomography (OCT)–measured ganglion cell layer (GCL) and retinal nerve fiber layer (RNFL) thickness to other functional measures of afferent visual pathway competence including high-contrast visual acuity (HCVA) and low-contrast visual acuity (LCVA), visual field sensitivity, and color vision perception in a pediatric population with demyelinating disorders.
Methods:
This was a cross-sectional evaluation of 37 children, aged 8–18 years, with pediatric demyelinating disorders (n = 74 eyes), and 18 healthy controls (n = 36 eyes), who were recruited from the University of Toronto, Hospital for Sick Children and the University of Calgary, Alberta Children's Hospital, Canada. A standardized visual battery, including spectral-domain OCT, visual fields, LCVA, and HCVA, was performed in all subjects.
Results:
Mean RNFL thickness was 26 µm (25.6%) lower in patients with demyelination (76.2 μm [3.7]) compared to controls (102.4 μm [2.1]) (p < 0.0001). Mean GCL thickness was 20% lower in patients as compared to controls (p < 0.0001). Mean GCL and RNFL thickness were strongly correlated (r = 0.89; p < 0.0001), yet in contrast to RNFL thickness, no differences in GCL thickness were noted between optic neuritis (ON) eyes and non-ON eyes of patients. HCVA and LCVA and visual field mean deviation scores decreased linearly with lower RNFL thickness.
Conclusion:
GCL thickness was decreased in patients regardless of history of ON. The retina may be a site of primary neuronal injury in pediatric demyelination.
Almost one-quarter (23%) of children with acquired CNS demyelinating syndromes such as multiple sclerosis (MS), acute disseminated encephalomyelitis (ADEM), and clinically isolated syndromes present with clinically overt optic neuritis (ON),1 while even more have evidence of subclinical optic nerve disease.2 Optical coherence tomography (OCT) captures change in retinal architecture that can indicate axonal injury in the afferent visual pathway. Pediatric and adult ON patients manifest reduced peripapillary retinal nerve fiber layer (RNFL) thickness in their affected eyes.3–5 Furthermore, patients with demyelinating disorders manifest lower RNFL thickness and prolongation in visual evoked potentials (VEP) in eyes without a history of prior ON, suggesting that both tools may capture clinical and subclinical aspects of disease.3
Spectral-domain OCT and new retinal segmentation techniques allow evaluation of the ganglion cell layer (GCL) of the retina. One would anticipate that pediatric patients with ON would show evidence of damage in the GCL, suggesting loss of neuronal integrity, possibly secondary to retrograde axonal degeneration from afferent visual pathway lesions. In adults with MS, reduced GCL thickness measures correlate with visual dysfunction6,7 and quality of life.7 The relationship of OCT-measured GCL thickness to other functional measures of afferent visual pathway competence has not been explored in a pediatric population with demyelinating disorders. We aimed to evaluate anterior visual pathway integrity using OCT and functional visual abnormalities as measured by high-contrast visual acuity (HCVA) and low-contrast visual acuity (LCVA), visual field (VF), and color vision evaluation in a pediatric population with demyelinating disorders.
METHODS
Study population and design.
This was a cross-sectional evaluation of 37 children, aged 8–18 years and satisfying diagnostic criteria for pediatric demyelinating disorders (n = 74 eyes),8 who were recruited from the University of Toronto, Hospital for Sick Children, and the University of Calgary, Alberta Children's Hospital, Canada. Consecutive patients were recruited from the Demyelinating Disorders Clinic at the Hospital for Sick Children and the pediatric neurology clinic in Calgary between 2010 and 2013. All patients were evaluated at least 6 months after initial presentation. The diagnoses of demyelinating disorders were based on consensus criteria promulgated by the International Pediatric MS Study Group.8,9 All diagnoses of demyelinating disorders, MS, and ON were confirmed by neurologists specializing in pediatric MS (E.A.Y., B.B., J.K.M.).
Visual testing was performed at a minimum of 6 months after the most recent objective demyelinating episode. Eighteen healthy control subjects, aged 10–18 years without a previous history of significant neurocognitive disability, severe visual impairment, neurologic disease, or inflammatory/autoimmune disease, were also evaluated.
Standard protocol approvals, registrations, and patient consents.
Research ethics board approval was obtained at both institutions, and consent/assent obtained from patients and families.
Diagnosis of ON.
ON eyes were identified based on historical or current evidence of eye pain at onset, acute or subacute decreased nonrefractive monocular or binocular visual acuity, evidence of a relative afferent pupillary defect in the affected eye in cases of monocular ON, color desaturation in the affected eyes, and a VF defect consistent with the diagnosis of ON. In some cases, the diagnosis of acute or prior ON was confirmed by an abnormal p100 pattern reversal VEP test or thickening or enhancement of the optic nerves/chiasm evident on MRI. Study participants with other alternative causes of vision loss (including amblyopia), refractive error greater than +6.00 D or less than −6.00 D, a history of ocular trauma, or any other ocular abnormality (e.g., fixation losses secondary to nystagmus) that could affect the OCT findings were excluded from the study.
Visual assessment.
Patients underwent a comprehensive neuro-ophthalmologic assessment following a standardized protocol (Y.A.R. [Toronto], F.C. [Calgary]). Eyes were tested sequentially and monocularly. Anterior and posterior segment examination was performed.
HCVA.
A computer-based HOTV crowded optotype test was performed using the modified Pediatric Eye Disease Investigator Group Ambylopia Treatment Study testing protocol,10 of initial screening, reinforcement, and consolidation of visual acuity. The final HCVA was recorded as logMAR acuity scored as the smallest resolution the participant accurately identified at least 3 out of 4 presented optotypes.
LCVA.
A wall-mounted Pelli-Robson chart was presented at 1 meter at eye level under standardized illumination conditions. Final LCVA was scored as the lowest contrast sensitivity for which the participant correctly identified at least 2 of 3 triplet optotypes.
Visual field testing.
Swedish Interactive Thresholding Algorithm standard 24-2 perimetry (Carl Zeiss Meditec, Dublin, CA) was performed. Qualified tests had a false-positive rate of less than 15% and fixation loss and false-negative rate of less than 30%. VF total deviation values were recorded in all 52 testing points. Analysis was performed using the mean of the total deviation values (MD).
Color vision.
Color vision was evaluated using Hardy-Rand-Rittler plates. Scoring was based on the number of objects identified correctly in the first 6 plates, including test plates (with a maximum of 10).
OCT testing protocol.
At both sites, all OCT scans were performed using the spectral-domain OCT Cirrus scanner (Carl Zeiss Meditec) by a trained technician. Serial optic disc and macula 200 × 200 cube scans were obtained with good centration, quantifying a 6 × 6 × 2–mm volume. Scan quality scores of greater than 7 were considered acceptable with no overt movement as detected by observing blood vessel discontinuity or distortion in the OCT en face image.
RNFL was assessed by quadrant and by average thickness; the average of all anatomic quadrants is reported for average RNFL thickness.
GCL testing.
GCL as reported in this article comprised a combination of the GCL and the inner plexiform layer (IPL). Analysis of the GCL and IPL was performed using automated segmentation analysis of 8 different parameters, including the average, minimum (lowest GCL-IPL thickness), and sectoral (superotemporal, superior, superonasal, inferonasal, inferior, inferotemporal) thickness around the fovea, as described elsewhere.11 An algorithm, described elsewhere, was then applied to these measurements to obtain the GCL thickness as reported.11
Analysis.
The main outcomes in this study were OCT-measured mean RNFL thickness, temporal quadrant RNFL thickness, and GCL thickness, and the relationship of these OCT measures to functional outcomes including HCVA and LCVA. Secondary outcomes included VF MD and color vision score (out of a total of 10 plates) after initial presentation.
Continuous variables were summarized as mean (SD) or median (interquartile range [IQR]) as appropriate. Categorical variables were described as frequency (percent). Demographic characteristics of cases and controls were compared using χ2 tests, t tests, and Wilcoxon tests as appropriate. We evaluated the associations between RNFL and GCL thickness and measures of visual function as defined above. The unit of assessment for this study was monocular OCT values. However, the 2 eyes of the same participant are correlated and cannot be considered as independent. For regression analyses, we fitted generalized linear models using generalized estimating equations to account for the correlation between pairs of eyes. For HCVA, LCVA, and MD, we used a normal distribution and identity link, while for color vision we used a cumulative logit model. We used an unstructured correlation matrix in which no assumptions were made about the correlations between eyes. In a subgroup analysis, we evaluated the association between number of episodes of ON (0, 1, 2, or more episodes) and visual measures. p Values <0.05 were considered significant. Analyses were performed using SAS V9.3.1 (SAS Institute, Cary, NC).
RESULTS
Demographics and clinical features.
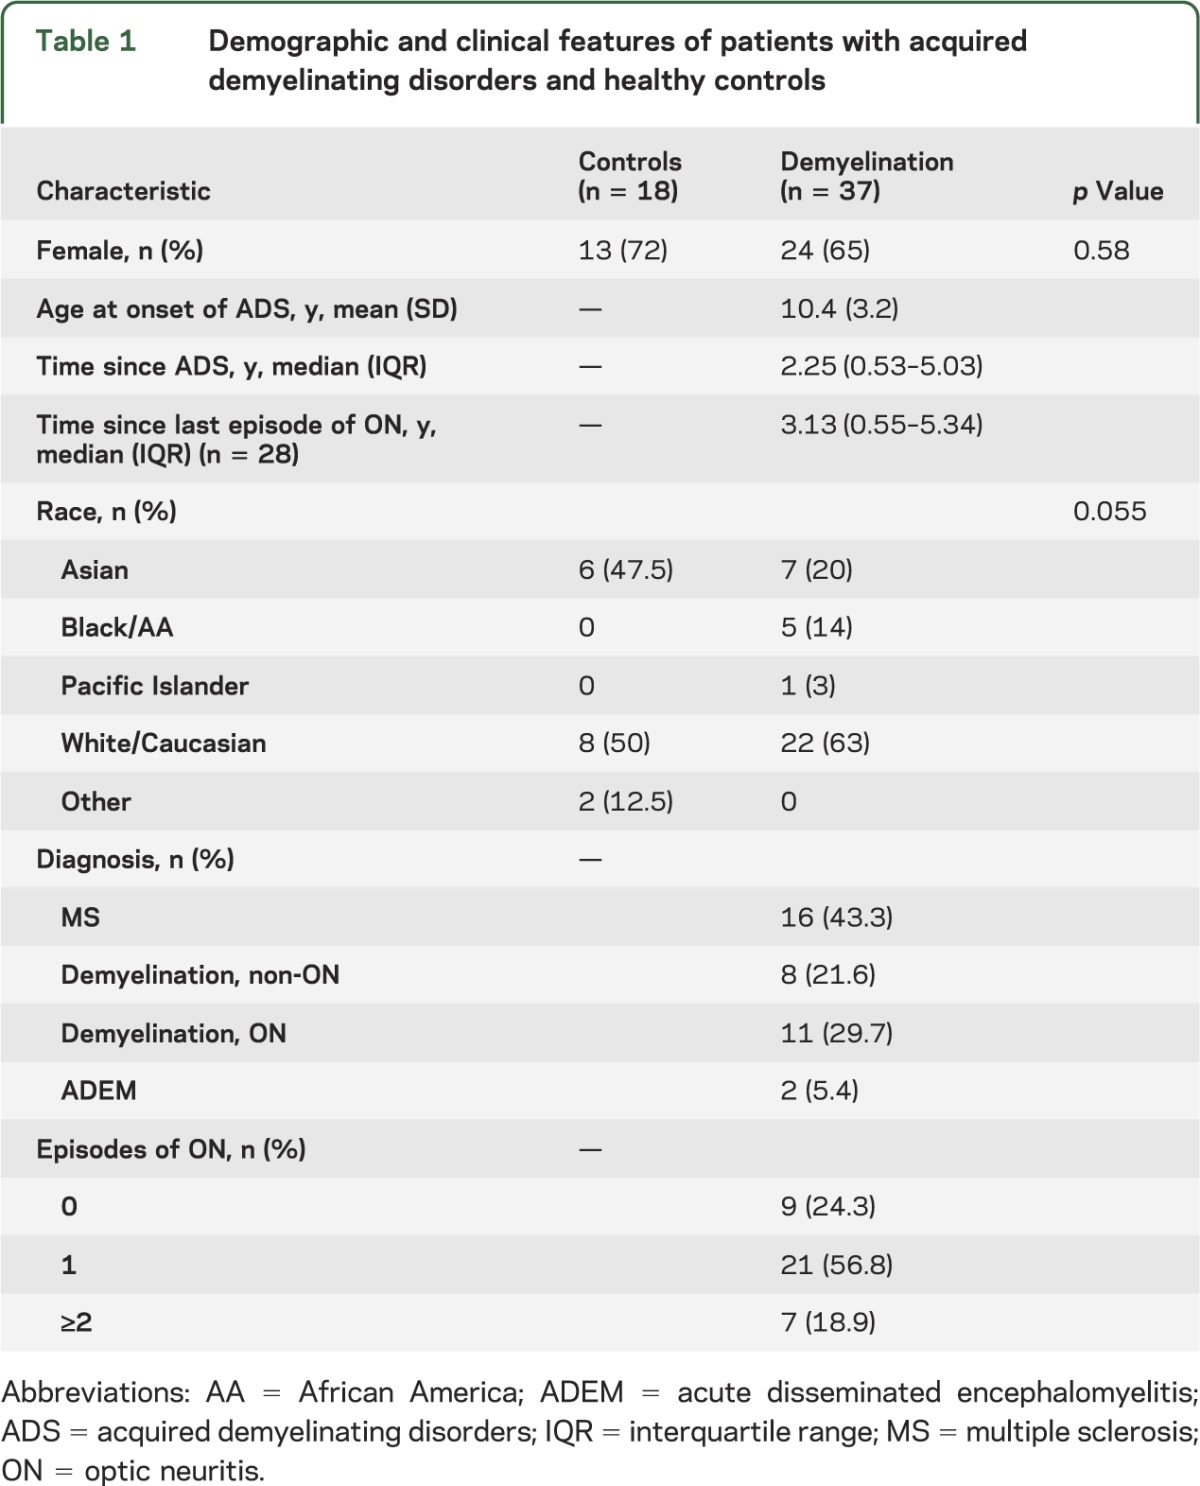
More than 40% of patients had MS, while one-fifth had ON without a diagnosis of MS or neuromyelitis optica. The remaining patients had monophasic demyelinating events that did not involve the optic nerve and did not meet diagnostic criteria for MS or neuromyelitis optica. The baseline demographic and clinical characteristics for patients and controls are included in table 1.
Table 1.
Demographic and clinical features of patients with acquired demyelinating disorders and healthy controls
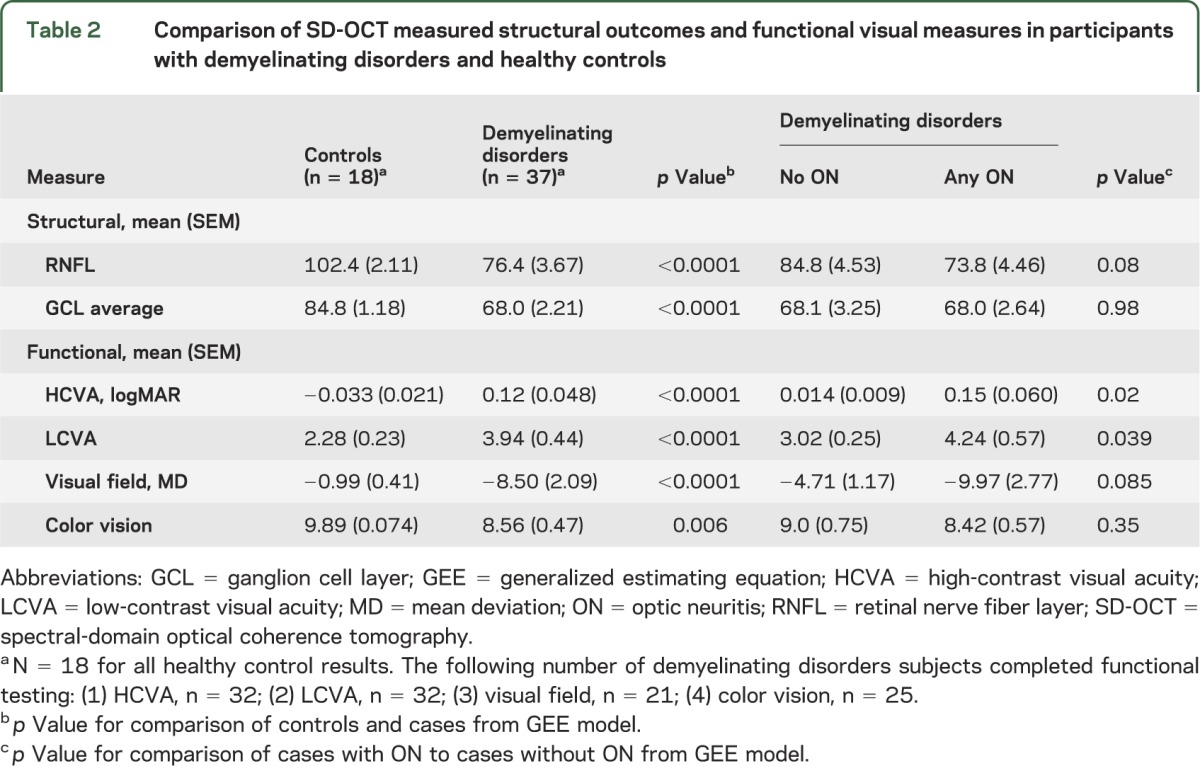
Comparing RNFL and GCL measures between patients and controls.
Mean RNFL thickness was 26 μm (25.6%) lower in patients with demyelination (76.2 μm [3.7]) compared to controls (102.4 μm [2.1]) (p < 0.0001), with the lowest RNFL thickness measures noted in ON eyes of patients with demyelination (table 2). Measures of quadrant RNFL thickness were lower in patients than controls, with the most marked differences between groups noted in the temporal and inferior quadrants (table e-1 on the Neurology® Web site at Neurology.org). Similarly, mean GCL thickness was 20% lower in patients as compared to controls (p < 0.0001, table 2). Mean GCL and RNFL thickness were strongly correlated (r = 0.89; p < 0.0001), yet in contrast to RNFL thickness, no differences in GCL thickness (including mean and sector values) were noted between ON eyes and non-ON eyes.
Table 2.
Comparison of SD-OCT measured structural outcomes and functional visual measures in participants with demyelinating disorders and healthy controls
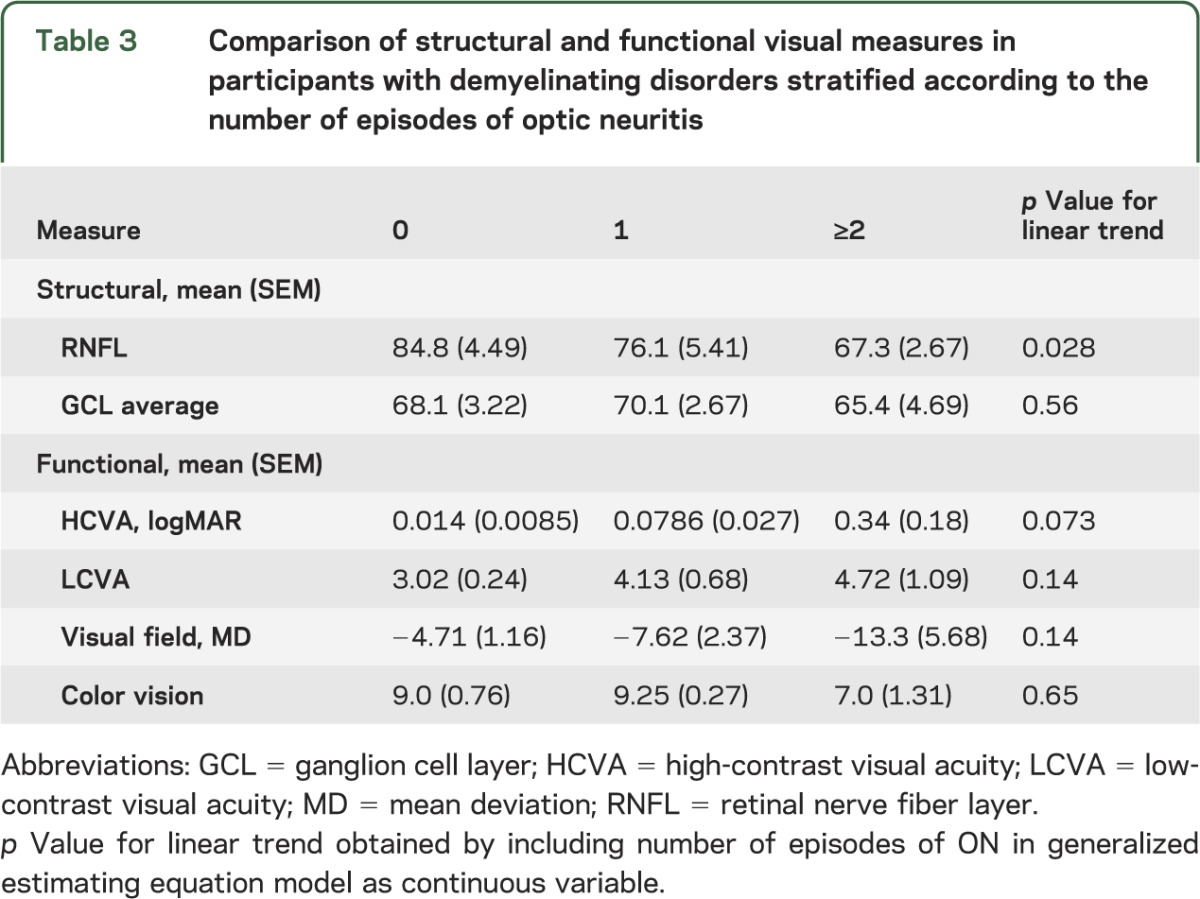
RNFL and GCL measures: Effects of recurrent ON.
When classified by number of episodes of ON (0, 1, 2, or more episodes), mean (SD) RNFL thickness declined by approximately 9 μm per ON episode (p = 0.028 for linear trend; see table 3). Interestingly, no difference was seen in the mean (SD) GCL thickness between patients with 0 (68.1 μm [3.3]), 1 (70.1 μm [2.8]), or 2 or more episodes of ON (65.4 μm [4.9]).
Table 3.
Comparison of structural and functional visual measures in participants with demyelinating disorders stratified according to the number of episodes of optic neuritis
Comparing tests of VF between patients with acute demyelinating syndromes and healthy control subjects.
Patients demonstrated lower scores in tests of visual function relative to controls (table 2), and both HCVA and LCVA scores were lower in ON eyes than non-ON eyes. Similarly, VF MD scores were lower in patients relative to controls, with the lowest scores noted in patients with a history of ON (table 2).
Comparing OCT measures and visual outcomes in patients with acute demyelinating syndromes.
Lower RNFL thickness was linearly associated with reduced HCVA scores (β = −0.0052, p = 0.022). Among patients, lower RNFL thickness was linearly associated with reduced LCVA scores (β = −0.053, p = 0.0053). A history of ON did not impact HCVA or LCVA over and above the effect of RNFL thickness, suggesting that extent of RNFL loss can provide a marker of the effect of an episode of ON on visual acuity.
Among patients with RNFL thickness below a threshold of <87 μm (a value below the lowest value observed in control subjects), 51.3% had an abnormal result on HCVA testing, whereas 100% had an abnormal result on LCVA testing. These results indicate that LCVA is a more sensitive measure of visual impairment in patients with reduced RNFL thickness than HCVA. Among patients with a GCL thickness <76 μm (a value lower than that seen in any control), 50% had an abnormal result on HCVA, while 100% had an abnormal result on LCVA, again suggesting a stronger relationship between GCL thickness and visual function as measured by LCVA.
As was observed for HCVA and LCVA, VF MD scores decreased linearly with lower RNFL thickness (β = 0.13, p = 0.0011). When ON status (yes vs no) was added to the model, it was not statistically significant (p = 0.81), suggesting that RNFL thickness accounted for the effects of ON on VF MD. Findings were similar for the association of mean VFMD and decreased GCL thickness (β = 0.091, p = 0.086) but did not reach statistical significance.
Color vision function declined linearly with loss of RNFL (β = −0.050; p = 0.0003) and lower GCL thickness values corresponded to decreased color vision scores (β = −0.11, p < 0.0001).
DISCUSSION
In this cross-sectional evaluation, we observed lower values for RNFL and GCL thickness in children and adolescents with CNS demyelination relative to healthy controls. We found evidence of altered axonal and neuronal integrity in the afferent visual pathway of patients. Importantly, lower OCT measures were not isolated to children with a history of ON; they were seen in both ON and non-ON eyes.
Our findings suggest that damage to retinal architecture is present in some children and adolescents with demyelination of the CNS, even in the absence of clinically overt ON, and that this damage may be detected using OCT. This has been previously demonstrated in adults with MS.5,12
There was a decrement of approximately 9 µm (9%) in RNFL thickness with each additional clinical episode of ON. Thinning in RNFL and GCL after ON have been well-established in the postacute phase of ON,13,14 possibly from retrograde axonal degeneration and subsequent ganglion cell injury. We demonstrate that retinal thinning, as manifested by a decrease in GCL thickness, occurs even in patients without overt ON, suggesting that perhaps the retina may also be the site of primary neuronal injury.
A primary insult to the retinal fibers is modeled by studies of experimental allergic encephalomyelitis (EAE), an analogue of inflammatory demyelination that closely resembles acute disseminated encephalomyelitis. One study found significantly decreased numbers of retinal ganglion cells (RGC) after EAE immunization in EAE mice in comparison to controls (average 18% decrease). This was linked to increased apoptosis of RGC and increased markers suggesting gliosis. Furthermore, EAE retinas showed increased macrophage activation in comparison to controls, suggesting the presence of an active inflammatory process in the retina.15 Whether our findings reflect the effects of primary neuronal injury, secondary neuronal damage from retrograde axonal degeneration, or, alternatively, retrograde transsynaptic axonal degeneration should be the subject of future investigations.
One striking finding in our patient group was that RNFL thickness decreases with ON episodes; GCL findings, on the other hand, were apparent at the time of the first event, and did not show progressive deterioration. It is unclear why stepwise decline was not seen in the GCL. This stands in contrast to findings from adult patients with MS, in which progressive deterioration of the GCL is seen, with accelerated thinning in patients with active disease.16 The reasons for these differences are unclear, but should be explored in future studies. It is possible that one event in the pediatric population may be so profoundly detrimental to neuronal integrity in the afferent visual pathway that further episodes have a limited capacity to injure the limited residual tissue. Alternatively, there may be limitations of the OCT software, such that detection of new increments of change in GCL thickness may be difficult in the setting of previous thinning.
Low RNFL and GCL thickness values and deficits in HCVA, LCVA, color vision, and VFs were seen and correlated with one another. Decreased function may have implications for school performance and social functioning. Previous studies have shown a correlation between quality of life and decrease in RNFL and GCL thickness in the adult population7,17; it remains to be seen whether this important outcome is affected in the pediatric population.
Results from this study should be interpreted with caution given the small numbers, cross-sectional design, and heterogeneity of the patient population. Our analysis of the impact of multiple episodes of ON rested on historical evidence of prior attacks. Prospective longitudinal information was not available to corroborate the finding of linear decline with increasing numbers of episodes of ON. In addition, given the small numbers, we were unable to evaluate the differential impact of a chronic, degenerative process (MS) compared to a self-limited single episode of inflammatory demyelination. Finally, although the full ophthalmologic battery was attempted in all patients, complete information, particularly the functional visual data, was not available for all patients, likely due to the time-consuming nature of the testing, and poorer cooperation with the testing by younger patients.
Our findings indicate the need for further longitudinal studies of structural and functional abnormalities in the visual pathway in pediatric demyelinating disorders. Further, the differential effect of a first episode of demyelination on the anterior visual pathway in MS vs monophasic demyelinating disorders remains to be evaluated in larger, longitudinal studies. At present, the clinical utility of OCT to improve clinical care in children with demyelinating disorders is unknown. Further detailed analyses of whether RNFL/GCL thickness can serve as surrogate markers for disease progression in this population, and in turn, can inform therapeutic decision-making, are needed. Finally, future studies are needed to measure the relationship of these structural and functional visual metrics on quality of life, school performance, and educational attainment in these children.
Supplementary Material
GLOSSARY
- ADEM
acute disseminated encephalomyelitis
- EAE
experimental allergic encephalomyelitis
- GCL
ganglion cell layer
- HCVA
high-contrast visual acuity
- IPL
inner plexiform layer
- IQR
interquartile range
- LCVA
low-contrast visual acuity
- MD
mean deviation
- MS
multiple sclerosis
- OCT
optical coherence tomography
- ON
optic neuritis
- RGC
retinal ganglion cells
- RNFL
retinal nerve fiber layer
- VEP
visual evoked potentials
- VF
visual field
Footnotes
Editorial, page 2108
Supplemental data at Neurology.org
AUTHOR CONTRIBUTIONS
E.A. Yeh: drafting and revision of manuscript, analysis and interpretation, data acquisition, study concept/design. R.A. Marrie: statistical analysis and interpretation, critical revision of manuscript for important intellectual content. Y.A. Reginald: patient recruitment, critical revision of manuscript for important intellectual content. J.R. Buncic: patient recruitment, review and revision of manuscript for important intellectual content. A. Noguera, J. O'Mahony: data acquisition, review and revision of manuscript. J.K. Mah: patient recruitment, data acquisition, critical revision of manuscript for important intellectual content. B. Banwell: patient recruitment, study concept, critical revision of manuscript for important intellectual content. F. Costello: patient recruitment, data acquisition, study design/concept, critical revision of manuscript for important intellectual content.
STUDY FUNDING
Supported by the Multiple Sclerosis Scientific Research Foundation and a Don Paty Career Development Award from the MS Society of Canada (to R.A.M.).
DISCLOSURE
E. Yeh receives funding from the National MS Society, the Canadian Institutes of Health Research, the Dairy Farmers of Ontario, the Canadian Multiple Sclerosis Scientific Research Foundation, the SIckKids Innovation Fund, and the MS Society of Canada. R. Marrie receives research funding from Canadian Institutes of Health Research, Public Health Agency of Canada, Manitoba Health Research Council, Health Sciences Centre Foundation, Multiple Sclerosis Society of Canada, Multiple Sclerosis Scientific Foundation, Rx & D Health Research Foundation, Consortium of MS Centers, and has conducted clinical trials funded by Sanofi-Aventis. Y. Reginald, J. Buncic, A. Noguera, J. O'Mahony, and J. Mah report no disclosures relevant to the manuscript. B. Banwell receives funding from the Canadian Multiple Sclerosis Scientific Research Foundation, the Canadian Institutes of Health Research, and the Dairy Farmers of Ontario. Dr. Banwell serves as a consultant on the design of pediatric MS trials for Biogen-Idec, Novartis, and Sanofi. Dr. Banwell is an Editor-in-Chief for Multiple Sclerosis and Related Disorders. F. Costello has received research funding from the MS Society of Canada, speaker fees from EMD Serono, and consultancy board honoraria from Novartis. Go to Neurology.org for full disclosures.
REFERENCES
- 1.Banwell B, Kennedy J, Sadovnick D, et al. Incidence of acquired demyelination of the CNS in Canadian children. Neurology 2009;72:232–239. [DOI] [PubMed] [Google Scholar]
- 2.Pohl D, Rostasy K, Treiber-Held S, Brockmann K, Gartner J, Hanefeld F. Pediatric multiple sclerosis: detection of clinically silent lesions by multimodal evoked potentials. J Pediatr 2006;149:125–127. [DOI] [PubMed] [Google Scholar]
- 3.Yeh EA, Weinstock-Guttman B, Lincoff N, et al. Retinal nerve fiber thickness in inflammatory demyelinating diseases of childhood onset. Mult Scler 2009;15:802–810. [DOI] [PubMed] [Google Scholar]
- 4.Frohman E, Costello F, Zivadinov R, et al. Optical coherence tomography in multiple sclerosis. Lancet Neurol 2006;5:853–863. [DOI] [PubMed] [Google Scholar]
- 5.Fisher JB, Jacobs DA, Markowitz CE, et al. Relation of visual function to retinal nerve fiber layer thickness in multiple sclerosis. Ophthalmology 2006;113:324–332. [DOI] [PubMed] [Google Scholar]
- 6.Saidha S, Syc SB, Durbin MK, et al. Visual dysfunction in multiple sclerosis correlates better with optical coherence tomography derived estimates of macular ganglion cell layer thickness than peripapillary retinal nerve fiber layer thickness. Mult Scler 2011;17:1449–1463. [DOI] [PubMed] [Google Scholar]
- 7.Walter SD, Ishikawa H, Galetta KM, et al. Ganglion cell loss in relation to visual disability in multiple sclerosis. Ophthalmology 2012;119:1250–1257. [DOI] [PMC free article] [PubMed] [Google Scholar]
- 8.Krupp LB, Banwell B, Tenembaum S. Consensus definitions proposed for pediatric multiple sclerosis and related disorders. Neurology 2007;68:S7–S12. [DOI] [PubMed] [Google Scholar]
- 9.Krupp LB, Tardieu M, Amato MP, et al. International Pediatric Multiple Sclerosis Study Group criteria for pediatric multiple sclerosis and immune-mediated central nervous system demyelinating disorders: revisions to the 2007 definitions. Mult Scler 2013;19:1261–1267. [DOI] [PubMed] [Google Scholar]
- 10.Holmes JM, Beck RW, Repka MX, et al. The amblyopia treatment study visual acuity testing protocol. Arch Ophthalmol 2001;119:1345–1353. [DOI] [PubMed] [Google Scholar]
- 11.Mwanza JC, Oakley JD, Budenz DL, Chang RT, Knight OJ, Feuer WJ. Macular ganglion cell-inner plexiform layer: automated detection and thickness reproducibility with spectral domain-optical coherence tomography in glaucoma. Invest Ophthalmol Vis Sci 2011;52:8323–8329. [DOI] [PMC free article] [PubMed] [Google Scholar]
- 12.Petzold A, de Boer JF, Schippling S, et al. Optical coherence tomography in multiple sclerosis: a systematic review and meta-analysis. Lancet Neurol 2010;9:921–932. [DOI] [PubMed] [Google Scholar]
- 13.Costello F, Hodge W, Pan YI, Eggenberger E, Coupland S, Kardon RH. Tracking retinal nerve fiber layer loss after optic neuritis: a prospective study using optical coherence tomography. Mult Scler 2008;14:893–905. [DOI] [PubMed] [Google Scholar]
- 14.Syc SB, Saidha S, Newsome SD, et al. Optical coherence tomography segmentation reveals ganglion cell layer pathology after optic neuritis. Brain 2012;135:521–533. [DOI] [PMC free article] [PubMed] [Google Scholar]
- 15.Horstmann L, Schmid H, Heinen AP, Kurschus FC, Dick HB, Joachim SC. Inflammatory demyelination induces glia alterations and ganglion cell loss in the retina of an experimental autoimmune encephalomyelitis model. J Neuroinflamm 2013;10:120. [DOI] [PMC free article] [PubMed] [Google Scholar]
- 16.Ratchford JN, Saidha S, Sotirchos ES, et al. Active MS is associated with accelerated retinal ganglion cell/inner plexiform layer thinning. Neurology 2013;80:47–54. [DOI] [PMC free article] [PubMed] [Google Scholar]
- 17.Sakai RE, Feller DJ, Galetta KM, Galetta SL, Balcer LJ. Vision in multiple sclerosis: the story, structure-function correlations, and models for neuroprotection. J Neuroophthalmol 2011;31:362–373. [DOI] [PMC free article] [PubMed] [Google Scholar]
Associated Data
This section collects any data citations, data availability statements, or supplementary materials included in this article.