Abstract
Purpose
The purpose of this one-year prospective study was to investigate how induction/pro re nata (PRN) ranibizumab intravitreal treatment of eyes with neovascular age related macular degeneration affects the anatomy of choroidal neovascularization (CNV) and the overlying outer retinal tissue.
Methods
High speed indocyanine green angiography (HS-ICG) measurements provided quantification of the CNV size in 60 patients followed for one year. Minimum intensity projection optical coherence tomography (minIP OCT), a novel algorithm assessing minimum optical intensity between the internal limiting membrane and retinal pigment epithelium, measured the area of outer retinal disruption overlying the CNV. Fluorescein angiography (FA) was also assessed to evaluate late retinal leakage.
Results
After one year, mean area of CNV measured with ICG decreased by 5.8%. MinIP OCT mean area of outer retinal disruption overlying the CNV decreased by 4.2%. Mean area of FA leakage decreased by 6.3%. Both the area of outer retinal disruption measured with minIP OCT and the area of leakage on FA typically exceeded the area of CNV on ICG at baseline and one year.
Conclusion
CNV treated with induction/PRN intravitreal ranibizumab for one year essentially remained static. MinIP OCT suggests that the area of outer retinal disruption overlying the CNV may be greater than the CNV itself and often correlates with the leakage area on fluorescein angiography. Additionally, there was minimal change in the area of outer retinal disruption on MinIP OCT even when fluid resolved. Measurements of the extent of CNV lesions based on ICG and minIP OCT may provide useful outcome variables to help assess the CNV complex longitudinally and warrant further validation.
Keywords: age related macular degeneration, choroidal neovascularization, fluorescein angiography, indocyanine green angiography, macula, optical coherence tomography, ranibizumab, retina
Introduction
Studies of neovascular age related macular degeneration (AMD) typically rely on outcomes focusing on exudation, such as fluorescein angiography (FA) and usual optical coherence tomography (OCT) algorithms. While maintaining a fluid free macula is essential for preservation of vision, the cost and risk of repeated intravitreal injections for recurrent exudation from choroidal neovascularization (CNV) is significant. Therefore, an ideal pharmacological treatment would involute the pathological vascular complex without causing the collateral tissue damage seen in prior treatments such as photodynamic therapy and laser photocoagulation. Assessing the size of the CNV complex and overlying outer retinal tissue involvement could provide useful outcome variables in patients with neovascular AMD. While only pathology can truly assess choroidal neovascular membrane morphology, indocyanine green angiography (ICG) images the choroid and permits a surrogate assessment.
In the past decade, anti-vascular endothelial growth factor (anti-VEGF) intravitreal injections for neovascular AMD have become standard care. The MARINA1 and ANCHOR2 clinical trials showed that intravitreal injections of ranibizumab (Lucentis; Genentech, Inc, South San Francisco,CA) successfully reduce exudation and thereby help preserve visual acuity. However, the effects of ranibizumab on the anatomical structure of the neovascular complex in AMD are not known. High-speed indocyanine green (HS-ICG) angiography and minimum intensity projection (MinIP) of spectral domain OCT are two additional means of characterizing a choroidal neovascular complex and overlying outer retinal changes in AMD.
ICG has the unique spectral characteristics of absorbing light at 790 nm and fluorescing at 805 nm. The resulting limited absorption by structures overlying the choroid such as retinal pigment epithelium and blood allows ICG angiography to identify choroidal structures not seen with FA.3 The HS-ICG image acquisition rate of 6.1 to 30 images per second enables visualization of choroidal blood flow and allows for analysis of early choroidal filling.4 Furthermore, the spatial resolution of HS-ICG allows for identification of vessels ≤ 50μm in diameter.4 Established reproducible reading protocols exist for FA and static ICG, but no such schema exists for HS-ICG.
MinIP OCT is a novel algorithm that identifies and displays the minimum optical intensity found between the internal limiting membrane and retinal pigment epithelium.5-7 The software was initially developed to provide an en face fundus image where fluid presented as dark regions. Bright areas were also noted and correspond to a change in the location of the minimum intensity spectral domain OCT signal within the retina. In a healthy retina, the minimum intensity signal is found in the outer nuclear layer (Figure 1), whereas retina overlying CNV typically has modified minimum intensity signal in the inner and outer nuclear layer (Figure 2). The enhanced bright signal is thought to correspond to damage to the outer retinal tissue overlying the CNV.7
Figure 1.
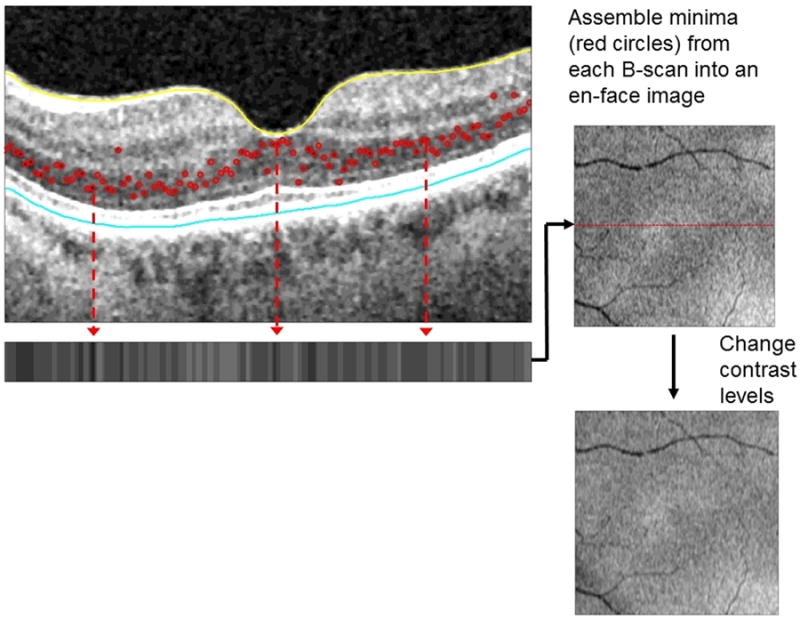
In this MinIP OCT image of a healthy macula of a 77 year old woman, the minimum intensity signal along each B scan is detected (red circles) which are then represented on the horizontal strip below and used to generate an en face image. Note the lack of both black regions and bright white signal in this en face view of a normal macula.
Figure 2.
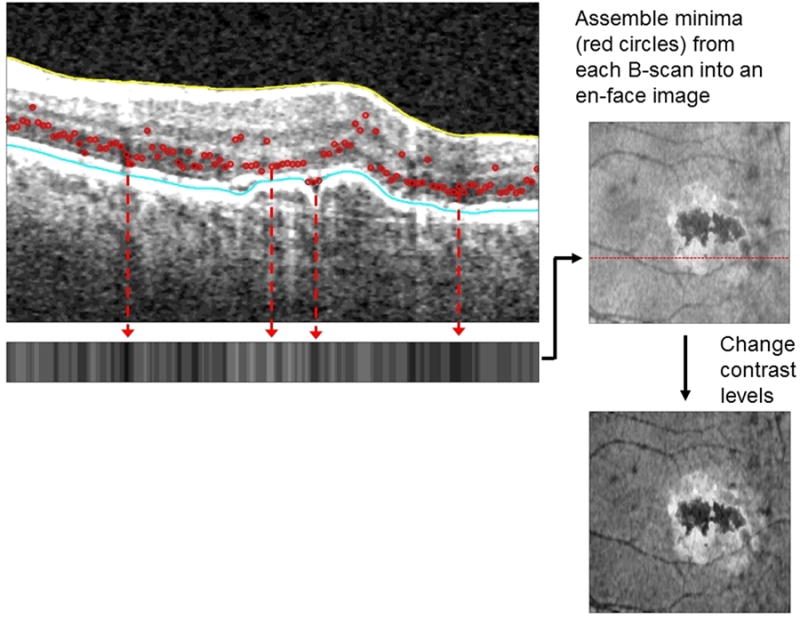
In this macula with active exudation due to neovascular AMD, the minimum intensity signals are altered. The en face image generated has black regions corresponding to fluid and an adjacent bright white signal reflecting outer retinal tissue alterations.
The purpose of this one-year prospective study of induction/pro re nata (PRN) 0.5 mg intravitreal ranibizumab-based treatment of eyes with neovascular AMD was to characterize the anatomical changes in choroidal neovascular membranes and the immediate overlying retina. A method for measurement of the extent of CNV with HS-ICG was devised, and a measurement system was similarly devised for MinIP imaging. A comparison of the MinIP OCT, FA, and HS-ICG findings is reported herein.
Methods
This prospective, observational study of patients receiving standard care induction/PRN intravitreal ranibizumab injections for neovascular age-related macular degeneration was conducted at the National Eye Institute (NEI) in Bethesda, Maryland. The study was approved by the National Institutes of Health (NIH) Institutional Review Board and adhered to the tenets of the Declaration of Helsinki. Each participant gave written consent to participate in the study. The study is listed on www.clinicaltrials.gov (NCT00656903).
The primary objective of this study was to assess the effect of induction/PRN ranibizumab treatment on the size of the choroidal neovascular membrane as seen on HS-ICG. Secondary objectives included the development of a grading and measurement system for HS-ICG images, measurement of changes in lesion size and leakage on FA, and measurement of outer retinal tissue alteration on MinIP OCT imaging.
Study Participants
Between March 2009 and August 2012, seventy-five patients with neovascular AMD were enrolled at a single site (NEI). Inclusion criteria included: 50 years of age or older, diagnosis of AMD defined by the presence of drusen at least 63 microns in size, CNV with associated exudation secondary to AMD, and visual acuity of better than 20/400 in the affected eye. Exclusion criteria included: presence of other ocular diseases that cause CNV such as pathologic myopia, ocular histoplasmosis, or posterior uveitis; geographic atrophy or fibrosis under the fovea that might prevent visual improvement; decreased vision due to any eye disease other than neovascular AMD; history of treatment for CNV in the study eye with focal laser photocoagulation, verteporfin/photodynamic therapy, transpupillary thermotherapy, external beam radiation therapy, and/or submacular surgery; previous anti-VEGF treatments in the study eye less than four weeks prior to enrollment; prior vitrectomy or scleral buckle in the study eye; medical problems likely to prevent consistent follow-up over the treatment period (e.g. severe stroke, severe MI, end stage malignancy); contraindications to necessary diagnostic studies (i.e., known allergy to indocyanine green or fluorescein dyes, etc.); clinical signs of myopic retinopathy, or a spherical equivalent refraction greater than −8.00D in their current prescription. If both eyes met study inclusion criteria, the study eye was chosen at the investigator's discretion.
Study Intervention
Each enrolled participant received four intravitreal injections of 0.5 mg ranibizumab in the study eye (baseline, months 1, 2 and 3). After these initial injections, each participant was evaluated every month beginning at month-4 for re-treatment. Best corrected visual acuity was evaluated with ETDRS testing.
Following the initial four injections, participants were injected in the study eye monthly until a fluid-free macula was achieved as determined by OCT. If a fluid-free state was achieved, the participant was still followed for the study duration. A fluid-free macula was defined as: (a) complete resolution of subretinal fluid, and (b) complete resolution of intraretinal fluid. This definition allowed the persistence of a retinal pigment epithelial detachment if the above criteria were met. If fluid or hemorrhage recurred on subsequent visits, the participant received intravitreal ranibizumab again following the PRN protocol. We did not repeat the multiple injection induction protocol used at baseline. All participants regardless of fluid status were evaluated monthly for prn injections.
Participants with bilateral neovascular AMD had an identified “study eye” treated according to study protocol; the fellow eye received intravitreal ranibizumab at the investigator's discretion. Other drugs for neovascular AMD, including bevacizumab, aflibercept and pegaptanib sodium, were not administered in either eye during the study period.
Image Acquisition and Measurements
HS-ICG (Heidelberg Engineering, Heidelberg, Germany), FA (Topcon Medical Systems, Inc., New Jersey, United States) and MinIP OCT imaging were obtained for all patients at baseline and year-1. Patients were examined with Cirrus (Carl Zeiss Meditec, Jena, Germany) OCT monthly to document response to treatment and to assess the need for injection. MinIP en face images of the retina were generated from Cirrus OCT macular cube data using proprietary software, and the resulting 20 degree images of the retina were analyzed. ICG images were captured with the following parameters. After injection of 8.3 mg/1mL of ICG dye, the study eye was imaged with a 30 degree angle of view on the Heidelberg HRA2 to obtain a movie of the early frames showing filling of the CNV. FA images were obtained with Topcon TRC-50EX after injection of fluorescein sodium 10% (500mg/5mL) with a 50 degree angle of view.
To facilitate tracing the borders of the CNV, the NIH-developed software ImageJ, was used to create an image stack. Frames with eye blinks were removed and the remaining frames from the first minute after choroidal filling were aligned to create a composite static image. This 30 degree static composite image was then used for CNV lesion measurement. A representative 50 degree late FA image (10 minutes post-infusion) was also selected for analysis of maximal leakage extent.
Two trained graders traced all lesions on the ICG (DN, BT), FA (DN, NJ), and MinIP images (DN, NJ). The location of the choroidal neovascular membrane on the ICG image was identified collaboratively by three graders, and then each grader independently outlined the full extent of the choroidal neovascular membrane using the freehand drawing tool in ImageJ. The goal was to trace the borders of the CNV tightly. If multiple foci of CNV existed, the lesions were traced separately and the areas were added together. Since it was difficult to outline a feeder vessel tightly, only the “fleurette” component of the CNV complex was traced. The area occupied by the membrane in pixels was then calculated by ImageJ and the measurements by the two graders were averaged. In the event of a >20% disagreement between the two graders in the area measurement (our group thought that less than 20% differences were difficult to detect qualitatively, so we set 20% as the benchmark for this study based on our personal experience), a third grader (CM) measured the membrane and the three values were averaged for further analysis. The area of maximal late hyperfluoresence on FA was measured similarly in ImageJ, while the abnormally bright and dark areas corresponding to the outer retinal tissue alterations overlying the CNV were measured on the MinIP OCT images.
Data Analysis
Baseline and one year lesion size in pixels, visual acuity, central retinal thickness (CRT), and outer segment length were compared using a signed rank test. Pixels were converted into micron measurements for all area measurements. Pixel count was correlated with total degrees in an image based on an area of 36mm2 for a 20 degree minIP OCT image, 81mm2 for a 30 degree HRA image and 177 mm2 for a 50 degree Topcon image. The conversion formulas were as follows:
Neovascular membranes were clinically characterized as small, medium, or large by ICG measurements: small membranes were 0 to 2.50 mm2, medium membranes were 2.6 to 5.0mm2, and large membranes were 5.1 to 7.5 mm2. The relationships between baseline CNV size and change in CRT, change in outer segment length and visual acuity were assessed with a Kruskal-Wallis test. All data analysis was performed using the SAS software (SAS Institute, Cary, NC).
Agreement between graders was assessed using the limits of agreement method.8,9 Change in lesion size from baseline to one year was assessed for agreement analysis.
Results
Sixty of the 75 participants had completed all testing at one year of follow-up. The other 15 participants were not included in the analysis for the following reasons. One participant died prior to the one year visit. Another withdrew from the study at month 3 because he disliked undergoing angiography. One developed ICG allergy and two developed FA allergy prior to one year of follow-up. Two moved out of state and therefore did not complete the one year visit. Two were out of the country for an extended period of time and missed their annual visit. Six had massive PEDs or thick macular hemorrhage that prevented accurate measurements of the entire CNV complex.
The mean age at enrollment was 79.2 years (range 57-95). The majority of participants were chronic cases with a history of anti-VEGF treatment prior to enrollment (48/60). Twelve were newly diagnosed with neovascular AMD. The duration of neovascular AMD prior to study enrollment varied (mean 1.9 years, range 0-10 years). Over the one year treatment period, participants underwent a mean 9.2 injections (range 4-16). No study drug-related adverse events occurred, and there were no cases of endophthalmitis.
The mean baseline visual acuity was 62.5 ETDRS letters (13 to 85, SD 16.2, ∼20/64). The large membrane group, consisting of 7 participants, had a mean baseline visual acuity of 59.7 letters; the medium sized group, consisting of 13 participants, had a mean baseline acuity of 55.6 letters; and the small membrane group, consisting of 40 participants, had a mean baseline acuity of 65.1 letters. The mean final acuity was 65.9 letters (2 to 89, SD 17.2, ∼20/55) with the large membrane group losing a mean of 10.4 letters (median loss of 4.0 letters), the medium membrane group gaining a mean of 1.7 letters (median visual change of 0 letters) and the small membrane group gaining a mean of 5.9 letters (median gain of 3.5 letters). The mean baseline CRT was 324.1 microns (95% CI: 280.8 to 367.3), and the mean final CRT was 249.6 microns (95% CI: 236.9 to 262.3). Of the forty CNV membranes classified as small at baseline, two converted to medium size at one year. Among the 13 baseline medium-sized CNV, two were classified as small at one year, and one as large at one year. All large membranes remained large. There were 2 retinal angiomatous proliferation lesions, 8 classic membranes, 21 minimally classic membranes, and 29 occult membranes. There were no changes in lesion type from baseline to one year.
Mean baseline CNV area on ICG was 2.7 mm2. At one year, mean percent change in lesion area was -5.8% (95% CI -13.9 to 2.3%). CNV size at baseline was not associated with change in CRT or outer segment length. Mean baseline lesion area on MinIP OCT was 5.9 mm2, and mean percent change lesion size at one year was -4.2% (95% CI -13.4 to 4.9%). Mean baseline late leakage area on FA was 11.6 mm2 and mean percent change in late leakage area at one year was -6.3% (95% CI -23.2 to 10.5%).
In 24/60 (40%) instances a third ICG grader was required because of a greater than 20% difference between graders. ICG agreement was further assessed by limits of agreement analysis of the percent change in CNV area between baseline and year 1 (Figure 3). When percent change from baseline to year one was compared between Grader 1 and Grader 2, there was a mean -5.99% (95% limits of agreement -89.7 to 77.8%) difference between graders. For minIP OCT, a third grader was required in 13/60 (21.7%) instances because of a greater than 20% difference between graders. MinIP agreement was further assessed by limits of agreement analysis of the percent change in lesion area between baseline and year 1 (Figure 4). When percent change from baseline to year 1 was compared between Grader 1 and Grader 2, there was a mean difference of 2.5% (95% limits of agreement -31.2 to 36.1%) difference between graders.
Figure 3.
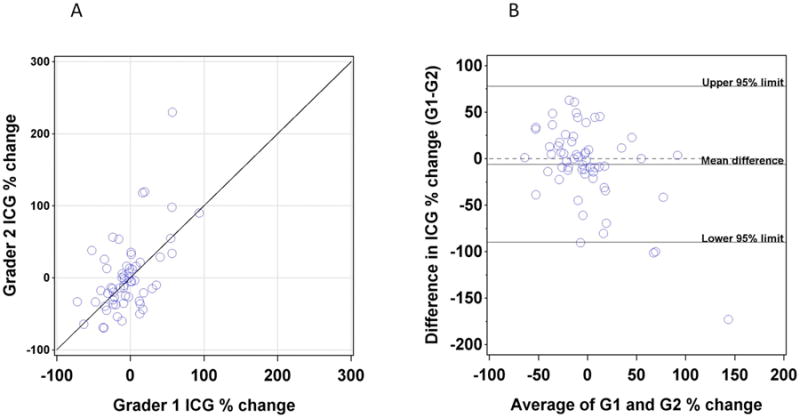
(A) Plot of the percentage change in lesion area on ICG between baseline and one year as assessed by Grader 1 (X axis) versus percentage change as assessed by Grader 2 (Y axis). (B) Plot of difference between graders (Y axis) versus average of two graders (X axis).
Figure 4.
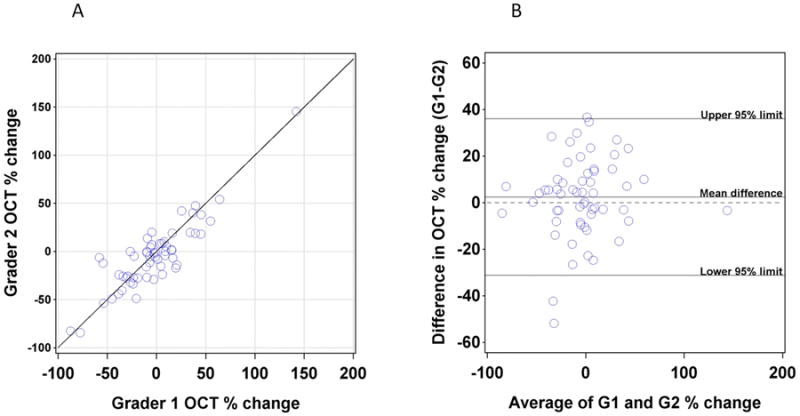
(A) Plot of the percentage change in lesion area on MinIP OCT between baseline and one year as assessed by Grader 1 (X axis) versus percentage change as assessed by Grader 2 (Y axis). (B) Plot of difference between graders (Y axis) versus average of two graders (X axis).
FA lesion area agreement was assessed by limits of agreement analysis of the percent change in lesion area between baseline and year 1 (Figure 5). 19/60 cases required a third grader because of FA exudation measurements that exceeded a 20% difference between graders. When percent change from baseline to year 1 was compared between Grader 1 and Grader 2, there was a mean 2.5% (95% limits of agreement -51.2 to 56.1%) difference between graders.
Figure 5.
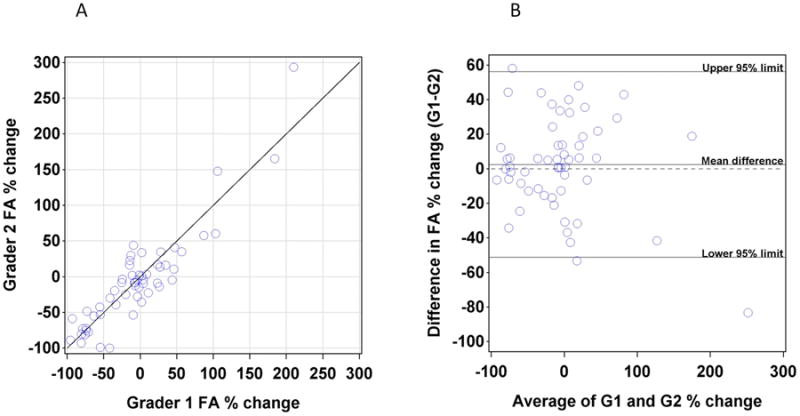
(A) Plot of the percentage change in lesion area on FA between baseline and one year as assessed by Grader 1 (X axis) versus percentage change as assessed by Grader 2 (Y axis). (B) Plot of difference between graders (Y axis) versus average of two graders (X axis).
At baseline and at one year, both MinIP lesion area and FA leakage area typically exceeded the ICG CNV area (Figures 6 and 7). The most common pattern was FA>minIP OCT>ICG (65% of cases at baseline, 55% of cases at one year) followed by MinIP OCT>FA>ICG (25% of cases at both baseline and one year). Less common patterns were ICG>minIP OCT>FA (2 cases at baseline and zero cases at one year), ICG>FA>minIPOCT (1 case at baseline and zero cases at one year), FA>ICG>MinIP OCT (2 cases at baseline and 6 at one year), minIP OCT>ICG>FA (1 case at baseline at baseline and 6 at one year). When only the central 30 degrees of the FA images were analyzed, these ratios did not change.
Figure 6.
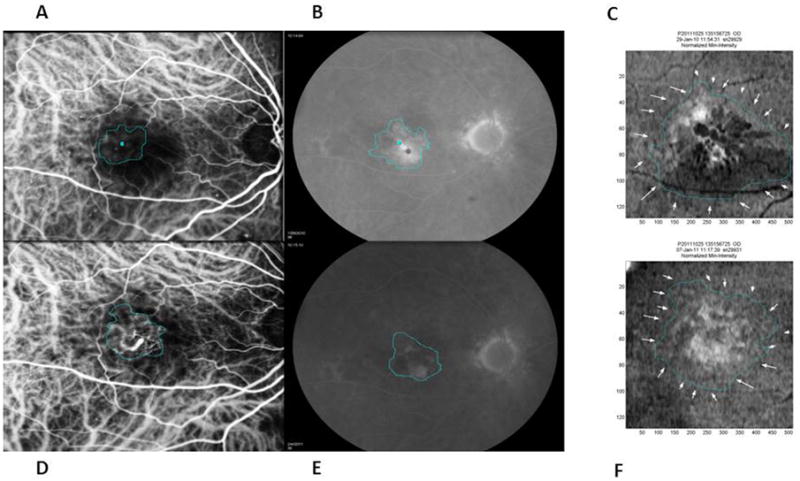
An example of an eye in which the FA leakage area (B-baseline and E-one year) was largest in dimension followed by the MinIP OCT lesion area (C-baseline and F-one year) and then the CNV area on ICG (A-baseline and D-one year) throughout the study period. After four induction ranibizumab injections, the macula became fluid-free with central retinal thickness decreasing from a baseline of 452 to 206 microns at one year. Despite a slight increase in CNV size of 4.6% on ICG at one year, the MinIP OCT lesion decreased by 5.5% at one year which was consistent with the patient's improving clinical course.
Figure 7.
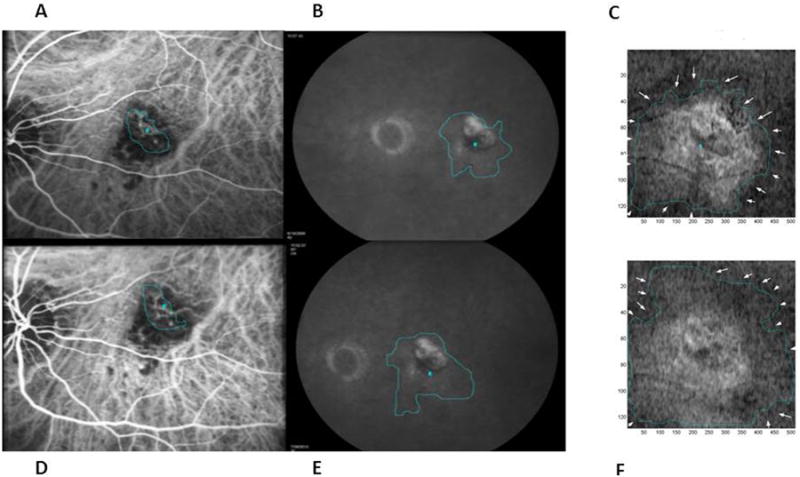
An example of an eye in which the MinIP OCT lesion area (C-baseline and F-one year) was greatest at baseline followed by FA leakage area (B baseline and E one year) and then CNV area on ICG (A-baseline and D-one year) throughout the study period. This patient had persistent fluid requiring 10 injections during the one year. CNV area on ICG increased slightly by 2.1%. Note that the decreased black regions on MinIP OCT show some improvement in fluid status. However, the MinIP OCT lesion area enlarged by 16.6% at one year and had increased abnormal bright signal suggestive of a “penumbra” of retinal changes surrounding the CNV area.
Discussion
This multimodal imaging study aimed to evaluate quantitative ICG measurements delineating the area of the CNV itself, FA measurements including the area of maximal leakage from the CNV, and MinIP OCT showing the retinal OCT changes overlying the CNV. Our results suggest that the size of CNV, as measured using HS-ICG angiography, does not appreciably change over one year following an induction/PRN 0.5 mg intravitreal ranibizumab-based treatment regimen for neovascular AMD. In our patient population, late fluorescein leakage area only decreased by 6.3% which may reflect both manual tracing error (a 20% change appeared clinically important on qualitative review based on our group's consensus) and the inclusion of patients with a long duration of CNV resulting in a more chronic course. MinIP OCT imaging, demonstrating fluid and/or disruption of the outer retina, revealed a larger area of retinal pathology surrounding CNV in most cases. In this study without a reading center, we found our lesion measurement to be more variable with HS-ICG images than with FA or MinIP OCT, and our limits of agreement analysis of inter-observer agreement confirms and quantifies this general observation.
This study confirms previously published non-quantitative ICG data10 that induction/PRN ranibizumab injections do not eradicate CNV. With our quantitative ICG analysis, only a small decrease in CNV size was seen at one year. While the landmark neovascular AMD studies did not use ICG as an outcome, their documentation of the need for repeated injections supports the lack of CNV involution with ranibizumab.11-14For example, the Comparison of Age-Related Macular Degeneration Treatment Trials (CATT) group reported only a modest decrease in PRN injections from year one to year two (mean 6.9 injections in the first year in the ranibizumab as-needed group, and 5.0 injections in the second year) and showed there was not a significant change in fluorescein lesion size11, 12 This lack of membrane contraction in response to repeated ranibizumab injections suggests that new treatment modalities will be required to eradicate CNV and potentially “cure” the neovascular process. However, our data was based on a more chronic patient population so these imaging and visual acuity results may have less generalizability to a treatment naïve population.
HS-ICG is an important modality for documenting CNV,15-19 but it has not previously been used systematically as a quantitative study outcome measure. Here we describe both a method for measuring the area of a CNV with HS-ICG images and an assessment of inter-observer agreement. While this method has yielded useful data, there are some challenges inherent to HS-ICG. The borders of a membrane are difficult to identify over a background of normal choroidal vessels, so determination of the precise extent of distal pathological vessels can be problematic particularly for membranes that are not well defined. Tight tracing of the undulating borders of CNV with a computer mouse can be difficult, so individual graders may have different levels of tracing tightness around lesion curves. In our imaging series, membranes that were less defined were more difficult to grade. Nebulous borders occurred in both classic and occult membranes in our data set, while RAP lesions tended to have less ambiguity. Increasing the number of graders in future studies would be useful to account for this variability. Figures 8 and 9 show examples of membranes with less than (Figure 8) and more than (Figure 9) 20% disagreement between graders. Our limits of agreement analysis of percent change in CNV size yielded 95% confidence limits of -89.7% to 77.8%, which are wider than the limits for both MinIP (-31.2 to 36.1%) and FA (-51.2% to 56.1%). The wider limits for ICG demonstrate that inter-observer agreement was worse than for MinIP OCT and FA. Additionally, the proportion of ICG images requiring a third grader was high and reflects the technical challenges of accurate and reproducible quantification of CNV on ICG.
Figure 8.
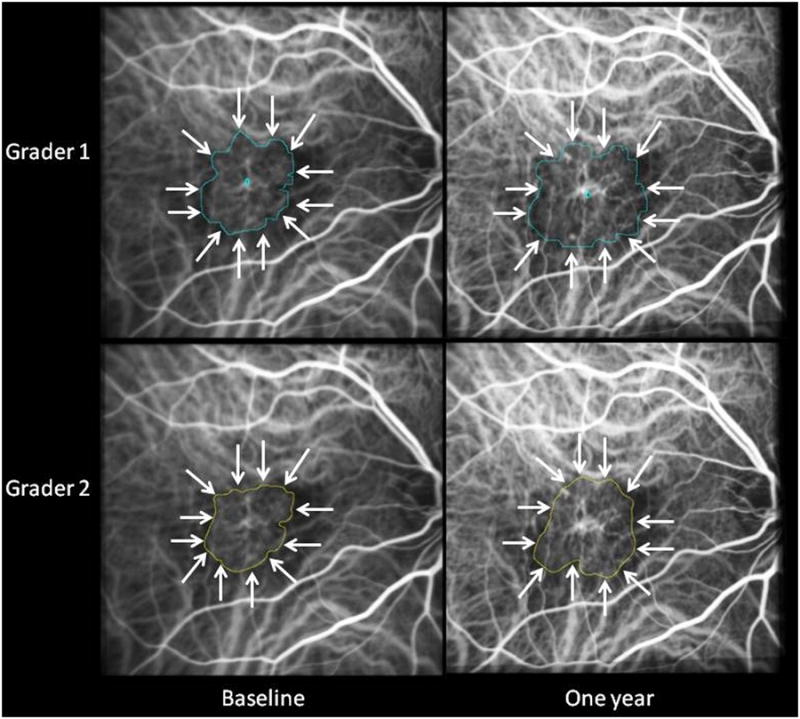
ICG composite images from a case in which the two graders differed by less than 20 at both baseline and one year in assessment of lesion area. Gradings that differed by less than 20% did not appear clinically significant on qualitative review.
Figure 9.
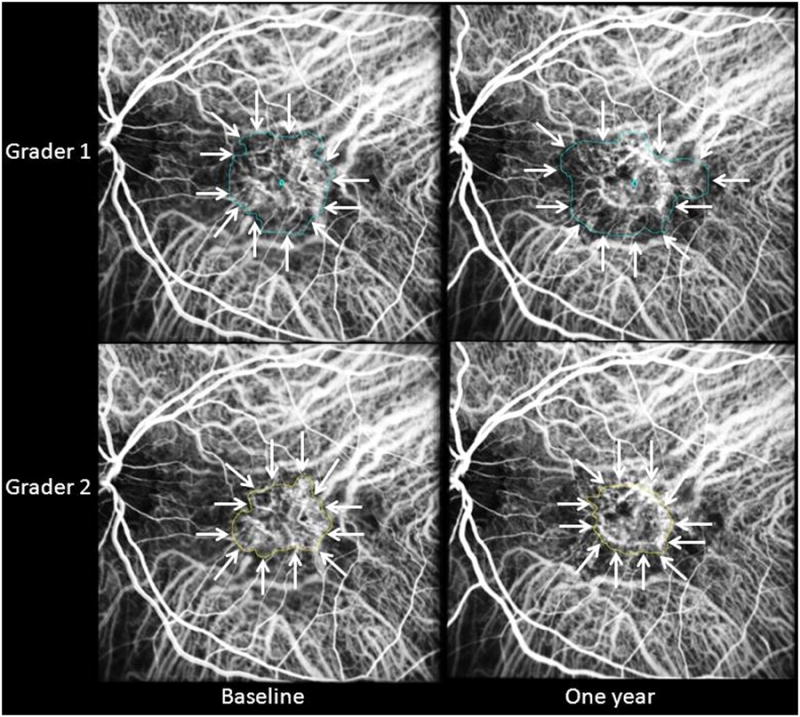
ICG composite images from a case in which the two graders differed by more than 20% at both baseline and one year in assessment of lesion area. Gradings that differed by more than 20% appeared clinically significant on qualitative review and therefore required a third grader in this study.
MinIP images are produced by novel, proprietary software that processes a large amount of OCT data to produce a single en face image.7 This single image encapsulates OCT pathology throughout the macula. MinIP detects the minimal intensity signal in each OCT A-scan between the internal limiting membrane and retinal pigment epithelium segmentations (Figure 2). Fluid has little or no reflectivity and is therefore the minimum intensity signal when present. On the en face image, fluid is black. In areas of normal retina, the minimum intensity signal comes from the outer nuclear layer. Areas of retinal pathology that lack fluid often have a bright signal on the en face image. This bright signal may come from areas in which the inner nuclear layer yields the minimum intensity signal because of an abnormal increase in outer nuclear layer reflectance.
The abnormal signal on MinIP OCT within a one-year study period underwent only a small decrease in area. While fluid can rapidly disappear with anti-VEGF treatment, the abnormal bright signal overlying the CNV tended to persist during our one year of follow-up. The MinIP lesion size typically exceeded the area of CNV on ICG. The ICG measurement includes the area of the CNV itself, the FA measurement includes the area of leakage from the CNV, and MinIP OCT shows the “penumbra” of retinal OCT changes surrounding the CNV (Figures 6 and 7).
MinIP OCT imaging has some limitations and may not be relevant in all patients. For example, the software assesses the minimum intensity between the internal limiting membrane and the retinal pigment epithelium. Since the minimum intensity is usually not located near the segmentations, this method is fairly robust to segmentation errors. However, if the software is not able to detect these landmarks or if these structures are absent, the MinIP image may not be interpretable in areas of segmentation artifact. In the context of AMD, areas of geographic atrophy will appear bright with MinIP OCT but should not be considered retinal disruption due to underlying CNV. The clinical relevance of bright areas on MinIP remains to be determined. Future correlation with microperimetry, fundus autofluorescence, or even adaptive optics findings will help clarify the clinical and anatomic significance of MinIP abnormalities.
Measurement of CNV on ICG angiograms may become an increasingly important analysis as new therapies for neovascular AMD emerge. While CNV size on ICG may not precisely correlate with histologic size, reproducible imaging methods to follow longitudinal changes in CNV are informative. Given the variability in our ICG CNV measurements, future appropriately powered studies assessing the reproducibility of quantifiable grading of CNV on ICG would be important to validate ICG as an outcome measure for neovascular AMD treatment trials. While this study compared CNV area on ICG with the resulting overlying leakage on late frame FAs, comparison of ICG with earlier fluorescein time frames would be worthwhile as the earlier changes on fluorescein might correlate better with the CNV area seen on ICG. Anti-platelet derived growth factor drugs20,21 and other treatments designed to eradicate CNV will continue to emerge, and ICG angiography could play an important part in assessment of their anatomic effect. As such, natural history data on choroidal neovascular membranes is vital for the understanding of current and future treatments for neovascular AMD.
Summary Statement.
Choroidal neovascularization, assessed quantitatively with high speed indocyanine green angiography, and the overlying outer retinal tissue alterations, measured with minimum intensity projection optical coherence tomography, remain essentially static during one year of treatment with induction/pro re nata intravitreal ranibizumab for neovascular age related macular degeneration.
Footnotes
Financial/Proprietary Disclosures: Paul Stetson, PhD is an employee of Carl Zeiss Meditec. The other authors have no proprietary interest in the technology utilized in this study.
References
- 1.Rosenfeld PJ, Brown DM, Heier JS, et al. Ranibizumab for neovascular age-related macular degeneration. N Engl J Med. 2006 Oct 5;355(14):1419–1431. doi: 10.1056/NEJMoa054481. [DOI] [PubMed] [Google Scholar]
- 2.Brown DM, Michels M, Kaiser PK, Heier JS, Sy JP, Ianchulev T. Ranibizumab versus verteporfin photodynamic therapy for neovascular age-related macular degeneration: Two-year results of the ANCHOR study. Ophthalmology. 2009 Jan;116(1):57–65 e55. doi: 10.1016/j.ophtha.2008.10.018. [DOI] [PubMed] [Google Scholar]
- 3.Guyer DR, Yanuzzi LA, Slakter J, Al E. Diagnostic indocyanine green angiography videoangiography. In: Ryan SJ, Schachat AP, editors. Retina. 3. St. Louis: Mosby; 2001. pp. 943–966. [Google Scholar]
- 4.Srivastava SK, Csaky KG. Identification of well-defined intrachoroidal neovascularization by high-speed indocyanine green angiography. Retina. 2003 Oct;23(5):712–714. doi: 10.1097/00006982-200310000-00019. [DOI] [PubMed] [Google Scholar]
- 5.Zayit-Soudry S, Dupas B, Stetson P, Durbin M, Bressler N. Changes Over Time of a New Non-Invasive Approach for Tracking Choroidal Neovascularization and Associated Fluid. Invest Ophthalmol Vis Sci. 2010;51 ARVO E-Abstract 2291. [Google Scholar]
- 6.Zayit-Soudry S, Dupas B, Stetson P, Durbin M, Bressler N. Retinal Abnormalities Overlying Occult Choroidal Neovascularization in Minimum Intensity Projection (MinIP) of SD-OCT. Invest Ophthalmol Vis Sci. 2011;52 ARVO E-Abstract 4799. [Google Scholar]
- 7.Dupas B, Stetson P, Durbin M, Zayit-Soudry S, Bressler N. Potential New NonInvasive Approach for Visualizing Choroidal Neovascularization. Invest Ophthalmol Vis Sci. 2010;51 ARVO E-Abstract 924. [Google Scholar]
- 8.Bland JM, Altman DG. Agreement between methods of measurement with multiple observations per individual. J Biopharm Stat. 2007;17(4):571–582. doi: 10.1080/10543400701329422. [DOI] [PubMed] [Google Scholar]
- 9.Bland JM, Altman DG. Statistical methods for assessing agreement between two methods of clinical measurement. Lancet. 1986 Feb 8;1(8476):307–310. [PubMed] [Google Scholar]
- 10.Querques G, Tran TH, Forte R, Querques L, Bandello F, Souied EH. Anatomic response of occult choroidal neovascularization to intravitreal ranibizumab: a study by indocyanine green angiography. Graefes Arch Clin Exp Ophthalmol. 2012 Apr;250(4):479–484. doi: 10.1007/s00417-011-1831-5. [DOI] [PubMed] [Google Scholar]
- 11.Martin DF, Maguire MG, Ying GS, Grunwald JE, Fine SL, Jaffe GJ. Ranibizumab and bevacizumab for neovascular age-related macular degeneration. N Engl J Med. 2011 May 19;364(20):1897–1908. doi: 10.1056/NEJMoa1102673. [DOI] [PMC free article] [PubMed] [Google Scholar]
- 12.Martin DF, Maguire MG, Fine SL, et al. Ranibizumab and bevacizumab for treatment of neovascular age-related macular degeneration: two-year results. Ophthalmology. 2012 Jul;119(7):1388–1398. doi: 10.1016/j.ophtha.2012.03.053. [DOI] [PMC free article] [PubMed] [Google Scholar]
- 13.Rosenfeld PJ, Brown DM, Heier JS, et al. Ranibizumab for neovascular age-related macular degeneration. N Engl J Med. 2006 Oct 5;355(14):1419–31. doi: 10.1056/NEJMoa054481. [DOI] [PubMed] [Google Scholar]
- 14.Brown DM, Michels M, Kaiser PK, et al. Ranibizumab versus verteporfin photodynamic therapy for neovascular age-related macular degeneration: Two-year results of the ANCHOR study. Ophthalmology. 2009 Jan;116(1):57–65.e5. doi: 10.1016/j.ophtha.2008.10.018. [DOI] [PubMed] [Google Scholar]
- 15.Sorenson JA, Yannuzzi LA, Slakter JS, Guyer DR, Ho AC, Orlock DA. A pilot study of digital indocyanine green videoangiography for recurrent occult choroidal neovascularization in age-related macular degeneration. Arch Ophthalmol. 1994 Apr;112(4):473–479. doi: 10.1001/archopht.1994.01090160049021. [DOI] [PubMed] [Google Scholar]
- 16.Yannuzzi LA, Slakter JS, Sorenson JA, Guyer DR, Orlock DA. Digital indocyanine green videoangiography and choroidal neovascularization. Retina. 1992;12(3):191–223. [PubMed] [Google Scholar]
- 17.Guyer DR, Puliafito CA, Mones JM, Friedman E, Chang W, Verdooner SR. Digital indocyanine-green angiography in chorioretinal disorders. Ophthalmology. 1992 Feb;99(2):287–291. doi: 10.1016/s0161-6420(92)31981-5. [DOI] [PubMed] [Google Scholar]
- 18.Destro M, Puliafito CA. Indocyanine green videoangiography of choroidal neovascularization. Ophthalmology. 1989 Jun;96(6):846–853. doi: 10.1016/s0161-6420(89)32826-0. [DOI] [PubMed] [Google Scholar]
- 19.Hayashi K, de Laey JJ. Indocyanine green angiography of choroidal neovascular membranes. Ophthalmologica. 1985;190(1):30–39. doi: 10.1159/000309489. [DOI] [PubMed] [Google Scholar]
- 20.Ni Z, Hui P. Emerging pharmacologic therapies for wet age-related macular degeneration. Ophthalmologica. 2009;223(6):401–410. doi: 10.1159/000228926. [DOI] [PubMed] [Google Scholar]
- 21.Jo N, Mailhos C, Ju M, et al. Inhibition of platelet-derived growth factor B signaling enhances the efficacy of anti-vascular endothelial growth factor therapy in multiple models of ocular neovascularization. Am J Pathol. 2006 Jun;168(6):2036–2053. doi: 10.2353/ajpath.2006.050588. [DOI] [PMC free article] [PubMed] [Google Scholar]


