

Summary
Chemotaxis, migration towards soluble chemical cues, is critical for processes such as wound healing and immune surveillance, and is exhibited by various cell types from rapidly-migrating leukocytes to slow-moving mesenchymal cells. To interrogate the mechanisms involved in mesenchymal chemotaxis, we observed cell migration in microfluidic chambers that generate stable gradients of the chemoattractant PDGF. Surprisingly, we found that pathways implicated in amoeboid chemotaxis, such as PI3K and mTOR signaling, are dispensable for chemotaxis to PDGF. Instead, we find that local inactivation of Myosin IIA, through a non-canonical Ser1/2 phosphorylation of the regulatory light chain, is essential. This site is phosphorylated by PKCα, which is activated by an intracellular gradient of diacylglycerol generated by PLCγ. Using a combination of TIRF imaging and gradients of activators/inhibitors in the microfluidic chambers, we demonstrate that this signaling pathway and subsequent inhibition of Myosin II activity at the leading edge is required for mesenchymal chemotaxis.
Introduction
Chemotaxis, or directed cell migration towards a soluble cue, is a critical process for many physiological events such as wound healing, immune responses and angiogenesis, and has been studied for nearly a century (Swaney et al., 2010). This process is not limited to metazoans or even eukaryotes, as free-living cells such as amoebae and bacteria must chemotax to find nutrients or more favorable environmental conditions (Sourjik and Wingreen, 2012). Despite the long history of chemotaxis studies, many important questions about how this process works and the diversity of chemotactic mechanisms remain unresolved.
Chemotactic ligands can stimulate a variety of signaling pathways involving G-protein coupled receptors (GPCRs), receptor tyrosine kinases (RTKs) and two-component histidine kinase pathways (Dormann and Weijer, 2006; Wadhams and Armitage, 2004). Of these, chemotaxis mediated by RTKs is the least well understood. PDGF, EGF, VEGF and CSF1 are among the chemoattractants that elicit RTK-based chemotaxis of different cell types, such as fibroblasts, epithelial and endothelial cells, and macrophages (Dormann and Weijer, 2006; Shamloo et al., 2008; Webb et al., 1996). Although RTKs and GPCRs activate homologous enzymes (e.g., PI3K class 1A vs. class 1B; PLCγ vs. PLCβ, respectively), it is unclear whether or not the same signaling events are universally required for directed migration.
PDGF/PDGF receptor signaling is critical for mesenchymal lineages during embryonic development and for tissue homeostasis and wound repair, and has been implicated in diseases ranging from fibrosis to cancer (Andrae et al., 2008). The mesenchymal cells affected by PDGF signaling adhere firmly to extracellular matrix and exhibit high contractility using bundled actin stress fibers, limiting migration speed. Conversely, amoeboid cells move rapidly (>10× faster than mesenchymal cells) without strong adhesion and with contractility confined to the rear uropod. These different mechanics of migration correspond to differing biological roles, with mesenchymal cells participating in slow, collective responses in connective tissue, whereas amoeboid cells such as leukocytes constitute a ‘rapid response force’. Both types of cells exhibit chemotaxis, but it remains an open question whether or not the underlying mechanisms at the level of cytoskeletal dynamics and force generation are similar (Bear and Haugh, 2014).
Measuring chemotaxis is a challenge, particularly for slow-moving cells. Older methods such as the Boyden or transmembrane migration chamber have been widely used (Boyden, 1962), but suffer from certain shortcomings. Perhaps most significant is that these measurements often do not distinguish between effects on the efficiency of migration (cell speed) versus directional bias, since treatments that affect either property might be interpreted as an effect on ‘chemotaxis’ (Zigmond and Hirsch, 1973). In addition, these chamber systems do not allow direct observation of the cells undergoing directed migration, so the molecular processes involved cannot be imaged. Several direct observation chemotaxis chambers have been developed (Zicha et al., 1991; Zigmond, 1977); however, issues such as limited gradient stability have restricted their application. More recently, microfluidic fabrication techniques have been used to make chambers in which gradients can be maintained for many hours (Li Jeon et al., 2002; Shamloo et al., 2008).
Using such a microfluidic chamber, we recently tested the ability of fibroblasts depleted of the Arp2/3 complex to chemotax towards PDGF and EGF (Wu et al., 2012; Wu et al., 2013). The Arp2/3 complex is a seven-subunit complex that forms branched actin structures found in lamellipodia; this function is actuated downstream of certain chemotactic signaling pathways, including the aforementioned PI3K (Rotty et al., 2013). Surprisingly, we found that the Arp2/3 complex is dispensable for chemotaxis towards PDGF or EGF, provided that the media is exchanged during the experiment to flush out secreted factors produced by the Arp2/3-depleted cells (Wu et al., 2013). It is notable that the Arp2/3-depleted cells are unable to respond to surface-bound gradients of extracellular matrix (haptotaxis), indicating that RTK chemotaxis and haptotaxis have different requirements for cytoskeletal organization and dynamics (Wu et al., 2012). These results prompted us to probe the molecular mechanisms that link signal transduction, elicited by RTK ligands such as PDGF, to asymmetric force transduction by the cytoskeleton in mesenchymal cells.
Results
Signaling pathways implicated in amoeboid chemotaxis are dispensable for mesenchymal chemotaxis to PDGF
To address the mechanism of mesenchymal cell chemotaxis, we utilized a microfluidic chemotaxis chamber system established previously (Wu et al., 2012)(Fig. 1A (i)). In this system, we routinely generate 1 mm long, linear gradients of growth factors or small molecules that are stable for up to 24 hours and are compatible with a variety of live-cell imaging techniques (Fig. 1A (ii, iii)). To measure chemotaxis, cells migrating in the gradient chambers were tracked (Sup.Movies.1, 2; Fig. 1B (i)) and information about migration speed, persistence and directionality were extracted from the tracks. The migration speed and persistence (D/T ratio) were assessed by standard methods (Fig. S1A). Forward Migration Index (FMI), net distance moved in the direction of the gradient divided by total path length, was used to quantify directionality (Fig. S1A). For purposes of this study, we considered an FMI >0.1 to indicate positive chemotaxis, FMI with a 95% confidence interval encompassing zero to indicate no chemotaxis and an FMI < -0.1 to indicate chemo-repulsion. Directionality was represented graphically as circular, wind-rose histograms, where length of each leaflet corresponds to the percentage of cells migrating in the direction of leaflet (Fig. 1B (ii)). It is important to note that wind-rose plots do not convey information about speed or persistence of cell migration. Although many treatments described in this study affected either migration speed or persistence, there seemed to be little correlation with directionality as reported by FMI. The relationship amongst these properties will be pursued in a separate study, with this work remaining focused on identifying the molecular pathway of directional sensing and response in mesenchymal cells. The specific PDGF-R inhibitor, AG-1296 (Kovalenko et al., 1997), blocked the chemotactic response (Fig. 1B (iii)), confirming the cognate mechanism of the apparent PDGF gradient sensing.
Figure 1. Pathways that are dispensable for mesenchymal chemotaxis.
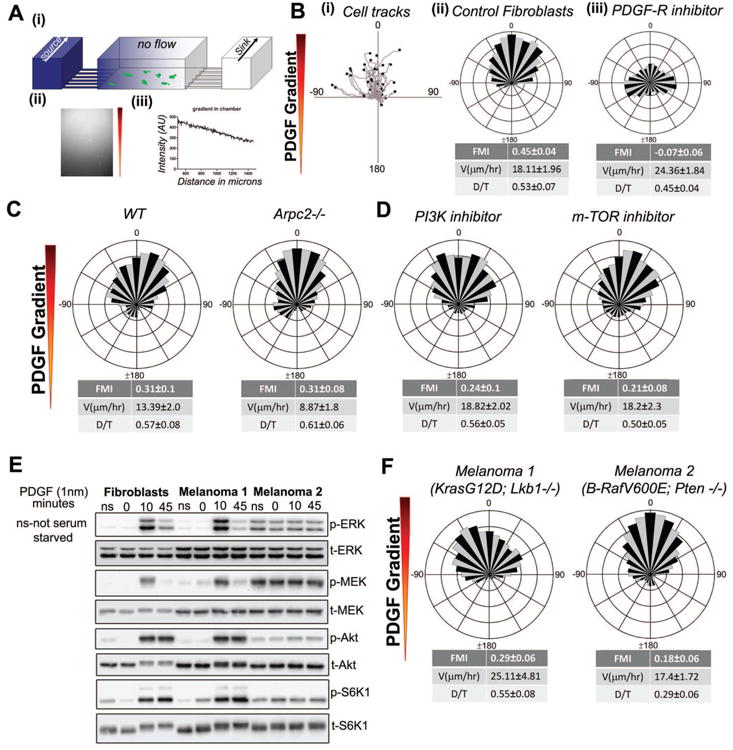
A. (i) A 3D schematic of the microfluidic chamber used for chemotaxis experiments. (ii) The fluorescent micrograph shows the formation of Cy5 dextran gradient in the channel. (iii) A line scan of fluorescent intensity of the gradient indicates that a linear gradient is formed in the chamber with an approximate slope of 43%.
B. (i) Migratory tracks of IA32 fibroblast chemotaxing to a PDGF gradient (ii) Cell tracks of chemotaxing cells represented as a wind-rose plot (number of cell tracked (n) = 62). Each leaflet represents the count frequency of cells migrating in the corresponding angular bin. Forward Migration Index (FMI), persistence (D/T) and velocity values are indicated below the plot, +/- 95% C.I. (iii) Wind-rose plot showing inhibition of chemotaxis to PDGF in the presence of a uniform concentration of PDGF-R inhibitor, AG1296 (1 μM) (n = 68).
C. Wind-rose plots of PDGF chemotaxis of WT (pre-Cre deletion) (n=82) and Arpc2 KO (n = 71) MEFs.
D. Directional migration response of fibroblasts to PDGF gradient in the presence of uniform PI3Kα inhibitor IV (5 μM) (n = 74) or m-TOR inhibitor AZD8055 (1 μM) (n = 56).
E. Western blot analysis of fibroblasts and melanoma cells stimulated with PDGF for the indicated incubation times, ns indicates not serum-starved. Phosphorylation of ERK, MEK, Akt and S6K1 were assessed.
F. Chemotaxis of K-Ras/Lkb1 null (Melanoma 1) (n = 72) and B-Raf/Pten null (Melanoma 2) (n = 81) tumor cell lines to a PDGF gradient.
With this system, we sought to identify the pathway used by slow-moving mesenchymal cells such as fibroblasts for PDGF chemotaxis. Our previous results on the role of the Arp2/3 complex in chemotaxis relied on depletion by RNA interference or by the chemical inhibitor CK-666, neither of which ensures complete elimination of Arp2/3 function (Wu et al., 2012). To corroborate those findings, we assessed chemotaxis of fibroblasts derived from a conditional knockout of the Arpc2 gene, which encodes the essential p34 subunit of the Arp2/3 complex. In accord with our previous results, genetic deletion of Arp2/3 complex function does not block PDGF chemotaxis in our chamber system (Fig. 1C). Two pathways that have been implicated in amoeboid chemotaxis are phosphoinositide 3-kinase (PI3K) and mammalian target of rapamycin (mTOR) (Parent and Devreotes, 1999; Swaney et al., 2010; Weiner, 2002). To determine whether or not these pathways are required for fibroblast chemotaxis to PDGF, we treated cells with inhibitors targeting either PI3K (PI3Kα inhibitor IV) or mTOR (AZD8055) during the chemotaxis experiment. These treatments block the expected signaling readouts effectively (Fig. S1B, C), but neither of them prevents PDGF chemotaxis of fibroblasts (Fig. 1D). PDGF chemotaxis in the absence of PI3K signaling corroborates previous findings (Melvin et al., 2011).
To extend these results, we turned to mesenchymal tumor cells derived from genetically engineered murine (GEM) models of melanoma harboring oncogenic mutations in pathways implicated in chemotaxis. The first cell line, LKB878, harbors two mutant copies of K-Ras (G12D) and lacks the tumor suppressor LKB1 (Liu et al., 2012). The second cell line, PBT-2460, harbors a mutation in B-Raf (V600E) and lacks PTEN (Hanna et al., 2013). Both of these cell lines exhibit mesenchymal morphology, with stress fibers and mature focal adhesions (Fig. S1D). We probed the pathways downstream of the PDGF receptor in these cell lines. Compared with control fibroblasts, the LKB878 cells showed elevated basal MEK/ERK signaling without PDGF stimulation and further activation of this pathway upon PDGF treatment. Akt activation appeared intact in this cell line. Conversely, the PBT-2460 line showed substantial basal phosphorylation of both MEK/ERK and Akt and no further stimulation upon PDGF treatment (Fig. 1E). When these cell lines were analyzed in the microfluidic chambers, both displayed robust PDGF chemotactic responses (Fig. 1F). These data suggest that mutations in these signaling pathways, which affect amoeboid chemotaxis, do not affect mesenchymal chemotaxis to PDGF.
Myosin IIA is required for mesenchymal chemotaxis
These data beg the question: what is required for mesenchymal chemotaxis? One treatment that blocks PDGF chemotaxis in our chamber system is the Myosin II inhibitor, blebbistatin (BLB; Fig. 2A, Sup.Mov.3) (Straight et al., 2003). Although this drug alters cell morphology and cytoskeletal structure, the speed of locomotion of BLB-treated fibroblasts was similar to that of untreated controls (Fig. 2A,B). The effects of BLB were reversible, as chemotaxis resumed upon wash-out of this drug and re-establishment of the PDGF gradient in the chamber (Fig. 2A). Fibroblasts express two isoforms of Myosin II, MyoIIA and MyoIIB (Even-Ram et al., 2007; Vicente-Manzanares et al., 2008). To confirm and extend our BLB results, we depleted these isoforms separately using multiple independent siRNAs. Whereas depletion of MyoIIB did not affect chemotaxis, depletion of MyoIIA ablated PDGF chemotaxis in fibroblasts (Fig. 2C, S2A,B).
Figure 2. Myosin IIA is required for chemotaxis, whereas Myosin IIB is dispensable.
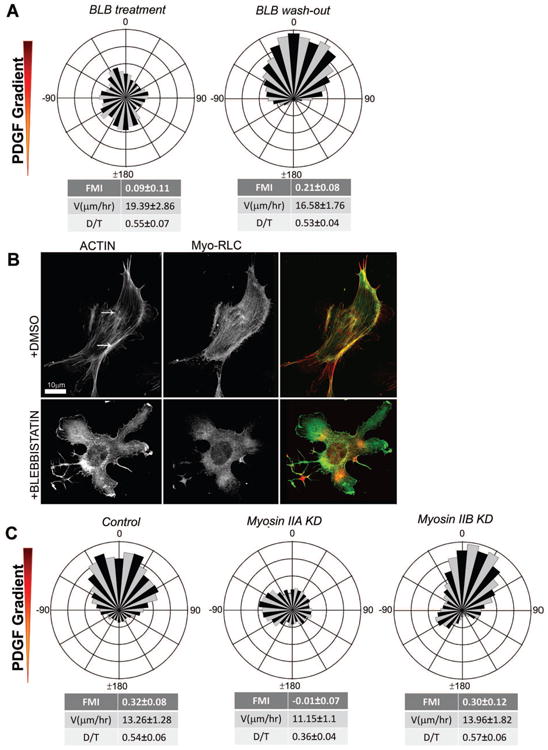
A. Rose plot showing loss of chemotaxis in the presence of uniform concentration of blebbistatin (BLB, 15 μM) (n = 123) and recovery of chemotactic migration after wash-out of BLB (n = 97).
B. Immunofluorescence of IA32 fibroblasts shows myosin light chain (GFP) and F-actin (red, Phalloidin) in cells before and after uniform BLB treatment.
C. Circular histograms showing chemotaxing control cells, loss of chemotactic migration in Myosin IIA KD (n = 80) cells and intact chemotaxis in Myosin IIB KD cells (n = 61).
Non-canonical regulation of Myosin IIA via PKCα is required for mesenchymal chemotaxis
We reasoned that PDGF chemotaxis might be governed by asymmetric regulation of MyoIIA activity. The canonical pathway of Myosin II regulation involves activating phosphorylation of Threonine 18 and Serine 19 (Thr18/Ser19) on the regulatory light chain (RLC; also known as MLC-20) of the Myosin II complex by several kinases (Vicente-Manzanares et al., 2009) (Fig. 3A). However, consistent with previous studies (Komatsu and Ikebe, 2007), stimulation of fibroblasts with PDGF, PMA (phorbol ester) or EGF produced no increase in Ser19 phosphorylation (Fig. 3B, S3A). We also used correlative immunofluorescence to image pSer19 RLC during chemotaxis in the chamber and observed no bias in distribution of this modification relative to the PDGF gradient (Fig. S3B,C). To functionally confirm that Thr18/Ser19 phosphorylation does not play a major regulatory role in PDGF chemotaxis, we treated fibroblasts with either ROCK or MLCK inhibitors (Y27632, peptide 18) to inhibit the predominant kinases that phosphorylate Thr18/Ser19 in fibroblasts. Separately, neither of these treatments blocked PDGF chemotaxis. Consistent with the need for some Myosin II activity to execute chemotaxis, however, simultaneous inhibition of ROCK and MLCK blocked PDGF chemotaxis (Fig. 3C). Together, these data suggest that the canonical regulatory pathway of Myosin II is unlikely to play a major role in PDGF chemotaxis and that a different MyoIIA regulatory mechanism may be required.
Figure 3. Chemotaxis requires regulation of Myosin II function via non-canonical RLC phosphorylation.
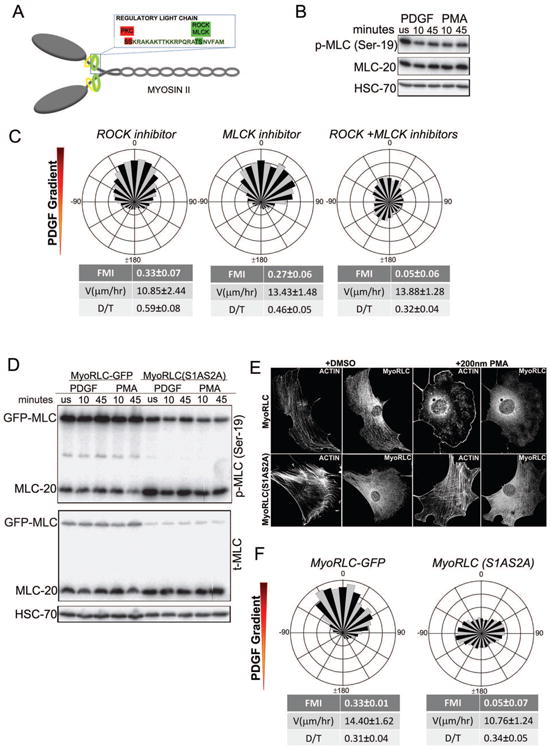
A. Schematic of Myosin Regulatory Light Chain (Myo RLC) showing phospho-regulatory sites Ser1/Ser2 and Thr18/Ser19. Ser1/Ser2 are inhibitory phosphorylation sites regulated by conventional PKCα. Thr18/Ser19 are activating phosphorylation sites regulated by ROCK and MLCK.
B. Western blot analysis to probe the extent of Ser19 phosphorylation of Myosin II RLC, which shows no change in response to PDGF or PMA stimulation.
C. Wind-rose plots of cell migration show PDGF chemotaxis in the presence of either ROCK inhibitor Y27632 (15 μM) (n = 161) or MLCK inhibitor peptide 18 (10 μM) (n = 104). When added together, the ROCK and MLCK inhibitors impede chemotactic migration to PDGF (n = 94).
D. Western blot analysis of Ser19 phosphorylation of Myosin II RLC after PDGF or PMA stimulation of both MyoRLC-GFP and MyoRLC(S1AS2A) cells shows no change in Ser19 phosphorylation of either the endogenous or GFP-tagged RLC.
E. Immunofluorescence images of MyoRLC-GFP and MyoRLC(S1AS2A)-GFP cells show disassembly of actin stress fibers in wild-type cells and no disassembly in myosin mutant cells upon PMA stimulation.
D. Wind-rose plots showing chemotaxing control MyoRLC-GFP cells (n=61) and non-chemotaxing mutant MyoRLC(S1AS2A)-GFP cells (n= 73) in a PDGF gradient.
Aside from the canonical regulatory pathway, Myosin II can also be regulated by non-canonical pathways such as the inhibitory phosphorylation of RLC on Serines 1 and 2 by conventional PKCs such as PKCα (Fig. 3A) (Bengur et al., 1987; Ikebe et al., 1987; Kawamoto et al., 1989; Komatsu and Ikebe, 2007; Nishikawa et al., 1984; Varlamova et al., 2001; Vicente-Manzanares et al., 2009). To assess the role of Ser1/2 inhibitory phosphorylation in PDGF chemotaxis, we generated GFP fusions of the wild-type RLC and a RLC mutant containing non-phosphorylatable alanine substitutions (S1AS2A) and expressed these in fibroblasts in a Dox-inducible manner. Upon expression, neither the wild-type nor the mutant GFP fusions altered the phosphorylation of RLC Ser19, with or without PDGF/PMA stimulation (Fig. 3D). Consistent with previous studies using PDGF, expression of the S1AS2A RLC, but not the wild-type RLC, blocked the disassembly of actin stress fibers in response to PMA treatment (Fig. 3E) (Komatsu and Ikebe, 2007). Expression of the S1AS2A dominant-negative RLC blocked PDGF chemotaxis, whereas the wild-type RLC construct did not affect this process (Fig. 3F). These data indicate that regulation of MyoIIA via Ser1/2 RLC inhibitory phosphorylation is critical for PDGF chemotaxis.
Expression profiling showed that PKCα is the only conventional PKC isoform expressed in IA32 fibroblasts (Wu et al., 2013). To test whether or not PKCα is required for PDGF chemotaxis in fibroblasts, we inhibited this kinase using the small molecule inhibitor Gö6976 (Martiny-Baron et al., 1993). This compound blocked PDGF chemotaxis in a reversible manner (Fig. 4A). To corroborate this result, we depleted PKCα using multiple independent siRNAs (Fig. S4A) and confirmed that this too blocks PDGF chemotaxis (Fig. 4B, S4B). One possibility is that PKCα activity is required for events unrelated to directional migration, such as maintenance of a specific gene expression pattern. To rule out this possibility, we generated a gradient of Gö6976 in our microfluidic chamber system. Fibroblasts in this gradient (without exogenous PDGF present) display chemo-repulsion, migrating away from the higher drug concentration (Fig. 4C). This result was confirmed using a gradient of LY333531, a structurally unrelated conventional PKC inhibitor (Fig. S4C). Interestingly, cells expressing the dominant-negative S1AS2A RLC construct were refractory to the chemo-repulsive effects of Gö6976 (Fig. 4C), as were cells depleted of PKCα (Fig. S4D). These data indicate that PDGF chemotaxis in fibroblasts involves the regulation of MyoIIA activity via phosphorylation of the non-canonical, inhibitory Ser1/2 sites of RLC by PKCα.
Figure 4. PKCα is essential for chemotaxis.
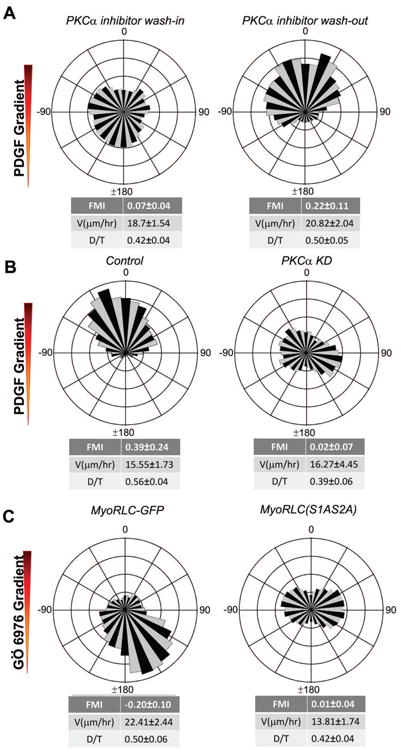
A. Wind-rose plots of fibroblasts in a PDGF gradient show inhibition of chemotaxis in the presence of a uniform concentration of PKCα inhibitor, Gö6967 (1 μM) (n=162) and recovery of chemotaxis after drug wash-out (n=88).
B. Circular histograms show chemotaxis of wild-type fibroblasts in a PDGF gradient and the lack of chemotactic response of PKCα KD cells (n=68) in the same chamber.
C. Chemo-repulsion of wild-type cells to gradients of Gö6967 (n=101). Mutant MyoRLC (S1AS2A) cells do not exhibit directional migration in a gradient of Gö6967 (n=89).
Localized DAG production by PLCγ is required for mesenchymal chemotaxis
Conventional PKC isoforms such as PKCα are activated by a combination of the membrane lipid diacylglycerol (DAG) and cytosolic calcium (Ca++) (Tanimura et al., 2002; Wu-Zhang and Newton, 2013). The enzyme PLCγ is activated directly by the PDGF receptor and hydrolyzes the phosphoinositide PIP2 to produce DAG and IP3, and the latter induces Ca++ release from intracellular stores (Hess et al., 1998). To test whether or not PLCγ is required for fibroblast chemotaxis to PDGF, we depleted PLCγ1 (the only isoform expressed in IA32 fibroblasts) by multiple siRNAs and, in parallel, utilized PLCγ1-/- MEFs and their rescued derivative cell line (Fig. S5A). Both depletion and deletion of PLCγ1 blocked PDGF chemotaxis (Fig. 5A,B; S5B), indicating that signals generated by this enzyme are critical for directional migration towards PDGF.
Figure 5. PLCγ is essential for PDGF chemotaxis and produces an asymmetric pattern of intracellular DAG.
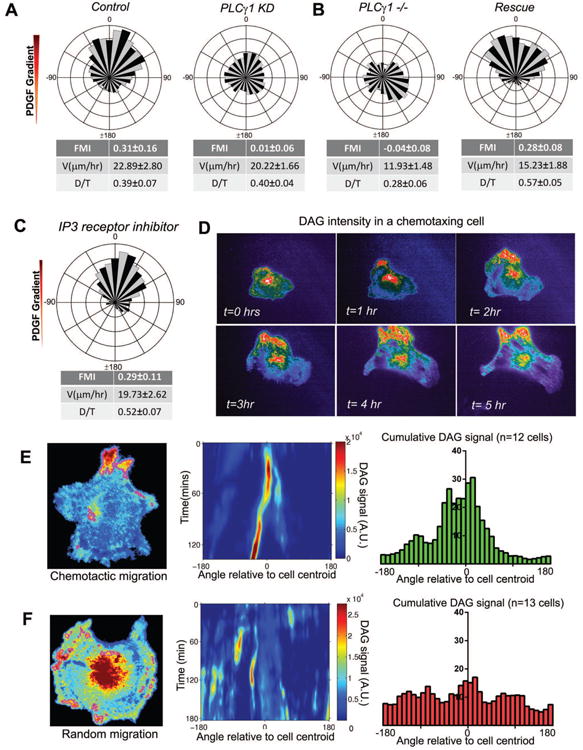
A. Wind-rose plot of control cells migrating in a PDGF (n=67) gradient and loss of directional migration of PLCγ KD cells (n=70) in the same chamber.
B. Fibroblasts derived from PLCγ-null (PLCγ1-/-) (n=73) mice show a loss of chemotactic response to PDGF. Upon rescue of PLCγ expression, these fibroblasts regained their ability to chemotax (n=101).
C. Circular histogram of cells chemotaxing to PDGF gradients in a uniform concentration of Xestospongin-(c) (1 μM) (n=69).
D. Montage of an IA32 fibroblast transfected with GFP-tagged tandem C1 domain [(C1)2-GFP] chemotaxing to PDGF for more than five hours.
E. Enriched pixels in a chemotaxing cell are shown outlined in magenta. The intensity values of the segmented pixels are summed within angular bins at each time point to create a signaling “map” with the angle plotted on the horizontal axis and time on the vertical axis. Histogram showing the cumulative intracellular DAG distribution in chemotaxing cells expressing (C1)2-GFP (n=12 cells).
F. Enriched pixels in a randomly migrating cell are shown outlined in magenta. The intensity values of the segmented pixels are summed within angular bins at each time point to create a signaling “map” with the angle plotted on the horizontal axis and time on the vertical axis. Histogram showing the cumulative intracellular DAG distribution in randomly migrating cells expressing (C1)2-GFP (n=13 cells).
To assess the role of intracellular Ca++ in PDGF chemotaxis, we used pharmacological inhibition of several potential sources of Ca++ To block IP3-mediated release of Ca++ from intracellular stores, we treated cells with Xestospongin-(c), a specific IP3 receptor inhibitor (Gafni et al., 1997). This treatment blocks PDGF-induced Ca++ increase in uniform application experiments (not shown) but did not block PDGF chemotaxis (Fig. 5C). To block mechanically sensitive Ca++ channels, we treated cells with Gd3+, a blocker of these channels (Yang and Sachs, 1989). In the presence of multiple concentrations of Gd3+, chemotactic response was intact, albeit with lower fidelity (Fig. S5C). Simultaneous treatment with Xestospongin-(c) and Gd3+ arrested all cell motility (not shown), and therefore we were unable to test for an effect on chemotaxis. Together, while these data confirm that cytosolic Ca++ is important for overall cell motility, they suggest that Ca++ is unlikely to be a significant directional determinant towards PDGF cues in our system.
To visualize the intracellular distribution of DAG, another signal generated by PLCγ in a PDGF gradient, we utilized a GFP-tagged fragment of PKCγ containing tandem C1 domains as a translocation biosensor for DAG (Oancea et al., 1998). Since our microfluidic chamber system allows high-resolution live-cell imaging, we visualized this probe by total internal reflection fluorescence (TIRF) microscopy. To verify the utility of this probe, we expressed it in the PLCγ1-depleted cells and observed no membrane recruitment of this probe to the ventral plasma membrane (imaged by TIRF) upon uniform PDGF stimulation, but did observe a bright signal with subsequent PMA stimulation (Fig. S5D). When this probe was expressed in control cells and imaged in a PDGF gradient, we observed a striking localization of DAG to the up-gradient portion of the cell that persisted for hours (Fig. 5D, Sup.Mov.4). Quantification of this localization (see methods, Fig. S5E) across many cells showed significant enrichment of this probe up-gradient, as compared with randomly migrating cells (Fig. 5E,F). These data indicate that DAG, produced locally by PLCγ1, is critical for fibroblast chemotaxis to PDGF.
Phorbol ester (PMA) gradients bypass the need for PDGF receptors and PLCγ, but not PKCα or Myosin II function
To functionally test the role of DAG in PDGF chemotaxis, we generated a gradient of the DAG-mimetic PMA in our microfluidic chamber system (Fig. 6A). Consistent with a positive, instructive role for DAG in this pathway, fibroblasts exposed to the PMA gradient migrated towards the higher concentration of PMA (Fig. 6B). This PMA ‘chemotaxis’ was independent of PDGF receptor tyrosine kinase activity, as it still occurred in the presence of the PDGF-R inhibitor (Fig. 6C). A PMA gradient also bypasses the need for PLCγ1, as shown by the positive migration of PLCγ1-/- MEFs in this gradient (Fig. 6C). However, PMA was not able to bypass the need for PKCα or for Myosin II RLC Ser1/2 phosphorylation in the directional migration response (Fig. 6D).
Figure 6. Phorbol ester (PMA) gradients bypass the need for PDGF receptors and PLCγ, but not PKCα or Myosin II function.
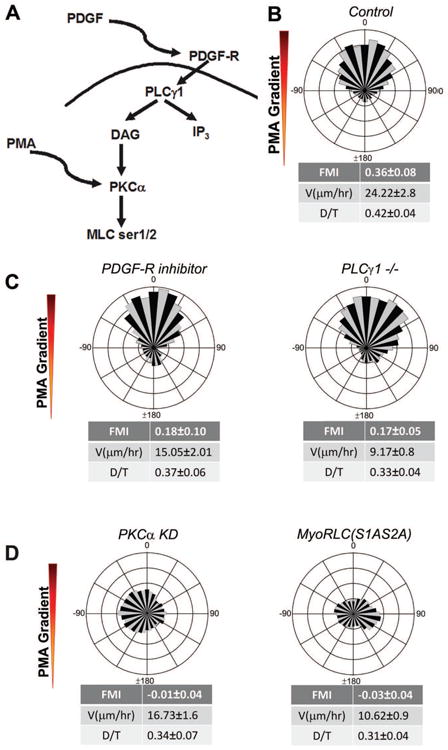
A. Wind-rose plot of IA32 fibroblasts chemotaxing in PMA gradients (n=89).
B. Wind-rose plots show that PMA gradients rescue chemotaxis of both IA32 fibroblasts in a uniform concentration of PDGF-R inhibitor AG1296 (1 μM) (n=45) and that of PLCγ1 -/- fibroblasts (n=61).
C. Circular histograms showing no rescue of chemotaxis of PKCα KD (n=85) or mutant Myo-RLC(S1AS2A) cells (n=187) in PMA gradients.
Localized inactivation of Myosin II at the leading edge is sufficient to promote directional migration
Our functional data support a model for PDGF chemotaxis that involves localized inactivation of Myosin IIA on the up-gradient side of the cell via the PLCγ1 → PKCα → RLC (Ser1/2) pathway. To visualize the organization of Myosin II during chemotaxis, we imaged either the wild-type or S1AS2A form of the GFP-tagged RLC by TIRF microscopy. Previous work has shown that Myosin II has a characteristic pattern of supramolecular organization from the leading edge of a mesenchymal cell towards the cell body (Svitkina et al., 1997). At the edge, a soluble pool of Myosin II accumulates into puncta or spots. These puncta coalesce into bundled fiber-like structures consistent with localization to stress fibers (Fig. S6A). At the leading edge of chemotaxing fibroblasts expressing the wild-type RLC-GFP, we noted that puncta are enriched, whereas actomyosin bundles are largely absent (Sup. Mov. 5, left panel). We developed an image analysis method to segment and classify these structures using texture-based approaches (see methods, Fig. S6B). To quantify the Myosin II organization, we averaged the distribution of puncta and bundled structures across multiple cells in PDGF gradients. Consistent with our visual observations, cells expressing the wild-type RLC-GFP showed increased puncta and decreased stress fibers on the up-gradient side of the cell (Fig. 7A), whereas S1AS2A-RLC-GFP showed even distribution of puncta and stress fibers around the perimeter of the cell (Fig. 7B, Sup. Mov. 5, right panel).
Figure 7. Asymmetric Myosin II organization and activity are hallmarks of chemotactic migration in mesenchymal cells.
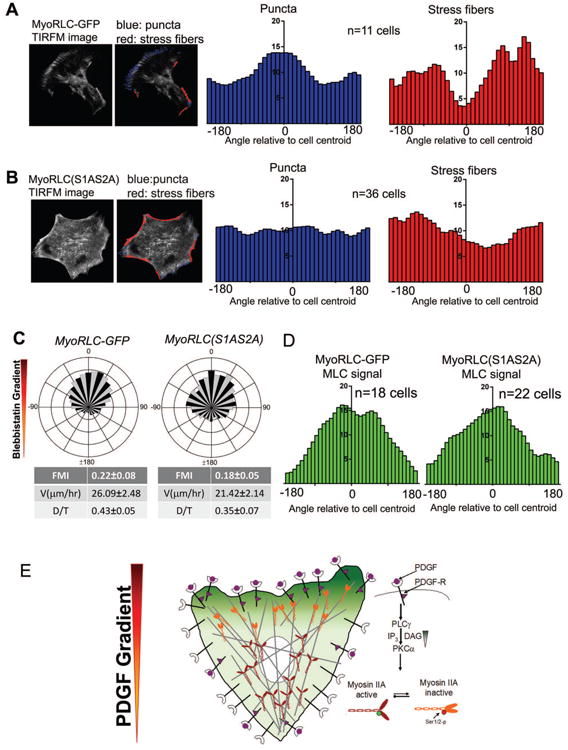
A. TIRF microscopy movies of chemotaxing MyoRLC-GFP cells are analyzed to identify puncta (blue) and stress fiber regions (red). The localization of puncta and stress fibers relative to the cell centroid were averaged across multiple cells (n=11 cells) and presented as histograms.
B. Analysis of puncta and stress fiber distributions, quantified as in A, in MyoRLC(S1AS2A)-GFP cells (n=36cells).
C. Circular histograms of MyoRLC-GFP (n=162) and MyoRLC(S1AS2A) (n=67) cells chemotaxing in a gradient of BLB.
D. Intensity of MyoRLC-GFP and MyoRLC(S1AS2A)-GFP during chemotaxis in a BLB gradient, presented as a histogram.
E. Proposed model of PDGF chemotaxis: PDGF binds to PDGFR, recruits PLCγ to produce a localized intracellular gradient of DAG. The asymmetric DAG phosphorylates RLC at Ser1/2 via PKCα, inactivating MyoIIA at the leading edge of the chemotaxing cell. This localized Myosin II inactivation provides the asymmetry of force needed for directional migration.
To further challenge our hypothesis about localized inactivation of Myosin II during fibroblast chemotaxis, we exposed cells to gradients of BLB in our microfluidic chamber system. It is important to note that we used a lower concentration of this drug in these gradient experiments than previous uniform treatments (3μM source, ∼1.75μM gradient midpoint). This cue promoted the positive migration of fibroblasts towards the higher concentration of BLB, although with a reduced FMI compared to PDGF chemotaxis (Fig. 7C, Sup. Mov. 6, left panel). Uniform BLB treatment caused disassembly of actin stress fibers in both S1AS2A RLC-GFP- and wild-type RLC-GFP-expressing cells, consistent with BLB acting at the molecular interface between Myosin II and F-actin, downstream of Ser1/2 phospho-regulation (Fig. S6C, 2B). Therefore, we reasoned that this gradient should bypass the S1AS2A dominant-negative RLC. Indeed, cells expressing the mutant construct showed positive migration towards BLB (Fig. 7C, Sup.Mov.6, right panel). We also imaged the localization of Myosin II in the BLB gradients for both wild-type and S1AS2A RLC-GFP by TIRF microscopy. At these sub-saturating BLB concentrations, stress fibers were reduced in the TIRF imaging, so we concentrated on the puncta. Consistent with the observed functional bypass by the BLB gradient, cells expressing either wild-type or S1AS2A RLC-GFP showed increased puncta intensity on the up-gradient side of the cell (Fig. 7D, S6D). Together, these data indicate that localized inhibition of Myosin II by a gradient of BLB is sufficient to provoke directional migration, with movement biased in the direction of decreasing Myosin II activity.
Discussion
Using our direct observation chemotaxis chamber, we have elucidated an obligate pathway for mesenchymal chemotaxis towards the RTK ligand PDGF (Fig. 7E). The PDGF receptor, upon activation, recruits PLCγ to produce a localized intracellular gradient of DAG. The critical enzyme that responds to this gradient is PKCα, which phosphorylates RLC at Ser1/2 and thus inactivates MyoIIA at the leading edge of the chemotaxing cell. This localized Myosin II inactivation provides the asymmetry of force needed for directional migration. These results present a significant step forward in our understanding of chemotaxis in mesenchymal cells, but a number of questions arise from these findings.
Asymmetric PDGF receptor signaling and chemotaxis
PDGF receptors mobilize numerous signaling pathways via recruitment of adaptor proteins and enzymes to their auto-phosphorylated cytoplasmic tails. Although many of the signaling pathways downstream of the PDGF receptor are well understood from a biochemical, structural and kinetic perspective, understanding how they are regulated in a cell experiencing asymmetric stimulation as in chemotaxis presents a new set of challenges. Not only must individual signaling components and pathways be evaluated for their roles in chemotaxis, but also the spatial and temporal aspects of this signaling must be considered.
To break spatial symmetry, our data point to PLCγ as the key downstream enzyme that must be activated for fibroblasts to chemotax towards PDGF. One of the products of this enzyme, DAG, is maintained in a stable internal gradient within chemotaxing mesenchymal cells. Similar observations have recently been made during collective cell migration of endothelial cells in scratch assays (Tsai et al., 2014). This internal gradient can be partially phenocopied by providing cells with an extracellular gradient of the cell-permeable DAG analog, PMA. This suggests that an internal gradient of DAG is both necessary and sufficient to provide the asymmetric intracellular cue for chemotaxis. In future studies, it will be important to investigate how this internal gradient of DAG is maintained. Regulators of this internal gradient are likely to include the DAG kinases, which convert DAG into phosphatidic acid and thus limit the spatial range of DAG diffusion in the plasma membrane. The other product of PIP2 hydrolysis by PLCγ is IP3. Based on our inhibitor studies, the action of IP3 prompting Ca++ release from internal stores is not required for PDGF chemotaxis, and neither is the action of stretch-activated Ca++ channels. These results stand in contrast with a previous study implicating Ca++ influx in the ability of fibroblasts to turn towards a PDGF gradient (Wei et al., 2009). As discussed in more detail below, certain signaling pathways might allow cells to reorient towards a gradient more efficiently, while at the same time being dispensable for chemotaxis. Intracellular Ca++ is likely to be important for directional migration in a variety of other contexts. Indeed, in monolayer migration of endothelial cells, pulses of Ca++ have been shown to activate Myosin II activity via MLCK to trigger retraction of the leading edge (Tsai and Meyer, 2012). The context-dependent source, functional role, and localization of Ca++ during directional migration, and its relationship to differential Myosin II activity, will require further investigation.
Our studies have identified PDGF-R → PLCγ → PKCα → Myosin II as an obligate pathway for mesenchymal chemotaxis, but other pathways activated by the PDGF receptor likely contribute to the fidelity of this process and may prove to be required for chemotaxis under different conditions, such as shallower gradients (Bosgraaf et al., 2008). In support of this view, gradients of PDGF elicited greater chemotactic fidelity than did gradients of PMA, and still lower fidelity was promoted by gradients of BLB. This suggests that PI3K and possibly other signaling pathways triggered by PDGF likely enhance chemotaxis and/or the efficiency of the cells' alignment with the gradient (Welf et al., 2012) even though PI3K signaling, along with Rac (Monypenny et al., 2009) and the Arp2/3 complex (Wu et al., 2012), are dispensable for executing this process.
A related question that arises is: where is the amplification found in our system? Stated another way, how does a mesenchymal cell convert a fairly shallow gradient of receptor occupancy on the cell surface into a robust internal gradient that leads to directed cell translocation? A common mechanism for amplification of chemical signaling is positive cooperativity or feedback (Iglesias and Devreotes, 2012; Jilkine and Edelstein-Keshet, 2011). Such mechanisms at the level of PLC/PKC signaling will need to be explored. One interesting candidate is the regulation of cofilin activity downstream of PLCγ that has been observed during EGF chemotactic signaling in adenocarcinoma cells (Mouneimne et al., 2006). Downstream of this pathway, another possible source of amplification is at the level of myosin contractility itself. A relatively modest change in local myosin activity could affect local F-actin organization in a nonlinear manner, thus magnifying changes in myosin activity. Further experiments will be required to discriminate between these and other possible mechanisms of amplification during mesenchymal chemotaxis towards RTK ligands.
Myosin II regulation and chemotaxis
At the heart of the pathway we have defined in this work is the generation of asymmetric Myosin II activity by chemotactic signaling. Although Myosin II activity has been linked to chemotaxis in amoeboid cells through genetic approaches, it has always been considered a peripheral player in this process, however, our data establish a central role of Myosin II in mesenchymal chemotaxis. In some ways, the role of Myosin II in chemotaxis is not surprising, since it is one of the main force generators in cells (along with actin polymerization). The pathway we have defined asymmetrically regulates Myosin II activity (and thus asymmetric force generation) not by selective activation, but by selective inactivation on the up-gradient side of the cell. Our data sheds new light on this problem and also raises several questions about how Myosin II is regulated and the role it plays in crawling cells.
Myosin II activity can be regulated by a variety of mechanisms, but the dominant mode of regulating this protein complex is through activating phosphorylation of Thr18/Ser19 on the RLC. Therefore, we were surprised to discover that this mechanism is not responsive to PDGF stimulation and does not appear to play a major role in PDGF chemotaxis. Instead, our data indicate that non-canonical, inhibitory phosphorylation of RLC on Ser1/2 is critical for PDGF chemotaxis in fibroblasts. This inhibitory phosphorylation of this site was discovered in the 1980s, but it has received comparatively little attention relative to Thr18/Ser19 phosphorylation. Although phosphorylation of Ser1/2 is dispensable for cytokinesis in HeLa cells (Beach et al., 2011), it is important for disassembly of stress fibers in response to PDGF or PMA (Komatsu and Ikebe, 2007). Recently, phosphorylation of Ser1/2 was identified as a critical regulatory mechanism for T cell polarization (Liu et al., 2013). Unfortunately, the molecular mechanism of the inhibitory effect of this phosphorylation is unknown. One proposed mechanism is that phosphorylation of Ser1/2 blocks or inhibits the phosphorylation of Thr18/Ser19 by kinases such as ROCK or MLCK (Ikebe et al., 1987), however our data argue against that possibility.
How does asymmetric Myosin II activity lead to directed cell migration? This question is likely to have a fairly complicated answer. Myosin II is an abundant protein with a significant role in organizing actin filament networks in cells, in addition to generating contractile force through its motor activity (Vicente-Manzanares et al., 2009). It is useful to consider the primary effects of Myosin II inhibition and the secondary consequences of those primary effects. Two primary effects of Myosin II inhibition are alterations in actin organization and filament integrity. Lower Myosin II activity will lead to slower formation of bundled actomyosin structures and stress fibers and less compaction of loose filament networks at the lamellipodium/lamella boundary. Myosin II activity has also been linked to actin filament severing (Wilson et al., 2010), and reduced severing in the up-gradient side of the cell could locally alter actin dynamics. The secondary effects of these changes could be slower actin retrograde flow and altered protrusion and focal adhesion dynamics. In a cell undergoing chemotaxis, these changes are biased by the PLCγ/PKCα pathway to the up-gradient side of the cell, leading to the observed bias in cell translocation. Another possible outcome is that global gradients in Myosin II activity will result in higher overall contractility in the down-gradient side of the cell, promoting the squeezing of cellular contents towards the up-gradient side.
Chemotaxis across diverse cell types: different molecules, same principles?
One of the main findings in this paper is that mesenchymal cells such as fibroblasts use a molecular pathway for chemotaxis that is different than the pathways used by amoeboid cells. This finding highlights the diversity of chemotactic mechanisms that operate in different cell types. One possible source of this difference is the way that each cell type utilizes Myosin II. In mesenchymal cells, which are much more adherent, Myosin II is found throughout the cell and controls contractile stress fiber networks that span the cell from front to back. In amoeboid cells, which are far less-adherent, Myosin II is largely confined to the rear uropod, and no stress fibers are present. Therefore, mesenchymal cells may be particularly sensitive to mechanisms that locally control Myosin II activity. Another difference is the types of receptors that trigger the chemotactic response. Although some amoeboid cells are capable of responding to both RTK and GPCR ligands (Park et al., 2011), the vast majority of studies on amoeboid chemotaxis have focused on GPCR ligands such as fMLP in neutrophils or extracellular cAMP for Dictyostelium cells. It will be interesting to examine RTK-driven chemotaxis in amoeboid cells or GPCR chemotaxis in mesenchymal cells. Unfortunately, examination of the transcriptome generated by RNA-Seq has not revealed obvious candidate chemotactic GPCRs expressed in our fibroblasts (unpublished observation). Finally, our data indicate that perturbing a single pathway (PLCγ → PKCα → Myosin IIA) in fibroblasts is sufficient to disrupt chemotaxis, whereas genetic studies in Dictyostelium amoebae have revealed a striking functional redundancy amongst at least five separate pathways in response to chemotactic stimulation (Swaney et al., 2010). Although we do not yet understand the difference between these two contexts, we speculate that the need for Dictyostelium cells to aggregate by chemotaxis under nutrient-poor conditions creates an intense selective pressure for redundancy.
Although the chemotactic pathway defined here for mesenchymal cells apparently uses different molecular players than amoeboid cells to achieve directed migration, it is worth considering the conceptual and functional similarities between these pathways. In both cases, soluble extracellular cues activate cell surface receptors in an asymmetric fashion. The signals must be converted into intracellular gradients of second messenger or intermediate molecules. This signaling module must be adept at both maintaining a robust pattern in the presence of long-term extracellular cues and changing rapidly to respond to new, acute stimuli, and it must effectively interface with the cytoskeletal network to produce the asymmetric force needed for directed cell translocation. In amoeboid cells, this force appears to be generated by actin polymerization in the protrusive pseudopod, whereas in mesenchymal cells, asymmetric force is generated by selective inactivation of Myosin II near the leading edge. A particularly intriguing problem in both instances is how the cytoskeletal or force-generating module feeds back into the signaling module to reinforce and refine directional migration.
Experimental Procedures
For complete methods, see the Extended Experimental Procedures found in the Online Supplemental Material.
Cell culture, viral transduction and plasmid/siRNA transfections
Cells were cultured in DMEM supplemented with 10% FBS (HyClone), 100 U/mL penicillin, 100 μg/mL streptomycin and 292 μg/mL L-glutamine. Retroviral packaging, infections, and fluorescence-activated cell sorting were performed as described (Bear et al., 2000). Lentivirus production and infection were performed as described (Cai et al., 2008). K-Ras;LKB1-/- cells, B-Raf;Pten-/- cells and PLCγ1-/-, PLCγ1 rescue cells were kind gifts from Sharpless lab (UNC-CH), Kim lab (UNC-CH), and Sondek lab (UNC-CH) respectively. Cells expressing tagged tandem C1 domains were generated by transient transfection protocols and Myosin II, PKC and PLC knock down cells were generated using standard siRNA knockdown protocols. Arpc2-/- fibroblasts were generated from tail tissue of mice harboring a floxed Arpc2 allele in the Ink4a/Arf-/- genetic background.
Generation of MyoRLC-GFP cell lines
pLL6-MYH12A construct was made by replacing 5′LTR promoter in pLL5.0 (Cai et al, 2008) with PTight promoter from pTRE-Tight Vector (Clontech) and inserting human MYH12A using EcoRI-BamHI cloning sites. MYH12A insert was obtained by PCR from cDNA isolated from human cell line WM-266-4 (ATCC CRL-1676™). Point mutations in MYH12A were introduced using standard overlap extension technique using KOD polymerase (EMD Millipore). Tetracycline-inducible MYH12A WT and S1AS2A-mutant IA32 cell lines were made by first preparing a stable rtTA-expressing IA32 cells using pLenti-CMV-rtTA3-hygro lentivirus infection (virus made with Addgene plasmid 26730) and selection with 100ug/mL hygromycin. These stable rtTA cells were then infected with pLL6-MYH12A-GFP lentivirus, and subjected to 3 rounds of FACS: first, cells were induced with 1ug/mL Doxycycline (Dox) and sorted for GFP-positive cells. The resulting cell population was then allowed to recover to uninduced state in absence of Dox and sorted for no GFP expression, and, finally, the cell population obtained after this sort was induced with 1ug/mL Dox again and sorted for high GFP expression. Resulting Tet-inducible MLC populations were induced with 1μg/mL Doxycyclene for 24 hours before chemotaxis experiments.
Directional migration image acquisition and analysis
PDMS microfluidic devices were prepared as described previously (Wu et al., 2012). Chemotaxis assays were performed on an Olympus microscope with a 20× objective using Metamorph imaging software. Images were collected every 10 minutes for up to 24 hours. Individual cells were manually tracked using ImageJ software (Manual Tracking plugin). Only viable and visibly migrating cells (net path length > 50μm) were tracked during the experiments. The tracks obtained were analyzed using the Chemotaxis Tool ImageJ plugin (http://www.ibidi.de/applications/ap_chemotaxis.html#imageanalysis). This analysis tool was used to extract the forward migration index (FMI) along with the velocity of migration and the persistence of migration using the D/T ratio (net path length/total path length). Further, the plugin also generates histograms (count frequency) of migration direction of cells for each data set. The secplot function of Matlab was then used to generate rose plots of directional migration on normalized polar coordinates where the outer most ring corresponds to frequency (r) of 8%.
Analysis of the DAG pattern
To correlate the intensity of DAG in a cell and direction of chemotaxis, a signalling map of the Tandem c1 probe was created. These fluorescent intensity maps were created for each cell by a process of thresholding, masking and segmenting within angular bins relative to cell centriod (supplementary methods, Welf et al., 2012). The normalized pattern are then averaged over all the cells for each condition to produce an aggregate plot. The linear (unbinned) plots are smoothed by local regression using weighted linear least squares and a first-degree polynomial mode. The cumulative DAG signal is then presented as a histogram with a bin size of 10 degrees for chemotaxing cells (n = 12 cells) and randomly migrating (n = 13 cells)(Fig. 5E, 5F). A similar approach was used to analyze the distribution of pSer19 of RLC in chemotaxing cells (Fig. S3B).
Analysis of Myosin II organization
Analysis similar to one described above was used. Due to the obscured visibility and discontinuity of the cell outline in cells expressing RLC-GFP constructs, a convex hull was created around the original cell mask. Using two-dimensional median filtering (Fig. S6B(1)), puncta (Fig. S6B(2)) and stress fibers in the outer ring of the convex hull mask are segmented. Each of the pixels associated with puncta and stress fibers are assigned to an angular bin with respect to the cell centroid (1 count per pixel); any bin containing both puncta and stress fibers are counted as stress fibers. Plots are then generated in the same manner as described above for the DAG pattern (See supplement). The data for the wild-type RLC-GFP-expressing cells in the PDGF gradient are shifted by the median angle of migration (not including angles more than 90° from the direction of the PDGF gradient), resulting in a 25-degree shift to the right. During migration in response to a BLB gradient, very few stress fibers were visible under TIRF imaging. Analysis was therefore performed in the same manner as for the DAG pattern to quantify RLC-GFP regions at the cell periphery.
Extended Experimental Procedures
Reagents and Materials
AlexaFluor dyes conjugated to phalloidin were from Invitrogen. Antibodies were purchased from Cell Signaling Technology, ECM Biosciences and Santa Cruz Biotechnology. PDGF-BB was purchased from BD Biosciences and PMA from Sigma. Inhibitors of PDGF-R, PI3K and MLCK were purchased from Calbiochem, Pan-tor inhibitor, Blebbistatin and MLCK and ROCK inhibitor from Sigma Aldrich, and Gö6976 was purchased from Tocris. siRNAs were purchased as a set of four from Qiagen for Myosin IIA (GS17886), Myosin IIB (GS77579), PKCα (GS18750) and PLCγ1 (GS18803).
Cell culture, viral transduction and plasmid/siRNA transfections
Cells were cultured in DMEM supplemented with 10% FBS (HyClone), 100 U/mL penicillin, 100 μg/ml streptomycin and 292 μg/mL L-glutamine. Transient transfections were performed using FuGene 6 (Roche) for HEK293 FT cells and NanoJuice (EMD Millipore) for fibroblast cell lines. Retroviral packaging, infections, and fluorescence-activated cell sorting were as described (Bear et al., 2000). Lentivirus production and infection were as described (Cai et al., 2008). K-Ras;LKB1-/- cells, B-Raf;Pten-/- cells and PLCγ1-/-, PLCγ1 rescue cells were kind gifts from Sharpless lab (UNC-CH), Kim lab (UNC-CH), and Sondek lab (UNC-CH). Tagged tandem C1 domains from PKCγ, (C1)2-GFP, was transiently transfected into IA32 fibroblasts using NanoJuice reagent. The cells were sorted using a Biorad S3 sorter 18 h post-transfection. The sorted cells were immediately loaded into the chemotaxis chamber for cell migration assays. siRNA for each gene was purchased as a FlexiTube Gene Solution set from Qiagen and reconstituted following manufacturer's instructions in nuclease-free water. IA32 fibroblasts were transfected at 50% confluency using 25-50pmol of siRNA and RNAiMAX transfection reagent (Life Technologies) following the manufacturer's protocol. Knockdown was analyzed by blotting and/or immunofluorescence 48-96 hours post-transfection.
Generation of Arpc2-/- fibroblasts
Homozygous mice carrying a floxed Arpc2 allele were maintained in an Ink4a/Arf null genetic background. All mice were maintained in IACUC approved housing and had free access to standard food and water. Euthanization of mice and harvesting of tissue was also carried out under IACUC approved protocols. Adult mice were sacrificed and tails were harvested for isolation of tissue fibroblasts. The superficial dermis was peeled away and remaining tail was minced into small pieces, which were placed directly onto gelatin-coated plates and incubated in DMEM supplemented with 10% FBS, 1% Pen/Strep, and 1% Glutamax. After five days, tail chunks were removed and bulk fibroblast cultures were expanded according to normal fibroblast culture conditions. These cells were then stably transduced with a CreER-expressing retrovirus (made with Addgene plasmid 22776) and subjected to puromycin selection. Bulk populations of puro-resistant adult tail fibroblasts were sorted as single cells into each well of a 96 well plate. Clones were continuously cultured and expanded to 10 cm dishes. Clonal lines were tested for responsiveness to tamoxifen by treatment of a subset of cells with 2 uM 4-hydroxytamoxifen (4-OHT) to stimulate CreER activity on days one and three of culture. On day five, treated (KO) cells and untreated (WT, pre-Cre) control cells were expanded and cultured side by side. At this point they were analyzed for loss of p34 (encoded by the Arpc2 gene) via western blotting and immunofluorescence, and tested for chemotaxis. A more complete characterization of these cells will be reported separately.
Microfludic device preparation
The pattern for the chemotaxis chamber was fabricated on 4″ silicon wafers using a two-step photolithography process. The first step involved spin coating a 5 micron tall layer of SU-8 (25) from microposit and transfer of the microcapillaries to the wafer. After developing the first layer a second 100 micron tall layer of SU-8 (100) was applied to the same wafer and after alignment the channels were transferred to the wafer. After developing and post-baking, the silicon wafer was exposed to silane overnight. Polymethylsiloxane (PDMS) was poured on the wafer and cured overnight in a 70° C oven. Individual PDMS devices were cut out from the wafer and placed in a clean dish until use. The sharp ends of 20 gauge needles were cut off and then smoothed using a Dremel tool. The needles were then used to punch out ports in the devices. The devices were then washed with water and ethanol, blow-dried and exposed to air plasma for 2 mins in a plasma cleaner (Harrick plasma). Glass bottom culture dishes (MatTek) or Delta T dishes (Bioptechs) dishes were cleaned using water and ethanol and then exposed to plasma for 2 mins. The PDMS device was placed in contact with glass dish immediately following plasma treatment of both pieces, ensuring that an irreversible seal was formed. The cell culture chamber was then filled with 10 μg/mL FN for 15mins at 37° C, followed by flushing with sterile PBS. Cells were loaded into the cell culture chamber using a gel loading pipette tip. The cell chamber ports were plugged with short pieces of tubing (Upchurch Scientific, .0025″ × 1/32″) before gradient formation.
Chemotactic gradients
The exit ports of the sink and source channels were connected to waste using tubing of ID 0.015″. Gas tight 100 μL Hamilton glass syringes (81020,1710TLL 100ul SYR) were connected to 27 1/2 gauge needles connected to tubing. The source syringe and tubing were filled with DMEM containing indicated chemoattractant/pharmacological drug and 0.01 μg/mL of TRITC/Cy5-dextran to visualize the gradient. The sink syringe and tubing were filled with DMEM. The tubing was then inserted into the source and sink channels respectively, and the syringe pump was operated at a flow rate of 20 nL/min. A stable gradient was then established in the cell culture chamber within 30 min, and typically remained stable for almost 24 hr as monitored by dextran fluorescence intensity.
Immunofluorescence
For immunofluorescent staining, the cells were fixed, stained and mounted as described previously (Bear et al., 2002). Cells were plated on acid-washed coverslips coated with 10 μg/mL FN overnight before fixing with 4% PFA and permeabilized in 0.1% Triton X-100 in PBS for 5 mins. Cells were then blocked for 15 mins in PBS containing 5% normal goat serum (Jackson Laboratories) and 5% fatty-acid-free BSA. Primary antibodies were applied to cells in PBS containing 1% BSA for 1 hr at room temperature. Cells were stained in various combinations with AlexaFluor-647 phalloidin for F-actin (1:200 dilution), Myosin-RLC (MLC-20; 1:250 dilution) or Vinculin (1:250 dilution) antibodies. After washing the cells three times in PBS, fluorescent dye conjugated secondary antibodies were diluted to 1:250 in 1% BSA in PBS and applied to the coverslips for 1 hr. After three washes in PBS, the coverslips were mounted onto slides with Fluoromount G (Electron Microscopy Sciences). Images were captured using a FluoView scanning confocal inverted microscope (FV1000, Olympus) equipped with a 40× objective, a Hamamatsu PMT and controlled by Fluoview software. Maximum intensity projection was determined with ImageJ from a z-stack.
TIRF microscopy
The microfluidic chamber system is fully integrated with live-cell TIRF microscopy imaging. A 60× TIRF objective was used to image the translocation of (C1)2-GFP or localization of the RLC-GFP constructs during chemotaxis. The cells were imaged at 2-minute intervals for 5-10 hours.
Analysis of the DAG pattern
A mask of the cell is created via threshholding and removing small isolated groups of pixels (Fig S5E(1)). A mask of the cell periphery is created from the whole cell mask by erosion of edges and subtracting the resulting image from the cell mask (Fig. S5E(2)). Locally enriched signaling regions are determined in the periphery mask (2) by segmenting contiguous regions (at least 15 pixels) with intensity values that exceed a set number (1.2) of standard deviations above the mean intensity of the periphery mask (Fig. S5E(3)). Any pixels completely enclosed by enriched pixels are also included (outlined in magenta). In a method similar to one described previously (Welf et al., 2012), the intensity values of the segmented pixels are summed within angular bins relative to the cell centroid in each image. This is done for each time point to create a signaling “map” (Fig. S5E(4)) with the angle plotted on the horizontal axis and time on the vertical axis. To quantify the overall signaling pattern for each cell, the values in each angular bin is averaged over all time points and then normalized such that the mean across all bins is equal to 1. These normalized patterns are then averaged over all the cells for each condition to produce an aggregate plot. The linear (unbinned) plots are smoothed by local regression using weighted linear least squares and a first-degree polynomial mode. The cumulative DAG signal is then presented as a histogram with a bin size of 10 degrees for chemotaxing cells (n = 12 cells) and randomly migrating (n = 13 cells)(Fig. 5E, 5F). A similar approach was used to analyze the distribution of pSer19 of RLC in chemotaxing cells.
Analysis of Myosin II organization
As in the analysis of DAG, masks of the cell and cell periphery are created. Due to the obscured visibility and discontinuity of the cell outline in cells expressing RLC-GFP constructs, a convex hull around the original cell mask is used to calculate the cell centroid as well as to exploit the fact that stress fibers reside almost exclusively in concave regions. Using two-dimensional median filtering (Fig. S6B(1)), puncta (Fig. S6B(2)) and stress fibers in the outer ring of the convex hull mask are segmented. A larger geometry and lower threshold is used for segmenting stress fibers due to their larger size (Fig. S6B(3)). Median-filtered objects are organized by size, objects of only a few pixels are removed, and large objects with high aspect ratios are identified as stress fibers (any other large objects are removed). If a stress fiber is identified in one frame, median-segmented regions that overlap with it in the next frame are also considered stress fibers if they have a high aspect ratio. This aids in the detection of stress fibers that might not be fully segmented by the median filter in every frame. Each of the pixels associated with puncta is assigned to an angular bin with respect to the cell centroid (1 count per pixel); any bin containing both puncta and stress fibers are counted as stress fibers. To correct for discontinuous stress fibers missed between frames, any angular bin marked as containing stress fibers more than half the time during a 15-frame interval is marked as a stress fiber for the entire interval. After this procedure, each angular bin is classified as puncta, stress fiber, or neither. To plot the distribution of puncta, stress fiber bins are set to zero, and vice-versa for the stress fiber distribution. The plots are generated in the same manner as described above for the DAG pattern. The data for the wild-type RLC-GFP-expressing cells in the PDGF gradient are shifted by the median angle of migration (not including angles more than 90° from the direction of the PDGF gradient), resulting in a 25-degree shift to the right. During migration in response to a BLB gradient, very few stress fibers were visible under TIRF imaging. Analysis was therefore performed in the same manner as for the DAG pattern to quantify RLC-GFP regions at the cell periphery.
Supplementary Material
Sup. Fig.1 (relating to main Fig. 1)
A. Schematic diagram showing FMI and persistence (D/T) calculation of a cell during chemotaxis.
B. Western blot analysis to determine phosphorylation levels of Akt in fibroblasts stimulated with PDGF for the indicated time and in the presence of PI3K inhibitor.
C. Western blot analysis to determine phosphorylation levels of S6K1 in fibroblasts stimulated with PDGF and in the presence of pan-Tor inhibitor.
D. Immunofluorescence of K-Ras/Lkb1 null (Melanoma 1) and B-Raf/Pten null (Melanoma 2) tumor cell lines shows the presence of green actin stress fibers (phalloidin) and red focal adhesions (vinculin).
Sup. Fig. 2 (relating to main Fig. 2)
A. Western blots show levels of knockdown of Myosin IIA and Myosin IIB using two different siRNAs for each myosin isoform.
B. Wind-rose plots confirm chemotactic response of Myosin IIA KD and Myosin IIB KD cells using alternate siRNAs.
Sup. Fig. 3 (relating to main Fig. 3)
A. Western blot analysis to probe the extent of Ser19 phosphorylation of Myosin II RLC, shows no change in response to EGF stimulation.
B. Example of Immunofluorescence of a chemotaxing cells stained with p-MLC (Ser-19) color coded with intensity of signal.
C. Histogram showing the cumulative intracellular distribution of p-MLC (Ser-19) in n=11 chemotaxing cells where the x-axis corresponds to the angular direction with respect to the cell centroid. Zero degrees corresponds to direction of gradient.
Sup. Fig. 4 (relating to main Fig. 4)
A. Western blots indicate levels of PKCα knockdown using multiple siRNAs.
B. Wind-rose plots confirming lack of chemotaxis of PKCα KD cells using an alternate siRNA.
C. Chemo-repulsion of wild-type cells to gradients of LY333531, an alternate conventional PKC inhibitor (n=46).
D. PKCα knockdown cells show no chemo-repulsive response to gradient of Gö6967 (n=56).
Sup. Fig. 5 (relating to main Fig. 5)
A. Western blots showing PLCγ1 content in knockdown cells, PLCγ1-/- cells and the rescue cells.
B. Wind-rose plots of directional migration of control cells and PLCγ1 KD cells with alternate siRNA.
C. Circular histograms of cells migrating in a PDGF gradient in the presence of 10μm (n=61) and 100μm Gadolinium Chloride (n=88).
D. TIRF micrographs of (C1)2-GFP expressing, PLCγ1 KD cells simulated with PDGF and PMA. Graph shows average intensity of (C1)2-GFP recruited to the membrane after PDGF and PMA stimulation (n=15 cells).
E. Method of analysis of the localization of DAG intensity in cells transfected with (C1)2-GFP.
Sup. Fig. 6 (relating to main Fig. 7)
A. Image of a chemotaxing MLC-GFP cell. Magnified sections show myosin organization with puncta in the blue box and stress fibers in the red box.
B. A two-dimensional median filtering (1) is used to segment, puncta (2) and stress fibers (3) in the outer ring of the convex hull mask. Puncta are marked as blue and Stress fibers as red in the final segmentation (4).
C. Immunofluorescence of MyoRLC(S1AS2A) cells shows myosin light chain (GFP) and F-actin (Phalloidin) in cells before and after uniform BLB treatment.
D. The intensity values of the enriched segmented pixels in MyoRLC-GFP and MyoRLC(S1AS2A)-GFP cells chemotaxing to BLB gradient are summed within angular bins at each time point to create a signaling “map” with the angle plotted on the horizontal axis and time on the vertical axis.
Sup. Movie 1 (relating to main Fig. 1): Fibroblast cells migrating toward higher concentration of PDGF. Tracks generated during manual tracking are overlaid to show direction of migration. Images captured with 20× objective every 10 min for 6hrs.
Sup. Movie 2 (relating to main Fig. 1): Migration tracks of cells from Sup. Movie 1 are shown originating from a common center.
Sup. Movie 3 (relating to main Fig. 2): Fibroblasts in the presence of 15μm blebbistatin do not respond to PDGF gradient and migrate randomly. Gradient is marked my fluorescent dextran (red channel). Images captured 20× objective every 10 min for 12 hr.
Sup. Movie 4 (relating to main Fig. 5): Chemotaxing cell expressing GFP-tagged fragment of PKC containing tandem C1 domains as a translocation biosensor for DAG. The cell is color coded to show intensity difference in DAG localization, with high localization at the leading edge. Images were captured with a 60× TIRF objective every 2 min for 6 hr.
Sup. Movie 5 (relating to main Fig. 7): Fibroblasts expressing wild type RLC-GFP (left) and mutant S1AS2A-RLC-GFP (right) in PDGF gradients. In chemotaxing wild type cells, at the leading edge, a soluble pool of Myosin II accumulates into puncta or spots. Further away from the edge, puncta coalesce into bundled fiber-like structures consistent with localization to stress fibers. Mutants in a PDGF gradient show even distribution of puncta and stress fibers around the perimeter of the cell. Images were captured with a 60× objective every 2 min for 6 hr.
Sup. Movie 6 (relating to main Fig. 7): Fibroblasts expressing the wild-type RLC-GFP (left) and mutant S1AS2A-RLC-GFP (right) chemotaxing to a blebbistatin gradient. At the leading edge, a soluble pool of Myosin II accumulates into puncta. Stress fibers were mostly absent in the TIRF field of view in the blebbistatin gradient. Images were captured with a 60× objective every 2 min for 6 hr.
Acknowledgments
We gratefully acknowledge support from HHMI, NIH grants to JEB (GM083035, GM110155), JMH (GM088987, GM110155); NSF grant to JMH (1133476), the UNC-Olympus Imaging Research Center, members of the Bear lab for critical discussions, Keefe Chan and Hailey Brighton for sharing the melanoma cell lines and Liz Haynes for graphical advice.
Footnotes
Publisher's Disclaimer: This is a PDF file of an unedited manuscript that has been accepted for publication. As a service to our customers we are providing this early version of the manuscript. The manuscript will undergo copyediting, typesetting, and review of the resulting proof before it is published in its final citable form. Please note that during the production process errors may be discovered which could affect the content, and all legal disclaimers that apply to the journal pertain.
Literature Cited
- Andrae J, Gallini R, Betsholtz C. Role of platelet-derived growth factors in physiology and medicine. Genes Dev. 2008;22:1276–1312. doi: 10.1101/gad.1653708. [DOI] [PMC free article] [PubMed] [Google Scholar]
- Beach JR, Licate LS, Crish JF, Egelhoff TT. Analysis of the role of Ser1/Ser2/Thr9 phosphorylation on myosin II assembly and function in live cells. BMC Cell Biol. 2011;12:52. doi: 10.1186/1471-2121-12-52. [DOI] [PMC free article] [PubMed] [Google Scholar]
- Bear J, Loureiro J, Libova I, Fassler R, Wehland J, Gertler F. Negative regulation of fibroblast motility by Ena/VASP proteins. Cell. 2000;101:717–728. doi: 10.1016/s0092-8674(00)80884-3. [DOI] [PubMed] [Google Scholar]
- Bear JE, Haugh JM. Directed migration of mesenchymal cells: where signaling and the cytoskeleton meet. Curr Opin Cell Biol. 2014;30C:74–82. doi: 10.1016/j.ceb.2014.06.005. [DOI] [PMC free article] [PubMed] [Google Scholar]
- Bear JE, Svitkina TM, Krause M, Schafer DA, Loureiro JJ, Strasser GA, Maly IV, Chaga OY, Cooper JA, Borisy GG, et al. Antagonism between Ena/VASP Proteins and Actin Filament Capping Regulates Fibroblast Motility. Cell. 2002;109:509–521. doi: 10.1016/s0092-8674(02)00731-6. [DOI] [PubMed] [Google Scholar]
- Bengur AR, Robinson EA, Appella E, Sellers JR. Sequence of the sites phosphorylated by protein kinase C in the smooth muscle myosin light chain. J Biol Chem. 1987;262:7613–7617. [PubMed] [Google Scholar]
- Bosgraaf L, Keizer-Gunnink I, Van Haastert PJ. PI3-kinase signaling contributes to orientation in shallow gradients and enhances speed in steep chemoattractant gradients. J Cell Sci. 2008;121:3589–3597. doi: 10.1242/jcs.031781. [DOI] [PubMed] [Google Scholar]
- Boyden S. The chemotactic effect of mixtures of antibody and antigen on polymorphonuclear leucocytes. J Exp Med. 1962;115:453–466. doi: 10.1084/jem.115.3.453. [DOI] [PMC free article] [PubMed] [Google Scholar]
- Cai L, Makhov AM, Schafer DA, Bear JE. Coronin 1B antagonizes cortactin and remodels Arp2/3-containing actin branches in lamellipodia. Cell. 2008;134:828–842. doi: 10.1016/j.cell.2008.06.054. [DOI] [PMC free article] [PubMed] [Google Scholar]
- Dormann D, Weijer CJ. Chemotactic cell movement during Dictyostelium development and gastrulation. Curr Opin Genet Dev. 2006;16:367–373. doi: 10.1016/j.gde.2006.06.003. [DOI] [PubMed] [Google Scholar]
- Even-Ram S, Doyle AD, Conti MA, Matsumoto K, Adelstein RS, Yamada KM. Myosin IIA regulates cell motility and actomyosin-microtubule crosstalk. Nat Cell Biol. 2007;9:299–309. doi: 10.1038/ncb1540. [DOI] [PubMed] [Google Scholar]
- Gafni J, Munsch JA, Lam TH, Catlin MC, Costa LG, Molinski TF, Pessah IN. Xestospongins: potent membrane permeable blockers of the inositol 1,4,5-trisphosphate receptor. Neuron. 1997;19:723–733. doi: 10.1016/s0896-6273(00)80384-0. [DOI] [PubMed] [Google Scholar]
- Hanna SC, Krishnan B, Bailey ST, Moschos SJ, Kuan PF, Shimamura T, Osborne LD, Siegel MB, Duncan LM, O'Brien ET, 3rd, et al. HIF1alpha and HIF2alpha independently activate SRC to promote melanoma metastases. J Clin Invest. 2013;123:2078–2093. doi: 10.1172/JCI66715. [DOI] [PMC free article] [PubMed] [Google Scholar]
- Hess JA, Ji QS, Carpenter G, Exton JH. Analysis of platelet-derived growth factor-induced phospholipase D activation in mouse embryo fibroblasts lacking phospholipase C-gamma1. J Biol Chem. 1998;273:20517–20524. doi: 10.1074/jbc.273.32.20517. [DOI] [PubMed] [Google Scholar]
- Iglesias PA, Devreotes PN. Biased excitable networks: how cells direct motion in response to gradients. Curr Opin Cell Biol. 2012;24:245–253. doi: 10.1016/j.ceb.2011.11.009. [DOI] [PMC free article] [PubMed] [Google Scholar]
- Ikebe M, Hartshorne DJ, Elzinga M. Phosphorylation of the 20,000-dalton light chain of smooth muscle myosin by the calcium-activated, phospholipid-dependent protein kinase. Phosphorylation sites and effects of phosphorylation. J Biol Chem. 1987;262:9569–9573. [PubMed] [Google Scholar]
- Jilkine A, Edelstein-Keshet L. A comparison of mathematical models for polarization of single eukaryotic cells in response to guided cues. PLoS Comput Biol. 2011;7:e1001121. doi: 10.1371/journal.pcbi.1001121. [DOI] [PMC free article] [PubMed] [Google Scholar]
- Kawamoto S, Bengur AR, Sellers JR, Adelstein RS. In situ phosphorylation of human platelet myosin heavy and light chains by protein kinase C. J Biol Chem. 1989;264:2258–2265. [PubMed] [Google Scholar]
- Komatsu S, Ikebe M. The phosphorylation of myosin II at the Ser1 and Ser2 is critical for normal platelet-derived growth factor induced reorganization of myosin filaments. Mol Biol Cell. 2007;18:5081–5090. doi: 10.1091/mbc.E06-12-1076. [DOI] [PMC free article] [PubMed] [Google Scholar]
- Kovalenko M, Ronnstrand L, Heldin CH, Loubtchenkov M, Gazit A, Levitzki A, Bohmer FD. Phosphorylation site-specific inhibition of platelet-derived growth factor beta-receptor autophosphorylation by the receptor blocking tyrphostin AG1296. Biochemistry. 1997;36:6260–6269. doi: 10.1021/bi962553l. [DOI] [PubMed] [Google Scholar]
- Li Jeon N, Baskaran H, Dertinger SK, Whitesides GM, Van de Water L, Toner M. Neutrophil chemotaxis in linear and complex gradients of interleukin-8 formed in a microfabricated device. Nat Biotechnol. 2002;20:826–830. doi: 10.1038/nbt712. [DOI] [PubMed] [Google Scholar]
- Liu W, Monahan KB, Pfefferle AD, Shimamura T, Sorrentino J, Chan KT, Roadcap DW, Ollila DW, Thomas NE, Castrillon DH, et al. LKB1/STK11 inactivation leads to expansion of a prometastatic tumor subpopulation in melanoma. Cancer Cell. 2012;21:751–764. doi: 10.1016/j.ccr.2012.03.048. [DOI] [PMC free article] [PubMed] [Google Scholar]
- Liu X, Kapoor TM, Chen JK, Huse M. Diacylglycerol promotes centrosome polarization in T cells via reciprocal localization of dynein and myosin II. Proc Natl Acad Sci U S A. 2013;110:11976–11981. doi: 10.1073/pnas.1306180110. [DOI] [PMC free article] [PubMed] [Google Scholar]
- Martiny-Baron G, Kazanietz MG, Mischak H, Blumberg PM, Kochs G, Hug H, Marme D, Schachtele C. Selective inhibition of protein kinase C isozymes by the indolocarbazole Go 6976. J Biol Chem. 1993;268:9194–9197. [PubMed] [Google Scholar]
- Melvin AT, Welf ES, Wang Y, Irvine DJ, Haugh JM. In chemotaxing fibroblasts, both high-fidelity and weakly biased cell movements track the localization of PI3K signaling. Biophysical journal. 2011;100:1893–1901. doi: 10.1016/j.bpj.2011.02.047. [DOI] [PMC free article] [PubMed] [Google Scholar]
- Monypenny J, Zicha D, Higashida C, Oceguera-Yanez F, Narumiya S, Watanabe N. Cdc42 and Rac family GTPases regulate mode and speed but not direction of primary fibroblast migration during platelet-derived growth factor-dependent chemotaxis. Molecular and cellular biology. 2009;29:2730–2747. doi: 10.1128/MCB.01285-08. [DOI] [PMC free article] [PubMed] [Google Scholar]
- Mouneimne G, DesMarais V, Sidani M, Scemes E, Wang W, Song X, Eddy R, Condeelis J. Spatial and temporal control of cofilin activity is required for directional sensing during chemotaxis. Curr Biol. 2006;16:2193–2205. doi: 10.1016/j.cub.2006.09.016. [DOI] [PubMed] [Google Scholar]
- Nishikawa M, Sellers JR, Adelstein RS, Hidaka H. Protein kinase C modulates in vitro phosphorylation of the smooth muscle heavy meromyosin by myosin light chain kinase. J Biol Chem. 1984;259:8808–8814. [PubMed] [Google Scholar]
- Oancea E, Teruel MN, Quest AF, Meyer T. Green fluorescent protein (GFP)-tagged cysteine-rich domains from protein kinase C as fluorescent indicators for diacylglycerol signaling in living cells. J Cell Biol. 1998;140:485–498. doi: 10.1083/jcb.140.3.485. [DOI] [PMC free article] [PubMed] [Google Scholar]
- Parent CA, Devreotes PN. A cell's sense of direction. Science. 1999;284:765–770. doi: 10.1126/science.284.5415.765. [DOI] [PubMed] [Google Scholar]
- Park H, Ishihara D, Cox D. Regulation of tyrosine phosphorylation in macrophage phagocytosis and chemotaxis. Arch Biochem Biophys. 2011;510:101–111. doi: 10.1016/j.abb.2011.02.019. [DOI] [PMC free article] [PubMed] [Google Scholar]
- Rotty JD, Wu C, Bear JE. New insights into the regulation and cellular functions of the ARP2/3 complex. Nat Rev Mol Cell Biol. 2013;14:7–12. doi: 10.1038/nrm3492. [DOI] [PubMed] [Google Scholar]
- Shamloo A, Ma N, Poo MM, Sohn LL, Heilshorn SC. Endothelial cell polarization and chemotaxis in a microfluidic device. Lab Chip. 2008;8:1292–1299. doi: 10.1039/b719788h. [DOI] [PubMed] [Google Scholar]
- Sourjik V, Wingreen NS. Responding to chemical gradients: bacterial chemotaxis. Curr Opin Cell Biol. 2012;24:262–268. doi: 10.1016/j.ceb.2011.11.008. [DOI] [PMC free article] [PubMed] [Google Scholar]
- Straight AF, Cheung A, Limouze J, Chen I, Westwood NJ, Sellers JR, Mitchison TJ. Dissecting temporal and spatial control of cytokinesis with a myosin II Inhibitor. Science. 2003;299:1743–1747. doi: 10.1126/science.1081412. [DOI] [PubMed] [Google Scholar]
- Svitkina TM, Verkhovsky AB, McQuade KM, Borisy GG. Analysis of the actin-myosin II system in fish epidermal keratocytes: mechanism of cell body translocation. J Cell Biol. 1997;139:397–415. doi: 10.1083/jcb.139.2.397. [DOI] [PMC free article] [PubMed] [Google Scholar]
- Swaney KF, Huang CH, Devreotes PN. Eukaryotic chemotaxis: a network of signaling pathways controls motility, directional sensing, and polarity. Annu Rev Biophys. 2010;39:265–289. doi: 10.1146/annurev.biophys.093008.131228. [DOI] [PMC free article] [PubMed] [Google Scholar]
- Tanimura A, Nezu A, Morita T, Hashimoto N, Tojyo Y. Interplay between calcium, diacylglycerol, and phosphorylation in the spatial and temporal regulation of PKCalpha-GFP. J Biol Chem. 2002;277:29054–29062. doi: 10.1074/jbc.M201130200. [DOI] [PubMed] [Google Scholar]
- Tsai FC, Meyer T. Ca2+ pulses control local cycles of lamellipodia retraction and adhesion along the front of migrating cells. Curr Biol. 2012;22:837–842. doi: 10.1016/j.cub.2012.03.037. [DOI] [PMC free article] [PubMed] [Google Scholar]
- Tsai FC, Seki A, Yang HW, Hayer A, Carrasco S, Malmersjo S, Meyer T. A polarized Ca2+, diacylglycerol and STIM1 signalling system regulates directed cell migration. Nat Cell Biol. 2014;16:133–144. doi: 10.1038/ncb2906. [DOI] [PMC free article] [PubMed] [Google Scholar]
- Varlamova O, Spektor A, Bresnick AR. Protein kinase C mediates phosphorylation of the regulatory light chain of myosin-II during mitosis. J Muscle Res Cell Motil. 2001;22:243–250. doi: 10.1023/a:1012289905754. [DOI] [PubMed] [Google Scholar]
- Vicente-Manzanares M, Koach MA, Whitmore L, Lamers ML, Horwitz AF. Segregation and activation of myosin IIB creates a rear in migrating cells. J Cell Biol. 2008;183:543–554. doi: 10.1083/jcb.200806030. [DOI] [PMC free article] [PubMed] [Google Scholar]
- Vicente-Manzanares M, Ma X, Adelstein RS, Horwitz AR. Non-muscle myosin II takes centre stage in cell adhesion and migration. Nature Reviews Molecular Cell Biology. 2009;10:778–790. doi: 10.1038/nrm2786. [DOI] [PMC free article] [PubMed] [Google Scholar]
- Wadhams GH, Armitage JP. Making sense of it all: bacterial chemotaxis. Nat Rev Mol Cell Biol. 2004;5:1024–1037. doi: 10.1038/nrm1524. [DOI] [PubMed] [Google Scholar]
- Webb SE, Pollard JW, Jones GE. Direct observation and quantification of macrophage chemoattraction to the growth factor CSF-1. J Cell Sci. 1996;109:793–803. doi: 10.1242/jcs.109.4.793. [DOI] [PubMed] [Google Scholar]
- Wei C, Wang X, Chen M, Ouyang K, Song LS, Cheng H. Calcium flickers steer cell migration. Nature. 2009;457:901–905. doi: 10.1038/nature07577. [DOI] [PMC free article] [PubMed] [Google Scholar]
- Weiner OD. Regulation of cell polarity during eukaryotic chemotaxis: the chemotactic compass. Curr Opin Cell Biol. 2002;14:196–202. doi: 10.1016/s0955-0674(02)00310-1. [DOI] [PMC free article] [PubMed] [Google Scholar]
- Welf ES, Ahmed S, Johnson HE, Melvin AT, Haugh JM. Migrating fibroblasts reorient directionality by a metastable, PI3K-dependent mechanism. J Cell Biol. 2012;197:105–114. doi: 10.1083/jcb.201108152. [DOI] [PMC free article] [PubMed] [Google Scholar]
- Wilson CA, Tsuchida MA, Allen GM, Barnhart EL, Applegate KT, Yam PT, Ji L, Keren K, Danuser G, Theriot JA. Myosin II contributes to cell-scale actin network treadmilling through network disassembly. Nature. 2010;465:373–377. doi: 10.1038/nature08994. [DOI] [PMC free article] [PubMed] [Google Scholar]
- Wu C, Asokan SB, Berginski ME, Haynes EM, Sharpless NE, Griffith JD, Gomez SM, Bear JE. Arp2/3 is critical for lamellipodia and response to extracellular matrix cues but is dispensable for chemotaxis. Cell. 2012;148:973–987. doi: 10.1016/j.cell.2011.12.034. [DOI] [PMC free article] [PubMed] [Google Scholar]
- Wu C, Haynes EM, Asokan SB, Simon JM, Sharpless NE, Baldwin AS, Davis IJ, Johnson GL, Bear JE. Loss of Arp2/3 induces an NF-kappaB-dependent, nonautonomous effect on chemotactic signaling. J Cell Biol. 2013;203:907–916. doi: 10.1083/jcb.201306032. [DOI] [PMC free article] [PubMed] [Google Scholar]
- Wu-Zhang AX, Newton AC. Protein kinase C pharmacology: refining the toolbox. Biochem J. 2013;452:195–209. doi: 10.1042/BJ20130220. [DOI] [PMC free article] [PubMed] [Google Scholar]
- Yang XC, Sachs F. Block of stretch-activated ion channels in Xenopus oocytes by gadolinium and calcium ions. Science. 1989;243:1068–1071. doi: 10.1126/science.2466333. [DOI] [PubMed] [Google Scholar]
- Zicha D, Dunn GA, Brown AF. A new direct-viewing chemotaxis chamber. J Cell Sci. 1991;99:769–775. doi: 10.1242/jcs.99.4.769. [DOI] [PubMed] [Google Scholar]
- Zigmond SH. Ability of polymorphonuclear leukocytes to orient in gradients of chemotactic factors. J Cell Biol. 1977;75:606–616. doi: 10.1083/jcb.75.2.606. [DOI] [PMC free article] [PubMed] [Google Scholar]
- Zigmond SH, Hirsch JG. Leukocyte locomotion and chemotaxis. New methods for evaluation, and demonstration of a cell-derived chemotactic factor. J Exp Med. 1973;137:387–410. doi: 10.1084/jem.137.2.387. [DOI] [PMC free article] [PubMed] [Google Scholar]
Associated Data
This section collects any data citations, data availability statements, or supplementary materials included in this article.
Supplementary Materials
Sup. Fig.1 (relating to main Fig. 1)
A. Schematic diagram showing FMI and persistence (D/T) calculation of a cell during chemotaxis.
B. Western blot analysis to determine phosphorylation levels of Akt in fibroblasts stimulated with PDGF for the indicated time and in the presence of PI3K inhibitor.
C. Western blot analysis to determine phosphorylation levels of S6K1 in fibroblasts stimulated with PDGF and in the presence of pan-Tor inhibitor.
D. Immunofluorescence of K-Ras/Lkb1 null (Melanoma 1) and B-Raf/Pten null (Melanoma 2) tumor cell lines shows the presence of green actin stress fibers (phalloidin) and red focal adhesions (vinculin).
Sup. Fig. 2 (relating to main Fig. 2)
A. Western blots show levels of knockdown of Myosin IIA and Myosin IIB using two different siRNAs for each myosin isoform.
B. Wind-rose plots confirm chemotactic response of Myosin IIA KD and Myosin IIB KD cells using alternate siRNAs.
Sup. Fig. 3 (relating to main Fig. 3)
A. Western blot analysis to probe the extent of Ser19 phosphorylation of Myosin II RLC, shows no change in response to EGF stimulation.
B. Example of Immunofluorescence of a chemotaxing cells stained with p-MLC (Ser-19) color coded with intensity of signal.
C. Histogram showing the cumulative intracellular distribution of p-MLC (Ser-19) in n=11 chemotaxing cells where the x-axis corresponds to the angular direction with respect to the cell centroid. Zero degrees corresponds to direction of gradient.
Sup. Fig. 4 (relating to main Fig. 4)
A. Western blots indicate levels of PKCα knockdown using multiple siRNAs.
B. Wind-rose plots confirming lack of chemotaxis of PKCα KD cells using an alternate siRNA.
C. Chemo-repulsion of wild-type cells to gradients of LY333531, an alternate conventional PKC inhibitor (n=46).
D. PKCα knockdown cells show no chemo-repulsive response to gradient of Gö6967 (n=56).
Sup. Fig. 5 (relating to main Fig. 5)
A. Western blots showing PLCγ1 content in knockdown cells, PLCγ1-/- cells and the rescue cells.
B. Wind-rose plots of directional migration of control cells and PLCγ1 KD cells with alternate siRNA.
C. Circular histograms of cells migrating in a PDGF gradient in the presence of 10μm (n=61) and 100μm Gadolinium Chloride (n=88).
D. TIRF micrographs of (C1)2-GFP expressing, PLCγ1 KD cells simulated with PDGF and PMA. Graph shows average intensity of (C1)2-GFP recruited to the membrane after PDGF and PMA stimulation (n=15 cells).
E. Method of analysis of the localization of DAG intensity in cells transfected with (C1)2-GFP.
Sup. Fig. 6 (relating to main Fig. 7)
A. Image of a chemotaxing MLC-GFP cell. Magnified sections show myosin organization with puncta in the blue box and stress fibers in the red box.
B. A two-dimensional median filtering (1) is used to segment, puncta (2) and stress fibers (3) in the outer ring of the convex hull mask. Puncta are marked as blue and Stress fibers as red in the final segmentation (4).
C. Immunofluorescence of MyoRLC(S1AS2A) cells shows myosin light chain (GFP) and F-actin (Phalloidin) in cells before and after uniform BLB treatment.
D. The intensity values of the enriched segmented pixels in MyoRLC-GFP and MyoRLC(S1AS2A)-GFP cells chemotaxing to BLB gradient are summed within angular bins at each time point to create a signaling “map” with the angle plotted on the horizontal axis and time on the vertical axis.
Sup. Movie 1 (relating to main Fig. 1): Fibroblast cells migrating toward higher concentration of PDGF. Tracks generated during manual tracking are overlaid to show direction of migration. Images captured with 20× objective every 10 min for 6hrs.
Sup. Movie 2 (relating to main Fig. 1): Migration tracks of cells from Sup. Movie 1 are shown originating from a common center.
Sup. Movie 3 (relating to main Fig. 2): Fibroblasts in the presence of 15μm blebbistatin do not respond to PDGF gradient and migrate randomly. Gradient is marked my fluorescent dextran (red channel). Images captured 20× objective every 10 min for 12 hr.
Sup. Movie 4 (relating to main Fig. 5): Chemotaxing cell expressing GFP-tagged fragment of PKC containing tandem C1 domains as a translocation biosensor for DAG. The cell is color coded to show intensity difference in DAG localization, with high localization at the leading edge. Images were captured with a 60× TIRF objective every 2 min for 6 hr.
Sup. Movie 5 (relating to main Fig. 7): Fibroblasts expressing wild type RLC-GFP (left) and mutant S1AS2A-RLC-GFP (right) in PDGF gradients. In chemotaxing wild type cells, at the leading edge, a soluble pool of Myosin II accumulates into puncta or spots. Further away from the edge, puncta coalesce into bundled fiber-like structures consistent with localization to stress fibers. Mutants in a PDGF gradient show even distribution of puncta and stress fibers around the perimeter of the cell. Images were captured with a 60× objective every 2 min for 6 hr.
Sup. Movie 6 (relating to main Fig. 7): Fibroblasts expressing the wild-type RLC-GFP (left) and mutant S1AS2A-RLC-GFP (right) chemotaxing to a blebbistatin gradient. At the leading edge, a soluble pool of Myosin II accumulates into puncta. Stress fibers were mostly absent in the TIRF field of view in the blebbistatin gradient. Images were captured with a 60× objective every 2 min for 6 hr.