

Abstract
Objective
Direct costs for children who had stroke are similar to those for adults. There is no information regarding the out-of-pocket costs families encounter. We described the out-of-pocket costs families encountered in the first year after a child’s ischemic stroke.
Methods
22 subjects were prospectively recruited at four centers in the US and Canada in 2008 and 2009 as part of the “Validation of the Pediatric NIH Stroke Scale” study; families’ indirect costs were tracked for one year. Every three months, parents reported hours they did not work, non-reimbursed costs for medical visits or other health care, and mileage. They provided estimates of annual income. We calculated total out-of-pocket costs in US dollars and reported costs as a proportion of annual income.
Results
Total median out-of-pocket cost for the year following an ischemic stroke was $4354 (range 0–$28,666; interquartile range $1,008–$8,245). Out-of-pocket costs were greatest in the first three months after the incident stroke, with the largest proportion due to lost wages, followed by transportation and non-reimbursed healthcare. For the entire year median costs represented 6.8% (range 0–81.9%; interquartile range 2.7–17.2%) of annual income.
Conclusions
Out-of-pocket expenses are significant following a child’s ischemic stroke. The median costs are noteworthy given that the median American household had cash savings of $3,860 at the time of the study. These results with previous reports of direct costs give a more complete view of the overall costs to families and society. Childhood stroke creates an under-recognized cost to society because of decreased parental productivity.
Keywords: Pediatric stroke, childhood ischemic stroke, indirect cost, out-of-pocket cost
Introduction
Childhood stroke can result in long term medical needs, with parents and third-party payers paying for these long-term needs. A small number of studies have examined the acute and chronic cost of pediatric stroke care, but those studies focused on the direct costs for medical care.1;2 Far more difficult to capture are the out-of-pocket costs that include parents’ lost wages, cost of travel to medical facilities, and payments for medical and home care that are not reimbursed. These out-of-pocket costs are not routinely tracked by any agency, so this type of information is difficult to gather. Previous studies of childhood stroke did not attempt to estimate this information. However, determining the out-of-pocket costs of pediatric stroke will lead to a more comprehensive understanding of the overall cost of stroke, both in its impact upon the family and upon society as a whole.
A number of studies have estimated indirect costs of adult stroke;3–7 these studies typically focused upon indirect cost as the wages lost by the patient from disability. For pediatric stroke, lost wages of children is not a meaningful concept, but the lost wages of the parents are meaningful. The cost of patient care after hospital admission for the incident stroke has been examined in a small number of adult ischemic stroke studies,8;9 and the types of costs measured in these studies are pertinent to pediatric stroke. Direct and out-of-pocket costs have been examined for pediatric illness including rotavirus gastroenteritis, general pediatric illnesses, arthritis, and cancer,10–13 but no study has examined out-of-pocket costs in pediatric stroke. Our objective was to prospectively determine the out-of-pocket costs families encountered when their child experienced an acute ischemic stroke and during the following year of recovery.
Methods
The current study was ancillary to the primary study “Validation of the Pediatric NIH Stroke Scale”14 that determined the validity of a pediatric version of the NIH Stroke scale. Since the primary study followed subjects for one year after the incident stroke, there was an opportunity to prospectively follow patients in a systematic manner. All 15 centers in the primary study were invited to participate and of these, 4 centers in the US and Canada contributed patients. The 4 centers were tertiary care centers in metropolitan areas with populations ranging from 1.8 to 6.4 million. (http://www.census.gov/population/www/cen2010/cph-t/cph-t-2.html; http://www.statcan.gc.ca/pub/11-402-x/2011000/chap/pop/tbl/tbl03-eng.htm) At these sites, parents of children enrolled in 2008 and 2009 were invited to participate. Parents were interviewed with a standard questionnaire 3 months after the incident stroke to gather information regarding out-of-pocket costs. The reporting would have included acute indirect costs encountered during the hospital stay as well as outpatient costs. Thereafter cost information was prospectively collected at 3 months intervals until one year after the stroke had occurred. Parents were instructed to use a worksheet to track on-going expenses and the cost information was collected by telephone interview or clinic visits. The questionnaire was modified from a study of economic costs of childhood cancer.15 The content of specific questions was adapted from the Medical Expenditure Panel Survey, operated by the US Agency for Healthcare Research and Quality (http://www.meps.ahrq.gov/mepsweb/survey_comp/survey_questionnaires.jsp), and modified for use in this study. To reduce the possibility of factitious reporting, we had parents report annual income within a defined range of values. The parents reported hours not worked, costs for home care, unreimbursed standard health care costs, transportation and lodging for visits to the stroke physician, and unreimbursed costs for healthcare that was not prescribed, i.e. alternative medical treatments. Lost wages were estimated by having the parents report the number of hours they normally worked, and a range for their annual income ($0–9,999, $10,000–24,999, $25,000–44,999, $45,000–59,999, $60,000–74,999, $75,000–99,999, $100,000–149,999, $150,000 or greater). Parents reported the number of hours they did not work so that they could attend healthcare visits or provide for their child’s healthcare.
Analysis
In this study we considered out-of-pocket and indirect costs to be equivalent. The wages lost were estimated from the parents’ report of their annual income and the hours they did not work. Parents’ annual incomes were estimated by choosing the middle of the income range they reported up to a maximum of $150,000 per year. We divided the estimated annual income by the hours normally worked, then used the parents’ report of the number of hours that they did not work while caring for their children. For simplicity of reporting costs in Canada and the US, calculated out-of-pocket costs are reported in US dollars. Expenses in Canadian dollars were converted to US dollars using the average exchange rates in 2008 through 2010. Transportation costs were either recorded as the costs reported by the families or the mileage traveled for stroke physician visits. We used US mileage rates for 2008 through 2010 (http://www.irs.gov) and Canadian mileage rates for 2009 and 2010. (http://www.cra-arc.gc.ca/tx/bsnss/tpcs/pyrll/bnfts/tmbl/llwnc/rts-eng.html). All costs were calculated as a proportion of annual income to account for regional differences in income. When data were missing we did not impute values. The range of out-of-pocket costs was expressed as actual costs and as a proportion of annual income for the year following the incident stroke.
We wanted to identify any correlation between annual income and the level of expenditure for non-reimbursed costs. We also wanted to determine whether age of onset, initial stroke severity, or the severity of neurological impairment after one year of recovery correlated with indirect cost. Spearman’s rho (two-tailed, p<0.05) was used to test correlations of out-of-pocket costs with age at stroke, the maximum acute Pediatric NIH stroke score, and the Pediatric Stroke Outcome Measure score16 1 year after the incident stroke.
This work was approved by the IRB/Ethics committees of all participating institutions.
Results
We recruited 22 out of a possible 30 participants from four centers in the United States and Canada. There were 15 males and 7 females in the group. The ethnicity as self-reported was 15 Caucasians, 3 Latinos, 2 African-Americans, 1 Asian, and 1 not stated. Two participants were Canadian. The median age at the time of stroke was 9.4 years, (range 1.9–17.9 yrs) and the median maximum Pediatric NIH stroke score at presentation was 5 (range 1–22). The median Pediatric Stroke Outcome Measure score at 1 year was 1.0 (range 0–3.5 out of a maximum severity of 10). In comparison, for the other children in the larger study who did not participate, their median Pediatric NIH stroke score was 7 (range 0–38) and their median Pediatric Stroke Outcome Measure at 1 year was 1.0 (range 0–6.5). Differences were not significant by the Mann-Whitney U test.
Indirect costs were greatest in the first three months after the incident stroke,(Figure 1 A and B) decreased for the remaining three quarters. In the first quarter the largest amount of indirect costs was due to lost wages, followed by out-of-pocket costs for transportation and non-reimbursed healthcare. (Table) Transportation remained an expense for the year, while lost wages dropped in magnitude by the second quarter. For the entire year the median indirect expense was $4,354 (mean $6,619; range 0–$28,666; interquartile range $1,008–$7,931), which represented 6.8% (range 0–81.9%; interquartile range 2.7–17.2%) of annual income. Wage earners in two families lost their jobs during the study period, which occurred during the great recession.
Figure 1.
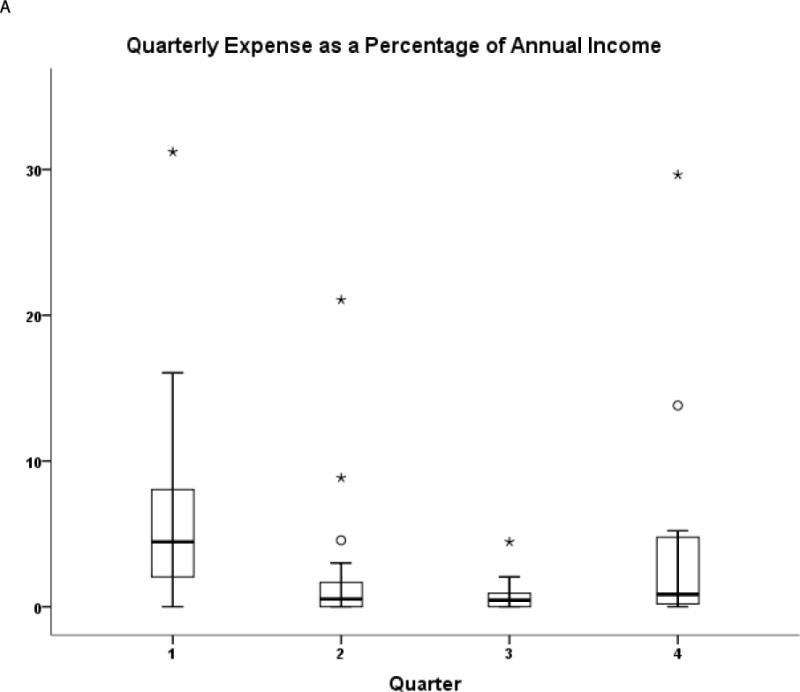
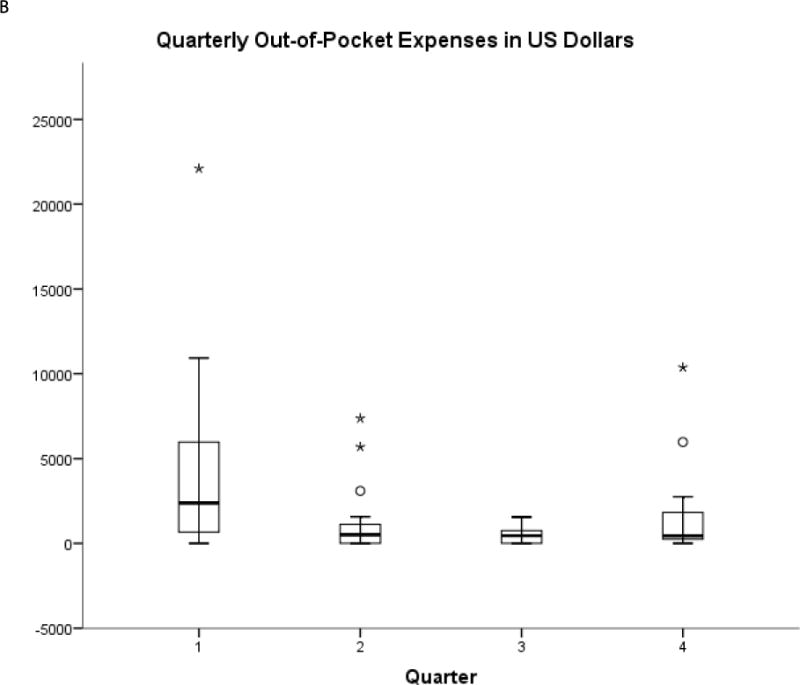
Out of pocket expenses per quarter are presented as box-plots to illustrate the range and trends of out-of-pocket expenses in the year following the incident stroke. Panel A shows actual expenses. Panel B shows expenses as a percent of annual household income.
Table.
Breakdown of out-of-pocket costs (in US dollars) into their component parts (lost income, transportation, unreimbursed health care costs, unreimbursed home care costs, lodging costs for stroke related medical visits, and unreimbursed costs for un-prescribed medical care). The values are mean; median; and range.
| Q1 | Q2 | Q3 | Q4 | 1Y | |
|---|---|---|---|---|---|
| Lost Income | 2398 474 (0–20480) |
726 0 (0–5149) |
75 0 (0–625) |
434 10 (0–6293) |
3395 883 (0–20732) |
| Transportation | 462 250 (0–1704) |
160 115 (0–630) |
122 89 (0–307) |
425 250 (0–4080) |
1018 647 (0–4768) |
| Health Care | 642 16 (0–5100) |
172 0 (0–1250) |
287 115 (0–1250) |
518 0 (0–5940) |
1390 250 (0–8560) |
| Home Care | 125 0 (0–2500) |
83 0 (0–1250) |
0 0 (0–0) |
69 0 (0–1250) |
250 0 (0–3750) |
| Lodging | 349 0 (0–3687) |
26 0 (0–250) |
14 0 (0–200) |
64 0 (0–1152) |
431 0 (0–4839) |
| Non-prescribed Treatment | 22 0 (0–250) |
83 0 (0–1250) |
34 0 (0–250) |
28 0 (0–250) |
135 0 (0–1250) |
| Total | 3997 2297 (0–22100) |
1251 509 (0–7369) |
534 456 (0–1557) |
1538 436 (0–10373) |
6619 4354 (0–28666) |
There was a weak correlation between annual income and indirect expenses, but this did not reach statistical significance (Spearman’s correlation coefficient 0.333; p=0.13). This finding suggests that indirect costs are not driven by family income. We found no correlation between total indirect expenses and the maximum Pediatric NIH stroke scale, outcome at 1 year as assessed by the Pediatric Stroke Outcome Measure, or age at stroke onset.
Discussion
There have been no previous studies of the indirect costs of pediatric neurological disease. Our study shows that indirect costs are significant expenses after a child’s ischemic stroke. We speculate that other severe neurological diseases may have similar indirect costs; however, more research is needed. If our speculation proves true, the potential policy implications are that a family whose child suffered a severe neurological illness may encounter financial burdens that are not covered by health care insurance. One of these burdens is lost wages as parents take time to care for their child. At the individual family level a child’s stroke can substantially challenge a family’s financial state. The median annual total indirect expenditure of $4354 is particularly concerning since the median American household in 2009 had cash assets of $3,650,(http://www.census.gov/people/wealth/data/dtables.html) and the median Canadian household had cash assets of $2956 (US dollars) in 2005 (http://statcan.gc.ca/daily-quotidien/140225/t140225b002-eng.htm). The lack of correlations with out-of-pocket expenses is noteworthy. We anticipated that greater stroke severity or worse neurological impairment would correlate with greater out-of-pocket expenses, but that was not the case. The lack of correlation suggests that parents from different financial strata encounter similar out-of-pocket expenses when a child develops a neurological illness that requires chronic care and rehabilitation. Our results provide evidence that childhood stroke creates an un-recognized cost to society. Parents have decreased productivity because of missed hours at work to care for their child. These results can be combined with previous studies that focused upon the direct costs of childhood stroke1;2;17;18 to provide a more complete understanding of the financial impact of childhood ischemic stroke.
The proportion of indirect costs to total costs of stroke in children is comparable with that in adults. Two recent studies provided one year estimates for the direct cost of ischemic pediatric stroke. One reported a median one year direct cost of $31,680 for strokes between 2001 and 2004.19 The other reported a median of $28,710 for strokes occurring from 1996–2003.2 Combining our estimate for one year indirect costs with these direct costs, indirect costs represent 12 to 13% of total costs. In adult studies, indirect cost estimates vary widely.6;20;21 Three studies assessed indirect costs similar to ours. In a study of indirect costs for 3,074 Swedes who had an incident ischemic or hemorrhagic stroke in 2008, informal care during the first year represented 6% of total costs while lost wages represented another 9%.22 In a study of indirect costs for 27,660 Australians who had an ischemic stroke in 2004, out-of-pocket and caregiver costs accounted for 6.8% of total cost in the first year.23 In a study of indirect costs of ischemic stroke and TIA in 7,735 Irish in 2007, informal care accounted for 9% of total stroke costs and lost wages accounted for 20%.9 Taking these three adult studies together it is striking that the proportion of indirect costs to total cost in children is similar to the proportion for adult stroke.
Indirect costs for pediatric illnesses vary widely depending upon the availability of insurance or government health programs, and most pediatric studies examine acute rather than chronic illnesses.10;11 However, two studies that examined chronic pediatric illnesses are comparable to our study. In a study of indirect costs incurred by 369 children with rheumatological disorders in 2003, indirect costs including out of pocket costs and lost wages represented 10% of annual total costs.12 In a study of indirect costs in 177 children with pediatric malignancies in 1981, indirect costs, which included out-of-pocket and lost wages, were 33% of total costs.13 These two studies suggest that the indirect costs for stroke fall within the range of indirect costs for other chronic pediatric illnesses, and those indirect costs have a substantial financial impact upon families.
Our study has limitations, the most obvious of which is the small sample size. The initial median Pediatric NIH score and the median Pediatric Stroke Outcome Measure at 1 year after the incident stroke were similar between our cohort and the children who did not participate. These results suggest that the stroke severity for our study cohort was similar to that of the parent study cohort. The ranges for lost income and out-of-pocket costs in our study are wide, and likely reflect the broad range of costs that are incurred in pediatric stroke.1;2 To estimate average costs with tighter confidence intervals, one would likely need to recruit much larger numbers of subjects than could be obtained in any study involving pediatric stroke. We relied upon parental self-report for annual income, hours not worked, and out-of-pocket expenses so our determinations may vary substantially from “true” values if the parental reports are inaccurate. We do not have data to explain some of the interesting findings, for example the increase in costs during the fourth quarter. This study was performed at four North American tertiary care centers, so the amount of the expenses and the relative proportion of indirect to total cost may not generalize to other healthcare systems or other countries. It is important to note that these observations were obtained prior to the initiation of the Affordable Care Act, which may affect future indirect costs in the U.S.
Despite these limitations, our results are important because they are the first attempt to capture indirect costs for a pediatric neurological disorder that results in long-term needs for care. Our results provide a missing piece of information regarding the overall costs of pediatric stroke and illustrate the impact of pediatric stroke upon the larger society. Our findings provide intriguing preliminary observations that may lead to hypothesis testing in future studies. Lastly, these results may provide estimates of out-of-pocket costs for any future cost-benefit analyses of pediatric stroke treatments.
Supplementary Material
Supplement 1. The questionnaire and worksheet families used to tabulate and report the out of pocket costs they encountered.
Acknowledgments
We thank William Gardner, Ph.D., of the Research Institute at Nationwide Children’s Hospital for his generous assistance in preparing the questionnaire, and for the families and their willingness to share their personal financial information.
Funding source: This study was an ancillary project to NINDS RO1-NS050488.
Footnotes
Publisher's Disclaimer: This is a PDF file of an unedited manuscript that has been accepted for publication. As a service to our customers we are providing this early version of the manuscript. The manuscript will undergo copyediting, typesetting, and review of the resulting proof before it is published in its final citable form. Please note that during the production process errors may be discovered which could affect the content, and all legal disclaimers that apply to the journal pertain.
Roles of the Authors
Ms. Plumb collected patient data, reviewed study design, participated in the writing, and approved the final version of the manuscript.
Dr. Seiber participated in the study design, researched data regarding household savings, participated in the writing, and approved the final version of the manuscript.
Dr. Dowling supervised the collection of data, participated in the writing, and approved the final version of the manuscript.
Ms. Lee collected patient data, participated in the writing, and approved the final version of the manuscript.
Dr. Bernard supervised the collection of data, participated in the writing, and approved the final version of the manuscript.
Dr. deVeber participated in the writing, and approved the final version of the manuscript.
Dr. Ichord obtained the grant funding for the primary study, supervised the collection of data, participated in the writing, and approved the final version of the manuscript.
Ms. Bastian collected patient data, participated in the writing, and approved the final version of the manuscript.
Dr. Lo developed the study design, wrote the first draft, and approved the final version of the manuscript.
Financial disclosures: None
Conflict of Interest: None
Reference List
- 1.Turney CM, Wang W, Seiber E, Lo W. Acute pediatric stroke: contributors to institutional cost. Stroke. 2011;42:3219–3225. doi: 10.1161/STROKEAHA.111.614917. [DOI] [PubMed] [Google Scholar]
- 2.Gardner MA, Hills NK, Sidney S, Johnston SC, Fullerton HJ. The 5-year direct medical cost of neonatal and childhood stroke in a population-based cohort. Neurology. 2010;74:372–378. doi: 10.1212/WNL.0b013e3181cbcd48. [DOI] [PMC free article] [PubMed] [Google Scholar]
- 3.Hickenbottom SL, Fendrick AM, Kutcher JS, Kabeto MU, Katz SJ, Langa KM. A national study of the quantity and cost of informal caregiving for the elderly with stroke. Neurology. 2002;58:1754–1759. doi: 10.1212/wnl.58.12.1754. [DOI] [PubMed] [Google Scholar]
- 4.Lindgren P, Glader EL, Jonsson B. Utility loss and indirect costs after stroke in Sweden. Eur J Cardiovasc Prev Rehabil. 2008;15:230–233. doi: 10.1097/HJR.0b013e3282f37a22. [DOI] [PubMed] [Google Scholar]
- 5.Dewey HM, Thrift AG, Mihalopoulos C, et al. Informal care for stroke survivors: results from the North East Melbourne Stroke Incidence Study (NEMESIS) Stroke. 2002;33:1028–1033. doi: 10.1161/01.str.0000013067.24300.b0. [DOI] [PubMed] [Google Scholar]
- 6.van den BB, Brouwer W, Van EJ, Koopmanschap M, van den Bos GA, Rutten F. Economic valuation of informal care: lessons from the application of the opportunity costs and proxy good methods. Soc Sci Med. 2006;62:835–845. doi: 10.1016/j.socscimed.2005.06.046. [DOI] [PubMed] [Google Scholar]
- 7.Riewpaiboon A, Riewpaiboon W, Ponsoongnern K, van den BB. Economic valuation of informal care in Asia: a case study of care for disabled stroke survivors in Thailand. Soc Sci Med. 2009;69:648–653. doi: 10.1016/j.socscimed.2009.05.033. [DOI] [PubMed] [Google Scholar]
- 8.Heidenreich JO, Hartlieb S, Stendel R, et al. Bleeding complications after endovascular therapy of cerebral arteriovenous malformations. AJNR Am J Neuroradiol. 2006;27:313–316. [PMC free article] [PubMed] [Google Scholar]
- 9.Smith S, Horgan F, Sexton E, et al. The cost of stroke and transient ischaemic attack in Ireland: a prevalence-based estimate. Age Ageing. 2012;41:332–338. doi: 10.1093/ageing/afr141. [DOI] [PubMed] [Google Scholar]
- 10.Chai PF, Lee WS. Out-of-pocket costs associated with rotavirus gastroenteritis requiring hospitalization in Malaysia. Vaccine. 2009;27(Suppl 5):F112–5. doi: 10.1016/j.vaccine.2009.08.069.:F112-F115. [DOI] [PubMed] [Google Scholar]
- 11.Barasa EW, Ayieko P, Cleary S, English M. Out-of-pocket costs for paediatric admissions in district hospitals in Kenya. Trop Med Int Health. 2012;17:958–961. doi: 10.1111/j.1365-3156.2012.03029.x. [DOI] [PMC free article] [PubMed] [Google Scholar]
- 12.Minden K, Niewerth M, Listing J, et al. The economic burden of juvenile idiopathic arthritis-results from the German paediatric rheumatologic database. Clin Exp Rheumatol. 2009;27:863–869. [PubMed] [Google Scholar]
- 13.Bloom BS, Knorr RS, Evans AE. The epidemiology of disease expenses. The costs of caring for children with cancer. JAMA. 1985;253:2393–2397. [PubMed] [Google Scholar]
- 14.Ichord RN, Bastian R, Abraham L, et al. Interrater reliability of the Pediatric National Institutes of Health Stroke Scale (PedNIHSS) in a multicenter study. Stroke. 2011;42:613–617. doi: 10.1161/STROKEAHA.110.607192. [DOI] [PMC free article] [PubMed] [Google Scholar]
- 15.Dockerty JD, Skegg DC, Williams SM. Economic effects of childhood cancer on families. J Paediatr Child Health. 2003;39:254–258. doi: 10.1046/j.1440-1754.2003.00138.x. [DOI] [PubMed] [Google Scholar]
- 16.deVeber GA, MacGregor D, Curtis R, Mayank S. Neurologic outcome in survivors of childhood arterial ischemic stroke and sinovenous thrombosis. J Child Neurol. 2000;15:316–324. doi: 10.1177/088307380001500508. [DOI] [PubMed] [Google Scholar]
- 17.Perkins E, Stephens J, Xiang H, Lo W. The Cost of Pediatric Stroke Acute Care in the United States. Stroke. 2009;40:2820–2827. doi: 10.1161/STROKEAHA.109.548156. [DOI] [PMC free article] [PubMed] [Google Scholar]
- 18.Chen PC, Chien KL, Chang CW, et al. More hemorrhagic and severe events cause higher hospitalization care cost for childhood stroke in Taiwan. J Pediatr. 2008;152:388–393. doi: 10.1016/j.jpeds.2007.08.003. [DOI] [PubMed] [Google Scholar]
- 19.Lo W, Zamel K, Ponnappa K, et al. The cost of pediatric stroke care and rehabilitation. Stroke. 2008;39:161–165. doi: 10.1161/STROKEAHA.107.497420. [DOI] [PubMed] [Google Scholar]
- 20.Sach TH, Whynes DK. Measuring indirect costs: is there a problem? Appl Health Econ Health Policy. 2003;2:135–139. [PubMed] [Google Scholar]
- 21.Luengo-Fernandez R, Gray AM, Rothwell PM. Costs of stroke using patient-level data: a critical review of the literature. Stroke. 2009;40:e18–e23. doi: 10.1161/STROKEAHA.108.529776. [DOI] [PubMed] [Google Scholar]
- 22.Persson J, Ferraz-Nunes J, Karlberg I. Economic burden of stroke in a large county in Sweden. BMC Health Serv Res. 2012;12:341. doi: 10.1186/1472-6963-12-341. [DOI] [PMC free article] [PubMed] [Google Scholar]
- 23.Cadilhac DA, Carter R, Thrift AG, Dewey HM. Estimating the long-term costs of ischemic and hemorrhagic stroke for Australia: new evidence derived from the North East Melbourne Stroke Incidence Study (NEMESIS) Stroke. 2009;40:915–921. doi: 10.1161/STROKEAHA.108.526905. [DOI] [PubMed] [Google Scholar]
Associated Data
This section collects any data citations, data availability statements, or supplementary materials included in this article.
Supplementary Materials
Supplement 1. The questionnaire and worksheet families used to tabulate and report the out of pocket costs they encountered.