

Background: Gluconeogenesis is sensitive to nutritional state and disease.
Results: After injection of hyperpolarized [2-13C]dihydroxyacetone in the perfused mouse liver, the ratio of 3-carbon intermediates and hexoses provides an index of gluconeogenesis.
Conclusion: Glycogenolysis versus gluconeogenesis correlates with metabolism of hyperpolarized dihydroxyacetone.
Significance: Hyperpolarized [2-13C]dihydroxyacetone detects gluconeogenesis in living tissues, in real time.
Keywords: Diabetes, Gluconeogenesis, Glucose Metabolism, Glycolysis, Nuclear Magnetic Resonance (NMR), Dihydroxyacetone, Glycogenolytic, Hyperpolarization
Abstract
Glycogenolysis and gluconeogenesis are sensitive to nutritional state, and the net direction of flux is controlled by multiple enzymatic steps. This delicate balance in the liver is disrupted by a variety of pathological states including cancer and diabetes mellitus. Hyperpolarized carbon-13 magnetic resonance is a new metabolic imaging technique that can probe intermediary metabolism nondestructively. There are currently no methods to rapidly distinguish livers in a gluconeogenic from glycogenolytic state. Here we use the gluconeogenic precursor dihydroxyacetone (DHA) to deliver hyperpolarized carbon-13 to the perfused mouse liver. DHA enters gluconeogenesis at the level of the trioses. Perfusion conditions were designed to establish either a gluconeogenic or a glycogenolytic state. Unexpectedly, we found that [2-13C]DHA was metabolized within a few seconds to the common intermediates and end products of both glycolysis and gluconeogenesis under both conditions, including [2,5-13C]glucose, [2-13C]glycerol 3-phosphate, [2-13C]phosphoenolpyruvate (PEP), [2-13C]pyruvate, [2-13C]alanine, and [2-13C]lactate. [2-13C]Phosphoenolpyruvate, a key branch point in gluconeogenesis and glycolysis, was monitored in functioning tissue for the first time. Observation of [2-13C]PEP was not anticipated as the free energy difference between PEP and pyruvate is large. Pyruvate kinase is the only regulatory step of the common glycolytic-gluconeogenic pathway that appears to exert significant control over the kinetics of any metabolites of DHA. A ratio of glycolytic to gluconeogenic products distinguished the gluconeogenic from glycogenolytic state in these functioning livers.
Introduction
Gluconeogenesis from glycerol, lactate, propionate, and amino acids is required for survival during prolonged fasting, and many disorders such as type 2 diabetes are associated with abnormal regulation of gluconeogenesis. Consequently, numerous methods have been developed to monitor gluconeogenesis in the liver (1–7). Hyperpolarization of 13C-labeled precursors offers a new approach for investigating metabolism that combines detailed chemical information about the products of metabolism coupled with the practical advantages of stable isotopes (8). A method to noninvasively detect and conceivably image hepatic gluconeogenesis would have a major impact.
One approach could be to monitor the rate of appearance of hyperpolarized (HP)2 13CO2 and HP [13C]bicarbonate, which may be sensitive to gluconeogenesis. HP 13CO2 is generated during gluconeogenesis from HP [1-13C]pyruvate via the following pathway: carboxylation to [1-13C]oxaloacetate followed by scrambling in the fumarate and succinate pool to generate [4-13C]oxaloacetate and subsequent decarboxylation at phosphoenolpyruvate carboxykinase. However, decarboxylation of [1-13C]pyruvate via pyruvate dehydrogenase also generates 13CO2, so the contribution of flux through phosphoenolpyruvate carboxykinase to the total rate of production of HP 13CO2 and HP [13C]bicarbonate is uncertain (9, 10).
Dihydroxyacetone (DHA), like pyruvate, is avidly consumed as a substrate for gluconeogenesis in the liver (11). DHA is phosphorylated rapidly to dihydroxyacetone phosphate (DHAP), which exchanges readily with glycerol 3-phosphate and glycerol. Like glycerol, the DHA carbon backbone enters gluconeogenesis in the triose phosphate pool (Fig. 1). In this study, HP [2-13C]DHA was investigated as an agent for unambiguously detecting conversion of a gluconeogenic precursor to hexoses, in real time. We tested the hypothesis that HP [2-13C]DHA would be rapidly metabolized to hexoses in the gluconeogenic but not glycogenolytic state. Conditions were chosen to stimulate gluconeogenesis from 3-carbon precursors by studying livers from fasted animals provided with excess pyruvate (gluconeogenic state) as compared with livers taken from fed animals where glucose production is predominantly by glycogenolysis (glycogenolytic state). The distribution of 2H in glucose produced by the liver in the presence of 2H2O was used to independently confirm that exported glucose arose primarily from glycogenolysis or gluconeogenesis. Conventional 13C NMR spectroscopy of effluent glucose provided independent confirmation of metabolism of [2-13C]DHA to its various products.
FIGURE 1.

Metabolic scheme for metabolism of DHA in the liver. Colored hexagons denote the site of 13C enrichment. GA3P is a central metabolite in the metabolism of DHA, with fates composed of its reduction to 1,3 bisphosphoglycerate or its condensation with DHAP to produce a single fructose 1,6-bisphosphate. When 3-carbon molecules are discussed in this study, it refers not only to the trioses but also to pyruvate, lactate, and alanine.
Generation of phosphoenolpyruvate was monitored continuously in functioning liver for the first time. The functional state of the liver, glycogenolytic versus gluconeogenic, was distinguished in real time using hyperpolarized [2-13C]DHA. This is the first case where gluconeogenesis from a 3-carbon precursor has been directly detected using an HP imaging agent. We found that the intermediates and end products of both glycolysis and gluconeogenesis were rapidly (on the time scale of ∼10 s) enriched under dramatically different nutritional conditions. Earlier studies using 3H-enriched glucose and 14C-enriched glycerol also found simultaneous flux through both glycolysis and gluconeogenesis in isolated hepatocytes. This finding was interpreted as compartmentalization of glycolysis and gluconeogenesis in a cell. Similar results could be observed if two populations of hepatocytes are present, one associated with glycolytic properties and predisposed to metabolize 3H-enriched glucose, and the other associated with gluconeogenic properties and predisposed to metabolize 14C-enriched glycerol (12). Because a single labeled compound was used in the current study, the results cannot be due to preferential uptake of one tracer or another, and provide further support for bidirectional flux in gluconeogenic and glycolytic pathways.
EXPERIMENTAL PROCEDURES
[2-13C]Dihydroxyacetone dimer (99% enriched) was purchased from Isotec Laboratories (Miamisburg, OH) and used without further purification. The trityl radical, tris[8-carboxyl-2,2,6,6-tetra-[2-(1-hydroxyethyl)]-benzo-(1,2-d:4,5-d)-bis-(1,3)-dithiole-4-yl]-methyl sodium salt, was purchased from Oxford Molecular Biotools Ltd. (Abingdon, Oxfordshire, UK) and used without further purification. All other chemicals were obtained from Sigma-Aldrich at the highest quality available. Female C57BL/6 mice (20–25 g) were obtained from Charles River Laboratories (Wilmington, MA). Fasted animals were fasted overnight (∼12–15 h), and fed animals were fed ad libitum prior to experimentation. The studies were performed under a protocol approved by the Institutional Animal Care and Use Committee at the University of Texas Southwestern Medical Center.
Hyperpolarization
An Oxford HyperSense® (Abingdon, UK) dynamic nuclear polarization hyperpolarizer was used to hyperpolarize [2-13C]dihydroxyacetone dimer (DHA dimer). An 8.0 m solution of [2-13C]DHA in a (2:1) water:dimethyl sulfoxide (DMSO) mixture was doped with 15 mm stable trityl free radical (Oxford Instruments Molecular Biotools) and 1.0 mm ProHance®. The frozen sample was cooled to 1.05 K in a pumped helium bath inside the magnetic field (3.35 T) of the HyperSense, and the microwave irradiation was turned on. When the final polarization was reached (∼1.5–2 h), the irradiation was turned off, and the sample was rapidly dissolved with 4 ml of hot (>190 °C) PBS (10 mm, pH ∼7.4) and transferred to an 89-mm vertical 9.4 T NMR spectrometer for transfer into the perfusate chamber and spectral acquisition. The level of hyperpolarization can be estimated in separate experiments for each compound by measuring the NMR signal intensity after hyperpolarization and comparing it with a standard using the same NMR spectrometer.
Spin Lattice Relaxation of [2-13C]DHA
The spin lattice relaxation, T1, time of carbon-2 for [2-13C]DHA, was determined by the fitted exponential decay of the hyperpolarized compound using the following equation (13)
where S(τ) is the signal intensity, Mp is the z magnetization at time = 0, θ is the pulse width, τ is time, and TR is the total repetition time. The T1 relaxation time at 9.4 T was determined to be 32 s.
Liver Isolation and Perfusion
Each mouse was injected (intramuscularly) with 0.1 ml of an anesthetic solution (ketamine (Fort Dodge Animal Health)/xylazine (Boehringer Ingelheim), 85:15, w/w). Livers were isolated and perfused using an all-glass perfusion system that fits entirely into the bore of the spectrometer as described previously (14, 15). The livers were suspended in a perfusion medium inside a 20-mm NMR tube attached to the perfusion apparatus. After confirming the viability of the organ by arteriovenous oxygen content difference, the rig was placed within the bore of the magnet.
The mouse livers were studied in two groups: fed (non-gluconeogenic, n = 5) and fasted (gluconeogenic, n = 4). Each group was perfused with a modified Krebs-Henseleit medium containing (in mm): 25 NaHCO3, 118 NaCl, 4.7 KCl, 1.2 MgSO4, 1.2 KH2PO4, 1.25 CaCl2. The perfusion buffer for the fed livers also contained sodium octanoate (0.2 mm), whereas the buffer for the fasted livers contained sodium pyruvate (2 mm) and sodium octanoate (0.2 mm). The protocols for each group were as follows. All livers were perfused at a constant flow (10–13 ml/min) for a minimum of 30 min and received a 23-ml injection of 4 mm HP [2-13C]DHA over a period of ∼90 s. Carbon-13 spectra were acquired when injection of the hyperpolarized solution began.
Hyperpolarized 13C Spectral Acquisition
During a preparation and stabilization time of ∼20 min after placing the perfusion apparatus within the magnet, the NMR probe was tuned and the field homogeneity was optimized using the 23Na free induction decay. A 23Na line width of 11 Hz or less was typically obtained, translating to ∼3–6 Hz 13C line widths. Carbon-13 NMR spectra were acquired at ∼100 MHz in a 25-mm Doty broadband probe using 30° pulses. Injection of the hyperpolarized solution and spectral acquisition were started simultaneously. The first free induction decay was acquired 1 ms from the start of the acquisition. Serial, single free induction decays were acquired with 16,000 complex data points over a ± 36-kHz bandwidth with proton decoupling. Acquisition time was ∼1 s and a delay of 2.0 s, giving a repetition time of 3 s for each scan. Typically, 60 separate free induction decays were collected. These data were zero-filled prior to Fourier transformation, and the relative peak areas were measured by integration using the ACDLabs SpecManager version 12.00 (Advanced Chemistry Development, Inc.; Toronto, Canada).
Fitting of Time-dependent Hyperpolarized Metabolite Resonances
Time-dependent signals for the hexoses were obtained by summing the time/intensity curves for all the observed hexoses derived from DHA. The data were fitted to a function, f = A ×(1 − exp−τα) × e−τβ, where T is time in seconds, α is the apparent rate constant for the buildup of the metabolite signal, β is a decay rate of the signal, and A is an arbitrary amplitude. Both α and β are “apparent rates,” where α refers to the delivery of the DHA to the liver as well as the sum of the individual reactions that leads to each plotted set of resonances, and β is the sum of effects arising from the clearance of the metabolites, the T1, and the effect of the excitation pulses on the hyperpolarized magnetization.
Glucose Isotopomer Analysis by NMR Spectroscopy
Glucose production was determined using a standard hexokinase/glucose-6-phosphate dehydrogenase-coupled assay from 1-ml effluent samples collected every 15 min throughout the experiment (16). Total effluent (∼500 ml) from the liver was collected during the experiment. Glucose was purified from the effluent samples via a modification of a previously described procedure (17). The modified procedure removed protein residue from the effluent by the addition of 70% perchloric acid (aqueous) to the effluent solution to make a 5% perchloric acid solution. After stirring for 15–20 min, the solution was split into several 50-ml centrifuge tubes and centrifuged at 13.5 × 10³ rpm at 4 °C. The supernatant was filtered and combined. The solution was neutralized with KOH, over ice, until a pH of 7.5–7.6 was obtained. The resultant salt, KClO4, was removed by filtration. Glucose was purified from the filtrate using the previously described procedure (17). Half of the purified glucose was converted to 1,2-isopropylidene glucofuranose (monoacetone glucose, MAG) (18–20). The MAG samples were analyzed by 13C and 2H NMR on a 14.1 T Agilent VNMRS spectrometer equipped with a 3-mm broadband probe (Varian, Palo Alto, CA). For carbon-13, data were acquired at 25 °C with 30,000 complex data points over a ±10-kHz bandwidth with proton decoupling. Acquisition time was 1.5 s, 1.0-s delay, and a pulse width of 50° averaged over 10,000 scans. For deuterium, data were acquired at 50 °C with 2000 complex data points over a ±400-Hz bandwidth. Acquisition time was 1.5 s, no delay, and a pulse width of 90° averaged over 10,000 scans. The remaining purified glucose samples were analyzed by 13C NMR at 37 °C on a 14.1 T Bruker Avance III HD equipped with a 10-mm cryoprobe (Bruker, Billerica, MA). The data were acquired with 32,800 complex data points over a ±18-kHz bandwidth with proton decoupling. Acquisition time was 1.0 s, 2.5-s delay, and a pulse width of 45° averaged over 13,000 scans. Relative peak areas for glucose and MAG were determined by deconvolution using ACDLabs SpecManager. The fractional contribution to gluconeogenesis from glycogenolysis, glycerol, and phosphoenolpyruvate was determined from the relative deuterium enrichments in the H2, H5, and H6s positions of MAG as described previously (21, 22).
Statistical Analysis
Data are presented as mean ± 1 S.D. Statistical significance were determined by using two-tailed t tests with a 95% confidence level using GraphPad Prism version 6.02 (GraphPad Prism Software, Inc, La Jolla, CA).
RESULTS
Upon injection of hyperpolarized [2-13C]DHA, resonances of DHA and other metabolites appeared immediately and were assigned using a combination of chemical shift charts, previously reported hyperpolarized [U-2H, U-13C]glucose metabolites (23), and conventional 13C spectra of glucose purified from liver effluent collected throughout the perfusion experiment (Fig. 2). The T1 of the carbon-13-labeled 2-position of DHA is ∼32 s at 9.4 T. As expected, due to their proximity to DHA in the metabolic pathways, G3P, glycerol, and GA3P appeared first (Fig. 3). GA3P is expected because it is in rapid equilibrium with DHAP via the triose-phosphate isomerase reaction. Because DHAP supplies the “top” half of glucose (carbons 1–3) and GA3P supplies the “bottom” half, the detection of HP [2-13C]GA3P implies that glucose could be labeled in positions 2 or 5. [2-13C]DHAP was not independently observed, likely because phosphorylation results in only a small (∼10-Hz) shift of the C2 resonance as compared with unphosphorylated DHA. Remarkably, hexose resonances also appeared nearly simultaneously, demonstrating rapid gluconeogenesis from trioses in both conditions. 13C NMR spectra of the effluent glucose showed excess enrichment in the C2 and C5 of glucose, confirming that [2-13C]DHA was rapidly converted to glucose and exported (Fig. 2). It is generally accepted that the intermediates of glycolysis and gluconeogenesis co-exist in a common cytoplasmic compartment, and that glycolysis and gluconeogenesis do not occur simultaneously. Under these conditions where octanoate provided an abundant source of acetyl-CoA, carbohydrates provide very little acetyl-CoA. Therefore, it was quite surprising to find that downstream products of DHA, including HP [2-13C]PEP, [2-13C]pyruvate, [2-13C]lactate, and [2-13C]alanine, also appeared under gluconeogenic conditions, demonstrating net flux of HP 13C through the rate-limiting step of pyruvate kinase (Fig. 3A). Carbon-13 and 1H NMR spectra of pooled extracts of the liver showed that 13C enrichment at the lactate-C2 position was ∼11% in the glycogenolytic condition versus 7% in the gluconeogenic condition, indicative of increased flux of DHA through PEP when gluconeogenesis was less active. Because the liver extracts were pooled to increase the 13C NMR sensitivity, standard deviations are not reported for this measurement. Excess enrichment in glutamate-C5 or glutamine-C5 was not detected, indicating that oxidation of pyruvate derived from DHA was negligible, consistent with the presence of octanoate. In two of the livers in the fed state, HP [2-13C]aspartate and [2-13C]malate were also observed in the sum spectra, indicative of carboxylation of [2-13C]pyruvate derived from the HP DHA, but the resonances did not have a high enough signal-to-noise ratio to be observed on a scan by scan basis.
FIGURE 2.
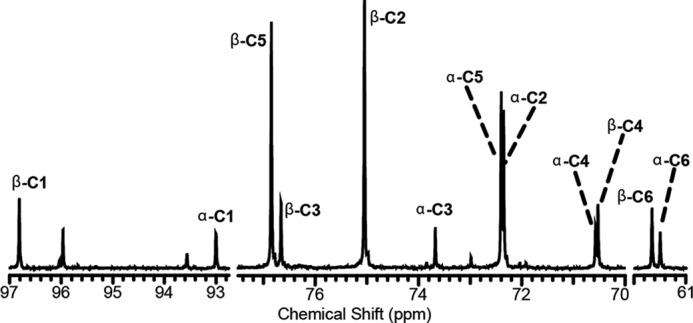
1H-decoupled, 13C-detected spectra of purified glucose collected from the effluent of a perfused liver. The large peaks associated with the C2 and C5 positions arise from gluconeogenesis from [2-13C]DHA.
FIGURE 3.
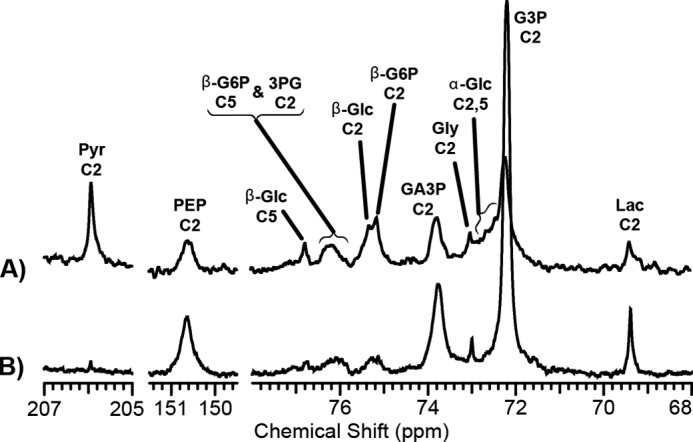
NMR spectra of metabolites of [2-13C]DHA. The spectra were obtained from a liver in a gluconeogenic state (A) versus a glycogenolytic state (B). Assignments were made by comparing the HP spectrum with the thermally polarized carbon spectrum of the extracts (Fig. 2) and known chemical shift values for the intermediates. In the case of GA3P, the resonance was assigned by comparison with a standard made of the pure compound. The spectra are the sum of 35 successive scans from a single hyperpolarization experiment.
The intensities of the resonances as a function of time are plotted in Fig. 4. GA3P is the first metabolite of DHA that is easily monitored, and it is plotted on both figures to provide a scale for the relative intensities. For clarity, resonances associated with the 3-carbon glycolytic intermediates and the products derived from pyruvate kinase flux, marked Downstream in Fig. 4, are plotted separately from the 6-carbon metabolites of DHA, marked Upstream in Fig. 4. The glycogenolytic condition produces a very large resonance associated with G3P, which is notably decreased in the gluconeogenic condition. Pyruvate, lactate, and alanine all have peak amplitudes that appear later in time than any of the other metabolites. This was confirmed using an analysis of the kinetics of the hexoses and PEP versus that of pyruvate (Fig. 5). The data displayed are the sum of each metabolite across the gluconeogenic (n = 5) state. Table 1 displays the apparent rate constants for some metabolites of DHA.
FIGURE 4.

Time/intensity curves for metabolites of [2-13C]DHA. Top and bottom, the intensity of the resonances of metabolites derived from DHA in the glycogenolytic state (top) versus the gluconeogenic state (bottom). Metabolites associated with GLYC are shown on the left, whereas those associated with GNG are on the right. GA3P is plotted in both the left panels and the right panels to provide a scale between the two groups. Pyr, pyruvate; 3PG, 3-phosphoglycerate; Lac, lactate.
FIGURE 5.
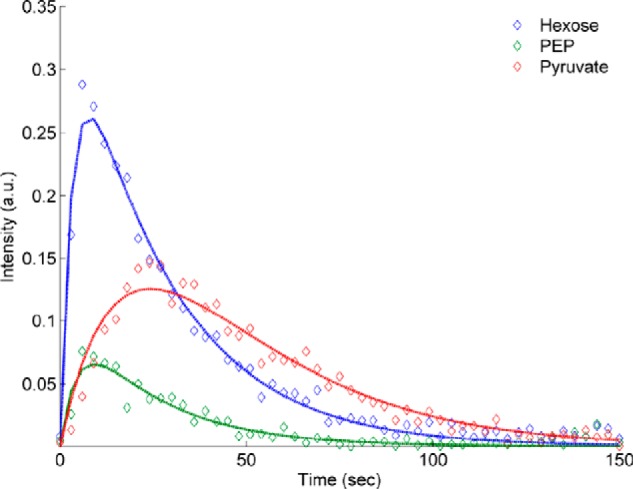
Time course for hyperpolarized metabolites of DHA in the gluconeogenic state. Hexose denotes the sum of all the hexose resonances, while PEP and Pyruvate refer only to the individual metabolites. The data (open symbols) are the average of all the runs for each metabolite. The uncertainties in the data were taken from fitting each run individually. Error bars are omitted for clarity. Pyruvate kinase is the only enzyme of the glycolytic-gluconeogenic pathway that produces a delay in the kinetic curves. a.u., arbitrary units.
TABLE 1.
Apparent k values for metabolites prior to and after pyruvate kinase
| khexose | kPEP | kpyruvate | |
|---|---|---|---|
| s−1 | s−1 | s−1 | |
| Glycogenolytic | 0.49 ± 0.10 | 0.39 ± 0.17 | 0.04 ± 0.03 |
| Gluconeogenic | 0.37 ± 0.22 | 0.26 ± 0.03 | 0.04 ± 0.03 |
For further analysis, the areas under the curve for each resonance were plotted (Fig. 6A). Significant differences between gluconeogenic and glycogenolytic conditions were noted for G3P, GA3P, PEP, lactate, and alanine, p < 0.05. In the case of pyruvate, the p value was < 0.01. Although the 6-carbon metabolites of DHA appeared to trend higher in the gluconeogenic condition, only the β-G6P-C2 resonance demonstrated a significant difference between the conditions. In an effort to estimate the relative activities of the gluconeogenic and glycogenolytic pathways, the intensities of the sums of the 3-carbon (trioses and products of pyruvate kinase included) and hexose metabolites were also plotted (Fig. 6B). The glycogenolytic condition produced more 3-carbon signal intensity (p < 0.05), whereas the gluconeogenic condition did not produce significantly more hexose signal intensity, p = 0.16. The inset of Fig. 6A shows that the total signal associated with DHA was not significantly different between the groups. This indicates that under both conditions, DHA is taken up and metabolized at approximately the same rates, but that the metabolic fate of the imaging agent is different. Fig. 6C plots the 3-carbon/hexose ratio for the two perfusion conditions. The groups were different at a p < 0.01 confidence level.
FIGURE 6.
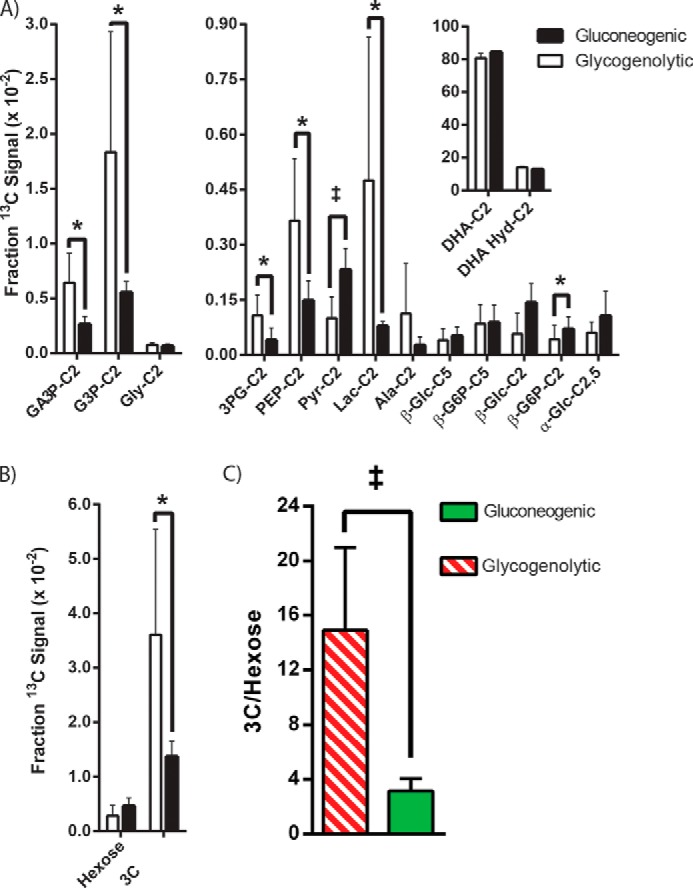
Areas under the curve for DHA and its metabolites. A, note that the two liver conditions produce equivalent total amounts of downstream signals versus the parent DHA molecule (inset). Differences at the 0.05% confidence level are denoted by asterisks, and differences at the 0.01% confidence level are denoted by the double dagger. Pyr, pyruvate; Lac, lactate. B, the two columns marked 3C (3-carbon) and Hexose plot the total intensity of the 6-carbon molecules versus that of the 3-carbon molecules. In the gluconeogenic condition, signal from the 6-carbon molecules increase significantly, whereas the 3-carbon resonances decrease. In the glycogenolytic condition, the opposite trend is observed. C, the 3-carbon/hexose (3C/hexose) ratio between the two states is significantly different at the 0.01 confidence level.
Independent measures of glucose production and sources of glucose were quite different depending on nutritional state. The livers from fed animals excreted considerably more glucose into the perfusion medium than the livers from fasted animals supplied with pyruvate (1.3 ± 0.4 versus 0.6 ± 0.3 μmol/min/gww), suggesting that glycogenolysis provided much of the glucose production. The sources of effluent glucose were assessed by the distribution of deuterium in glucose from livers from both groups in the presence of 3% v/v D2O/H2O. This method measures the relative rates of gluconeogenesis from the citric acid cycle, gluconeogenesis from glycerol, and glycogenolysis (3, 19). In Fig. 7, 2H spectra of monoacetone glucose samples derived from effluent glucose of a single perfused liver show both high signal-to-noise ratio as well as large differences in relative peak heights, indicative of relative flux through the various pathways responsible for hepatic glucose production. Bar graphs of the relative contributions of each pathway show that the gluconeogenic perfusion condition indeed resulted in significantly higher gluconeogenesis from the level of PEP (GNGPEP). About 90% of the excreted glucose was generated by gluconeogenesis from either glycerol or the citric acid cycle in the gluconeogenic condition, whereas in the glycogenolytic livers, ∼38% of glucose production was from gluconeogenesis. In absolute terms, the glucose that arose from GNGPEP in the glycogenolytic condition was therefore 0.2 × 1.3 = 0.26 μmol/min/gww. For the gluconeogenic state, the same calculation yielded a rate of 0.8 × 0.6 = 0.48 μmol/min/gww.
FIGURE 7.
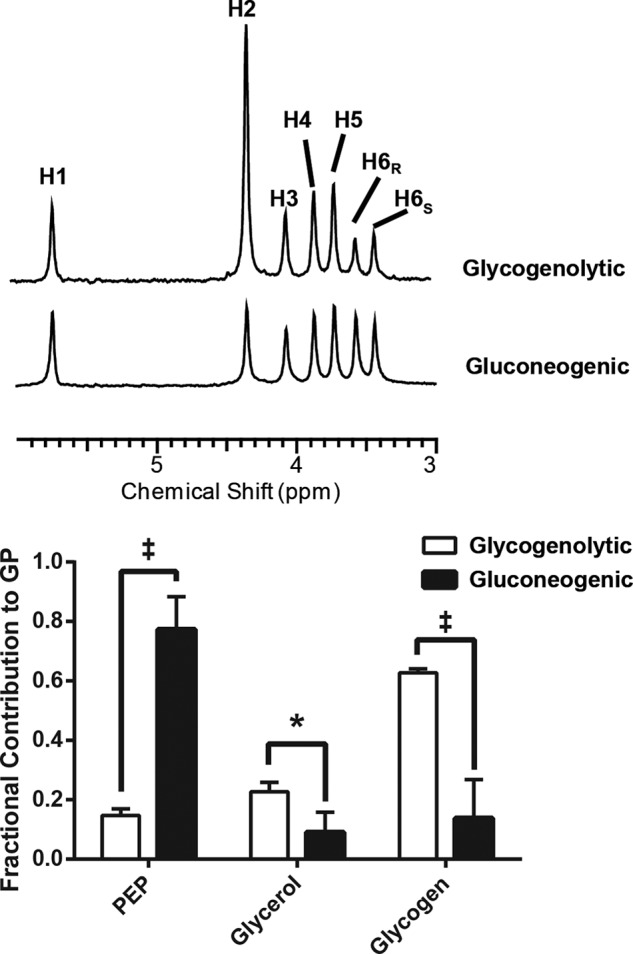
2H NMR spectra of the MAG derivative of glucose. Samples were collected from the effluent of a perfused liver in the gluconeogenic state versus the glycogenolytic state. The H2 labeling position is derived from exchange at the level of glucose-glucose-6-P and corresponds to the enrichment of the water used in the perfusate. The values 1 − (H5/H2), H5/H2, and (H5-H6s)/H2 report on glucose production from glycogenolysis, from glycerol, and from the tricarboxylic (TCA) cycle via phosphoenolpyruvate carboxykinase (PEPCK), respectively. Spectra from the gluconeogenic condition indicate that a large majority of the effluent glucose arose from GNG via phosphoenolpyruvate carboxykinase, whereas the fed condition is dominated by glycogenolysis. Lower panel, the sources of glucose production (GP) by the liver are markedly different between the two perfusion conditions.
DISCUSSION
Metabolism of HP [2-13C]DHA was monitored with a temporal resolution of 3 s. Nutritional and perfusion conditions were designed to establish either a glycogenolytic (or glycolytic, fed) or a gluconeogenic (fasted with the presence of gluconeogenic precursor) state. These distinct conditions were confirmed by independent analysis of glucose production from glycogen, from the citric acid cycle, and from trioses. Injection of HP DHA produced a variety of intermediates, with the glycogenolytic (glycolytic) and gluconeogenic pathways being differentially labeled in the two nutritional conditions. The 1H-decoupled 13C spectra derived from the HP DHA injection revealed a remarkable number of metabolites across multiple steps of the glycolytic-gluconeogenic pathway. Although significant differences for individual resonances are mainly limited to those of the 3-carbon molecules, each of the resonances associated with glucose and G6P trend higher in the gluconeogenic condition, with the β-G6P-C2 being significantly different (p < 0.05). [2-13C]Glucose and [5-13C]glucose were detected above natural abundance in the effluent, confirming metabolism of the bolus of [2-13C]DHA in gluconeogenesis (Fig. 2). These results are furthermore consistent with the independent and complementary results obtained with 2H NMR spectroscopy, showing that ∼90% of effluent glucose arose from gluconeogenesis (as opposed to glycogenolysis) in the gluconeogenic state, but only 38% arose from gluconeogenesis in the glycogenolytic state. Together, these results demonstrate that the rate of transport, phosphorylation, and metabolism of HP [2-13C]DHAP is sufficiently rapid to enable detection of gluconeogenesis in real time, across multiple enzymatic steps, in living tissues. In addition, estimates of the relative rates of gluconeogenesis from the 3-carbon/hexose ratio (Fig. 6) mimic the estimates of GNGPEP (Fig. 7). Although the absolute rate of GNGPEP was approximately doubled in the gluconeogenic condition, the 3-carbon/hexose ratio changed by a factor of ∼5, indicating that the ratio is exquisitely sensitive to GNGPEP. The motivating hypothesis of this work was confirmed, that HP [2-13C]DHA is a sensitive real-time detector of hepatic gluconeogenesis in functioning tissue.
In gluconeogenic conditions, HP [2-13C]DHA was rapidly metabolized to PEP and to lactate. This finding was initially surprising because it is generally accepted that the common enzymes and substrates of glycolysis and gluconeogenesis exist in the same homogenous compartment. Furthermore, it is often assumed that flux through both reactions does not occur simultaneously in the same cell because substrate conditions or allosteric effectors stimulate flux in one direction and suppress flux in the other. In retrospect, perhaps the current results are to be expected. The free energy change between the trioses (GA3P and DHAP) and PEP is quite small, and these reactions are thought to be readily reversible under cellular conditions. Consequently, once GA3P or DHAP become 13C-enriched, rapid exchange into 3-phosphoglycerate and PEP should be expected regardless of whether overall conditions favor gluconeogenesis or glycogenolysis. Because the free energy change for hydrolysis of PEP to pyruvate strongly favors pyruvate, we assumed that the PEP pool would probably be small, at the limit of detection. On the contrary, it was readily observed in both perfusion conditions. Significant flux through PEP was observed in both states. In the liver extracts, 13C label appeared in the C2-position of lactate, with higher enrichment in the livers in the glycogenolytic state. It is interesting to note that although glucose-6-phosphatase/glucokinase and fructose 1,6-bisphosphatase/6-phosphofructo-1-kinase are both important sites of control for the glycolytic/gluconeogenic pathway (25), only pyruvate kinase caused measurable changes in the temporal evolution of metabolites of DHA as a result of differences in nutritional state. Estimates of the apparent rate constants for all metabolites above pyruvate kinase (Fig. 1) gave values in the range of k = 0.26 to 0.49 s−1 (Table 1), but the rate for the appearance of pyruvate (e.g. lactate, alanine) was only k = 0.03 to 0.04 s−1 (Table 1, Fig. 5). It is conventionally held that inhibition of pyruvate kinase should be maximized under gluconeogenic conditions, yet the difference in kpyruvate between the two perfusion conditions was not significant. However, a strict comparison of these rate constants is not possible in this setting because the concentration of extracellular pyruvate was not the same in the two nutritional states.
Simultaneous Estimates of Glycolysis and Gluconeogenesis
Bidirectional flux through gluconeogenesis and glycolysis has been demonstrated in the steady state in isolated hepatocytes using [6-3H]glucose and [U-14C]glycerol. These observations suggest that multiple pools of triose phosphates must exist in the liver and that glycolysis and gluconeogenesis function simultaneously in a single hepatocyte (12). The results observed in the current study, the simultaneous production of glucose and pyruvate in the intact liver, cannot arise from preferential uptake of different tracers by different cell types because only a single labeled compound was studied. Although different cell populations cannot be excluded in the current study, the overall state of the liver, either glycogenolytic or gluconeogenic based on independent measurements, was quite different. Nevertheless, evidence for flux through both glycolytic and gluconeogenic pathways was observed. Together, these results support and extend the earlier observation of bidirectional flux.
The ability of DHA to simultaneously detect glycolysis and gluconeogenesis lies in its long T1 and its entry point into the pathways, where it can be rapidly phosphorylated and incorporated into the triose phosphates. Simultaneous flux toward glucose and pyruvate indicates that net hepatic GNG is perhaps subject to a futile cycle, in addition to the various futile cycles already known to exert control of single enzymatic steps within GNG (26). Regulation by futile cycles facilitates fine control of homeostasis (27). The push-pull relationship between glycogenolysis and gluconeogenesis is important in a variety of disorders and is sensitive to pharmacological intervention as well as gene expression. HP DHA should be an important tool for understanding this equilibrium in relevant tissues.
To our knowledge, this is the first agent that has been successfully used to detect the direct formation of glucose by hyperpolarization methods, although glycolysis has been detected using [U-2H,U-13C]glucose. In that case, the only metabolites observed downstream of glucose were [13C]bicarbonate, attributed to pentose phosphate pathway flux, and lactate labeled at the C1 position (28). In a cell culture system, DHAP and 3-phosphoglycerate were also observed following the injection of [U-2H,U-13C]glucose and detection using a shaped pulse protocol (23). Regulation of glycolysis versus gluconeogenesis has been attributed to three loci at glucokinase/glucose-6-phosphatase, at fructose-1,6-bisphosphatase/6-phosphofructo-1-kinase, and at pyruvate kinase/phosphoenolpyruvate carboxykinase. On the timescale of the hyperpolarization experiment, the passage of DHA to glucose is fast. Under either metabolic condition, glucose resonances appear nearly concurrently with the G3P and also with the parent DHA molecule. Surprisingly, that is not the case for metabolites derived from PEP as they all reach maxima later in time than the other metabolites (Fig. 5). However, estimates of rate constants will be addressed in a later study as modeling of the kinetics requires precise knowledge of the delivery function of the DHA to the liver in the perfusion rig. Although such a model can be postulated, estimates of the delivery are difficult due to mixing of the DHA bolus with the unpolarized perfusate supplying the liver.
As compared with steady state isotope methods, the hyperpolarization protocol demonstrated here has significant advantages in its application. First, the results are not model-dependent in the sense that a steady state distribution of the labels is not presumed. Second, other methods depend upon the appearance of label in the products of gluconeogenesis and glycogenolysis. HP DHA has the singular advantage of monitoring the appearance of not only the products, but also the intermediates as a function of time. Therefore, we believe HP DHA may have utility in the investigation of kinetics in specific enzymatic steps that otherwise are only indirectly monitored by steady state isotope methods. This advantage could be utilized in studying the effects of a variety of inhibitors that already exist or are being developed for each enzymatic step of glycolysis or gluconeogenesis.
Limitations of the Current Study
The perfused liver is an ideal model system as the choice of substrate is easily controlled. However, several steps can be taken to modify the perfusate that would allow results more indicative of normal metabolism to be observed. First, the medium chain fatty acid octanoate does not require carnitine palmitoyltransferase-I (CPT1) for transport into the mitochondria. Therefore, β-oxidation is not regulated at this step in these livers. Preparations using long chain fatty acids will produce a model that more accurately tracks in vivo metabolism. Similarly, the addition of pyruvate at 2 mm concentration is not physiological. A better rendition of hepatic metabolism would use a 10:1 lactate/pyruvate ratio to preserve the cytosolic redox state. Given that GNG is up-regulated when the cytosol is reduced, this change in perfusate should actually result in larger signal from GNG processes to be observed. Of course, the in vivo case is still more complicated than the perfused condition can truly replicate. Future work will attempt to use HP DHA for studying in vivo metabolism. In addition, optimization of the detection scheme to use shaped pulses for detection of downstream metabolites would enhance the sensitivity significantly as rectangular pulses were used for excitation of the resonances (29). The broadband excitation results in unneeded destruction of polarization in DHA. The use of shaped pulses for the detection of downstream metabolites and small flip angles on the parent molecule is now a common method in the field (24, 30).
Acknowledgments
We thank Charles Storey, Angela Milde, and Nicholas Carpenter for performing the liver perfusions.
This work was supported, in whole or in part, by National Institutes of Health Grants P41 EB015908 (to K. X. M., C. R. M., and M. E. M.), R01 DK058398 (to S. S. and S. C. B.), R01 CA157996 (to R. J. D.), and R21 EB016197 and R37 HL34557 (to M. E. M.). This work was also supported by Robert A. Welch Foundation Grants I-1733 (to R. J. D.) and I-1804-01 (to S. C. B.) and the Damon Runyon Cancer Research Foundation (to R. J. D.), and Cancer Prevention Research Institute of Texas (CPRIT) Grant RP-101243 (to M. E. M.).
- HP
- hyperpolarized
- DHA
- dihydroxyacetone
- DHAP
- dihydroxyacetone phosphate
- G3P
- glycerol 3-phosphate
- GA3P
- glyceraldehyde 3-phosphate
- G6P
- glucose 6-phosphate
- PEP
- phosphoenolpyruvate
- MAG
- monoacetone glucose
- GNG
- gluconeogenesis
- T
- tesla
- gww
- grams of wet weight.
REFERENCES
- 1. Jones J. G., Naidoo R., Sherry A. D., Jeffrey F. M., Cottam G. L., Malloy C. R. (1997) Measurement of gluconeogenesis and pyruvate recycling in the rat liver: a simple analysis of glucose and glutamate isotopomers during metabolism of [1,2,3-13C3]propionate. FEBS Lett. 412, 131–137 [DOI] [PubMed] [Google Scholar]
- 2. Jones J. G., Solomon M. A., Cole S. M., Sherry A. D., Malloy C. R. (2001) An integrated 2H and 13C NMR study of gluconeogenesis and TCA cycle flux in humans. Am. J. Physiol. Endocrinol. Metab. 281, E848–E856 [DOI] [PubMed] [Google Scholar]
- 3. Landau B. R., Wahren J., Chandramouli V., Schumann W. C., Ekberg K., Kalhan S. C. (1995) Use of 2H2O for estimating rates of gluconeogenesis: application to the fasted state. J. Clin. Invest. 95, 172–178 [DOI] [PMC free article] [PubMed] [Google Scholar]
- 4. Neese R. A., Schwarz J. M., Faix D., Turner S., Letscher A., Vu D., Hellerstein M. K. (1995) Gluconeogenesis and intrahepatic triose phosphate flux in response to fasting or substrate loads: application of the mass isotopomer distribution analysis technique with testing of assumptions and potential problems. J. Biol. Chem. 270, 14452–14466 [DOI] [PubMed] [Google Scholar]
- 5. Petersen K. F., Price T., Cline G. W., Rothman D. L., Shulman G. I. (1996) Contribution of net hepatic glycogenolysis to glucose production during the early postprandial period. Am. J. Physiol. 270, E186–E191 [DOI] [PubMed] [Google Scholar]
- 6. Rothman D. L., Magnusson I., Katz L. D., Shulman R. G., Shulman G. I. (1991) Quantitation of hepatic glycogenolysis and gluconeogenesis in fasting humans with 13C NMR. Science 254, 573–576 [DOI] [PubMed] [Google Scholar]
- 7. Tayek J. A., Katz J. (1996) Glucose production, recycling, and gluconeogenesis in normals and diabetics: a mass isotopomer [U-13C]glucose study. Am. J. Physiol. 270, E709–E717 [DOI] [PubMed] [Google Scholar]
- 8. Ardenkjaer-Larsen J. H., Fridlund B., Gram A., Hansson G., Hansson L., Lerche M. H., Servin R., Thaning M., Golman K. (2003) Increase in signal-to-noise ratio of > 10,000 times in liquid-state NMR. Proc. Natl. Acad. Sci. U.S.A. 100, 10158–10163 [DOI] [PMC free article] [PubMed] [Google Scholar]
- 9. Lee P., Leong W., Tan T., Lim M., Han W., Radda G. K. (2013) In vivo hyperpolarized carbon-13 magnetic resonance spectroscopy reveals increased pyruvate carboxylase flux in an insulin-resistant mouse model. Hepatology 57, 515–524 [DOI] [PubMed] [Google Scholar]
- 10. Merritt M. E., Harrison C., Sherry A. D., Malloy C. R., Burgess S. C. (2011) Flux through hepatic pyruvate carboxylase and phosphoenolpyruvate carboxykinase detected by hyperpolarized 13C magnetic resonance. Proc. Natl. Acad. Sci. U.S.A. 108, 19084–19089 [DOI] [PMC free article] [PubMed] [Google Scholar]
- 11. Hems R., Ross B. D., Berry M. N., Krebs H. A. (1966) Gluconeogenesis in the perfused rat liver. Biochem. J. 101, 284–292 [DOI] [PMC free article] [PubMed] [Google Scholar]
- 12. Phillips J. W., Jones M. E., Berry M. N. (2002) Implications of the simultaneous occurrence of hepatic glycolysis from glucose and gluconeogenesis from glycerol. Eur. J. Biochem. 269, 792–797 [DOI] [PubMed] [Google Scholar]
- 13. Patyal B. R., Gao J.-H., Williams R. F., Roby J., Saam B., Rockwell B. A., Thomas R. J., Stolarski D. J., Fox P. T. (1997) Longitudinal relaxation and diffusion measurements using magnetic resonance signals from laser-hyperpolarized 129Xe nuclei. J. Magn. Reson. 126, 58–65 [DOI] [PubMed] [Google Scholar]
- 14. Colet J.-M., Muller R. N. (1994) Effect of opsonins on the uptake of magnetic starch microspheres by rat Kupffer cells. MAGMA 2, 303–305 [Google Scholar]
- 15. Burgess S. C., Hausler N., Merritt M., Jeffrey F. M. H., Storey C., Milde A., Koshy S., Lindner J., Magnuson M. A., Malloy C. R., Sherry A. D. (2004) Impaired tricarboxylic acid cycle activity in mouse livers lacking cytosolic phosphoenolpyruvate carboxykinase. J. Biol. Chem. 279, 48941–48949 [DOI] [PubMed] [Google Scholar]
- 16. Bergmeyer H. U. (ed) (1984) Methods of Enzymatic Analysis, Vol. 6, Metabolites 1: Carbohydrates, 3rd Ed, pp. 1198–1201, John Wiley & Sons, Inc., New York [Google Scholar]
- 17. Hausler N., Browning J., Merritt M., Storey C., Milde A., Jeffrey F. M. H., Sherry A. D., Malloy C. R., Burgess S. C. (2006) Effects of insulin and cytosolic redox state on glucose production pathways in the isolated perfused mouse liver measured by integrated 2H and 13C NMR. Biochem. J. 394, 465–473 [DOI] [PMC free article] [PubMed] [Google Scholar]
- 18. Burgess S. C., Weis B., Jones J. G., Smith E., Merritt M. E., Margolis D., Dean Sherry A., Malloy C. R. (2003) Noninvasive evaluation of liver metabolism by 2H and 13C NMR isotopomer analysis of human urine. Anal. Biochem. 312, 228–234 [DOI] [PubMed] [Google Scholar]
- 19. Jin E. S., Jones J. G., Merritt M., Burgess S. C., Malloy C. R., Sherry A. D. (2004) Glucose production, gluconeogenesis, and hepatic tricarboxylic acid cycle fluxes measured by nuclear magnetic resonance analysis of a single glucose derivative. Anal. Biochem. 327, 149–155 [DOI] [PubMed] [Google Scholar]
- 20. Burgess S. C., Jeffrey F. M. H., Storey C., Milde A., Hausler N., Merritt M. E., Mulder H., Holm C., Sherry A. D., Malloy C. R. (2005) Effect of murine strain on metabolic pathways of glucose production after brief or prolonged fasting. Am. J. Physiol. Endocrinol. Metab. 289, E53–E61 [DOI] [PubMed] [Google Scholar]
- 21. Burgess S. C., Nuss M., Chandramouli V., Hardin D. S., Rice M., Landau B. R., Malloy C. R., Sherry A. D. (2003) Analysis of gluconeogenic pathways in vivo by distribution of 2H in plasma glucose: comparison of nuclear magnetic resonance and mass spectrometry. Anal. Biochem. 318, 321–324 [DOI] [PubMed] [Google Scholar]
- 22. Satapati S., Sunny N. E., Kucejova B., Fu X., He T. T., Méndez-Lucas A., Shelton J. M., Perales J. C., Browning J. D., Burgess S. C. (2012) Elevated TCA cycle function in the pathology of diet-induced hepatic insulin resistance and fatty liver. J. Lipid Res. 53, 1080–1092 [DOI] [PMC free article] [PubMed] [Google Scholar]
- 23. Harris T., Degani H., Frydman L. (2013) Hyperpolarized 13C NMR studies of glucose metabolism in living breast cancer cell cultures. NMR Biomed. 26, 1831–1843 [DOI] [PubMed] [Google Scholar]
- 24. Lau A. Z., Chen A. P., Ghugre N. R., Ramanan V., Lam W. W., Connelly K. A., Wright G. A., Cunningham C. H. (2010) Rapid multislice imaging of hyperpolarized 13C pyruvate and bicarbonate in the heart. Magn. Reson. Med. 64, 1323–1331 [DOI] [PubMed] [Google Scholar]
- 25. Pilkis S. J., Granner D. K. (1992) Molecular physiology of the regulation of hepatic gluconeogenesis and glycolysis. Annu. Rev. Physiol. 54, 885–909 [DOI] [PubMed] [Google Scholar]
- 26. Hue L. (1981) The role of futile cycles in the regulation of carbohydrate metabolism in the liver. Adv. Enzymol. Relat. Areas Mol. Biol. 52, 247–331 [DOI] [PubMed] [Google Scholar]
- 27. Qian H., Beard D. A. (2006) Metabolic futile cycles and their functions: a systems analysis of energy and control. Syst. Biol. (Stevenage) 153, 192–200 [DOI] [PubMed] [Google Scholar]
- 28. Rodrigues T. B., Serrao E. M., Kennedy B. W., Hu D. E., Kettunen M. I., Brindle K. M. (2014) Magnetic resonance imaging of tumor glycolysis using hyperpolarized 13C-labeled glucose. Nat. Med. 20, 93–97 [DOI] [PMC free article] [PubMed] [Google Scholar]
- 29. Yang C., Harrison C., Jin E. S., Chuang D. T., Sherry A. D., Malloy C. R., Merritt M. E., DeBerardinis R. J. (2014) Simultaneous steady-state and dynamic 13C NMR can differentiate alternative routes of pyruvate metabolism in living cancer cells. J. Biol. Chem. 289, 6212–6224 [DOI] [PMC free article] [PubMed] [Google Scholar]
- 30. Larson P. E., Hu S., Lustig M., Kerr A. B., Nelson S. J., Kurhanewicz J., Pauly J. M., Vigneron D. B. (2011) Fast dynamic 3D MR spectroscopic imaging with compressed sensing and multiband excitation pulses for hyperpolarized 13C studies. Magn. Reson. Med. 65, 610–619 [DOI] [PMC free article] [PubMed] [Google Scholar]